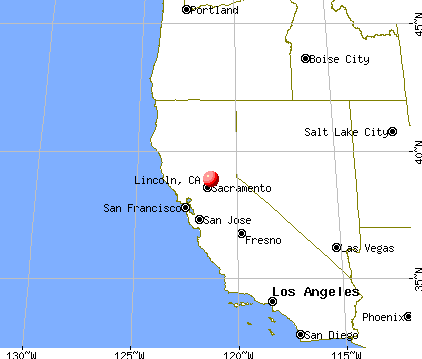
Lincoln, California
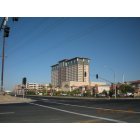
Lincoln: Thunder Valley Casino & Resort
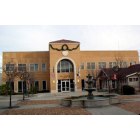
Lincoln: City Hall

Lincoln: Camp Far West Lake, Lincoln, CA
Lincoln: Lake of Catta Verdera, Lincoln Ca

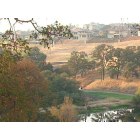
Lincoln: Backroad in Lincoln
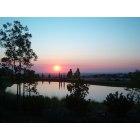
Lincoln: Verdera Lake, Lincoln, CA.
Lincoln: Catta Verdera Golf Course and Clubhouse

Lincoln: Thunder Valley Casino & Resort

Lincoln: Thunder Valley Resort & Casino
Lincoln: Morning Glory Coffee House

Lincoln: Thunder Valley Resort & Casino
- add
your
Submit your own pictures of this city and show them to the world
- OSM Map
- General Map
- Google Map
- MSN Map

Population change since 2000: +368.8%
| Males: 25,123 | |
| Females: 27,411 |
| Median resident age: | 45.0 years |
| California median age: | 37.9 years |
Zip codes: 95648.
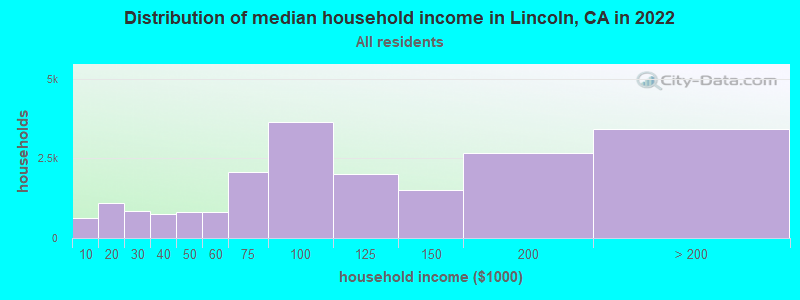
| Lincoln: | $95,861 |
| CA: | $91,551 |
Estimated per capita income in 2022: $51,051 (it was $19,447 in 2000)
Lincoln city income, earnings, and wages data
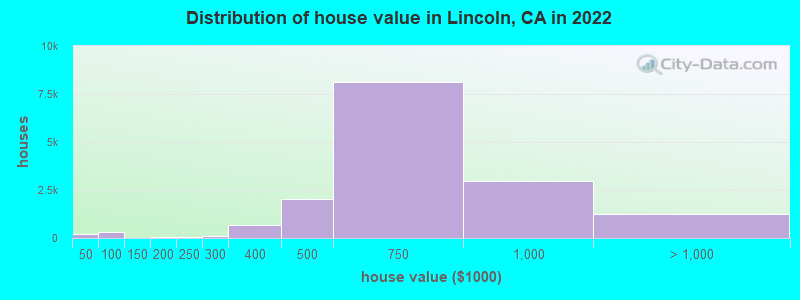
Estimated median house or condo value in 2022: $646,546 (it was $141,700 in 2000)
| Lincoln: | $646,546 |
| CA: | $715,900 |
Mean prices in 2022: all housing units: $654,512; detached houses: $666,715; townhouses or other attached units: $374,851; in 3-to-4-unit structures: $329,457; in 5-or-more-unit structures: $756,197; mobile homes: $124,582
Median gross rent in 2022: $2,103.
(6.0% for White Non-Hispanic residents, 13.6% for Hispanic or Latino residents, 23.7% for American Indian residents, 19.0% for other race residents, 12.5% for two or more races residents)
Detailed information about poverty and poor residents in Lincoln, CA


Compare current foreclosures in Lincoln, CA:
| Photo | Address | Area | Beds / Baths | Price | Details |
|---|---|---|---|---|---|

|
#1
Portello Way
Lincoln, CA 95648
|
2,927 sq. feet
|
4 baths 4 beds |
show details | |

|
#2
246 Lariat
Lincoln, CA 95648
|
1,815 sq. feet
|
2 baths 2 beds |
show details | |

|
#3
Red Clover Way
Lincoln, CA 95648
|
1,343 sq. feet
|
2 baths 3 beds |
show details | |

|
#4
Hillsdale Ln
Lincoln, CA 95648
|
2,298 sq. feet
|
3 baths 4 beds |
show details | |

|
#5
Q St
Lincoln, CA 95648
|
1,204 sq. feet
|
1 baths 3 beds |
show details | |

|
#6
Cattail Ct
Lincoln, CA 95648
|
2,871 sq. feet
|
3 baths 4 beds |
show details | |

|
#7
Hidden Hills Ln
Lincoln, CA 95648
|
1,515 sq. feet
|
2 baths 2 beds |
show details | |

|
#8
Canvasback Cir
Lincoln, CA 95648
|
1,827 sq. feet
|
3 baths 3 beds |
show details | |

|
#9
Longspur Loop
Lincoln, CA 95648
|
1,836 sq. feet
|
2 baths 2 beds |
show details | |

|
#10
Courtyards Loop
Lincoln, CA 95648
|
2,142 sq. feet
|
2 baths 3 beds |
show details |
| Photo | Address | Area | Beds / Baths | Price | Details |
|---|---|---|---|---|---|

|
#11
Hidden Hills Ln
Lincoln, CA 95648
|
1,813 sq. feet
|
2 baths 2 beds |
show details | |

|
#12
Larkflower Way
Lincoln, CA 95648
|
1,732 sq. feet
|
2 baths 3 beds |
show details | |

|
#13
Cornerstone Ct
Lincoln, CA 95648
|
1,650 sq. feet
|
2 baths 3 beds |
show details | |

|
#14
A St
Lincoln, CA 95648
|
1,018 sq. feet
|
1 baths 2 beds |
show details | |

|
#15
Larkflower Way
Lincoln, CA 95648
|
1,530 sq. feet
|
2 baths 3 beds |
show details | |

|
#16
Longspur Loop
Lincoln, CA 95648
|
1,655 sq. feet
|
2 baths 2 beds |
show details | |

|
#17
Silverton Cir
Lincoln, CA 95648
|
3,081 sq. feet
|
2 baths 4 beds |
show details | |

|
#18
6th St
Lincoln, CA 95648
|
1,104 sq. feet
|
2 baths 3 beds |
show details | |

|
#19
Redcliffe Ln
Lincoln, CA 95648
|
2,827 sq. feet
|
2 baths 4 beds |
show details | |

|
#20
Mary Rose Ln
Lincoln, CA 95648
|
1,473 sq. feet
|
2 baths 2 beds |
show details |
| Photo | Address | Area | Beds / Baths | Price | Details |
|---|---|---|---|---|---|

|
#21
C St
Lincoln, CA 95648
|
1,056 sq. feet
|
1 baths 3 beds |
show details | |

|
#22
Ainsworth Ln
Lincoln, CA 95648
|
2,301 sq. feet
|
2 baths 4 beds |
show details | |

|
#23
Armida Ct
Lincoln, CA 95648
|
2,816 sq. feet
|
3 baths 4 beds |
show details | |

|
#24
Costa Ln
Lincoln, CA 95648
|
1,579 sq. feet
|
2 baths 3 beds |
show details | |

|
#25
Cullum Ct
Lincoln, CA 95648
|
3,227 sq. feet
|
3 baths 5 beds |
show details | |

|
#26
Phoenix Cir
Lincoln, CA 95648
|
1,265 sq. feet
|
2 baths 3 beds |
show details | |

|
#27
Southwick Ln
Lincoln, CA 95648
|
3,206 sq. feet
|
3 baths 4 beds |
show details | |

|
#28
Lindbergh Ln
Lincoln, CA 95648
|
1,053 sq. feet
|
2 baths 3 beds |
show details | |

|
#29
Gladding Rd
Lincoln, CA 95648
|
1,703 sq. feet
|
1 baths 3 beds |
show details | |

|
#30
Hidden Hills Ln
Lincoln, CA 95648
|
1,813 sq. feet
|
2 baths 2 beds |
show details |
| Photo | Address | Area | Beds / Baths | Price | Details |
|---|---|---|---|---|---|

|
#31
Laehr Dr
Lincoln, CA 95648
|
1,690 sq. feet
|
2 baths 3 beds |
show details | |

|
#32
1st St
Lincoln, CA 95648
|
1,300 sq. feet
|
1 baths 3 beds |
show details | |

|
#33
Eden Ln
Lincoln, CA 95648
|
1,958 sq. feet
|
2 baths 3 beds |
show details | |

|
#34
La Crena Ct
Lincoln, CA 95648
|
2,775 sq. feet
|
3 baths 4 beds |
show details | |

|
#35
Seymour Cir
Lincoln, CA 95648
|
2,032 sq. feet
|
2 baths 3 beds |
show details | |

|
#36
Heartland Ct
Lincoln, CA 95648
|
3,070 sq. feet
|
3 baths 5 beds |
show details | |

|
#37
Le Bourget Ln
Lincoln, CA 95648
|
- sq. feet
|
- baths - beds |
show details | |

|
#38
Vigo Ct
Lincoln, CA 95648
|
- sq. feet
|
- baths - beds |
show details | |

|
#39
Lincoln Airpark Dr
Lincoln, CA 95648
|
- sq. feet
|
- baths - beds |
show details | |

|
#40
Bartonville Rd
Lincoln, CA 95648
|
- sq. feet
|
- baths - beds |
show details |
| Photo | Address | Area | Beds / Baths | Price | Details |
|---|---|---|---|---|---|

|
#41
Citrus St
Lincoln, CA 95648
|
- sq. feet
|
- baths - beds |
show details | |

|
#42
C St
Lincoln, CA 95648
|
- sq. feet
|
- baths - beds |
show details | |

|
#43
Lincolnshire Cir
Lincoln, CA 95648
|
- sq. feet
|
- baths - beds |
show details | |

|
#44
Tucker Swallow Dr
Lincoln, CA 95648
|
- sq. feet
|
- baths - beds |
show details | |

|
#45
Green Ravine Dr
Lincoln, CA 95648
|
- sq. feet
|
- baths - beds |
show details | |

|
#46
Dripping Rock Ln
Lincoln, CA 95648
|
- sq. feet
|
- baths - beds |
show details | |

|
#47
Heartwood St
Lincoln, CA 95648
|
- sq. feet
|
- baths - beds |
show details | |

|
#48
Bunting Ln
Lincoln, CA 95648
|
- sq. feet
|
- baths - beds |
show details | |

|
#49
Poppintree Ln
Lincoln, CA 95648
|
- sq. feet
|
- baths - beds |
show details | |

|
Check over 1 million property listings on Foreclosure.com!
|
browse all offers | |||


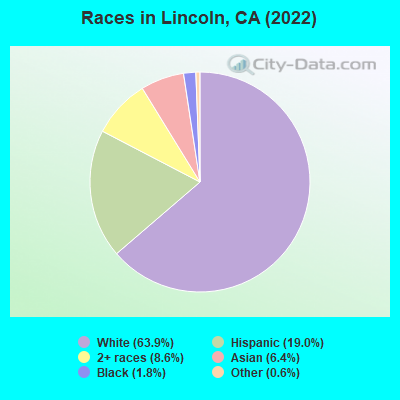
- 32,89063.9%White alone
- 9,81019.0%Hispanic
- 4,4158.6%Two or more races
- 3,2766.4%Asian alone
- 9211.8%Black alone
- 3230.6%Other race alone
- 430.08%American Indian alone
- 160.03%Native Hawaiian and Other
Pacific Islander alone
According to our research of California and other state lists, there were 47 registered sex offenders living in Lincoln, California as of May 26, 2024.
The ratio of all residents to sex offenders in Lincoln is 998 to 1.
The ratio of registered sex offenders to all residents in this city is lower than the state average.
The City-Data.com crime index weighs serious crimes and violent crimes more heavily. Higher means more crime, U.S. average is 246.1. It adjusts for the number of visitors and daily workers commuting into cities.
- means the value is smaller than the state average.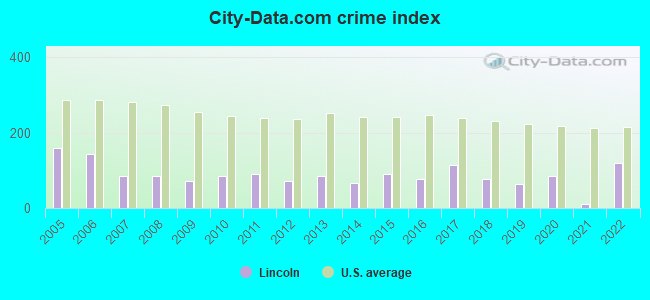
Crime rate in Lincoln detailed stats: murders, rapes, robberies, assaults, burglaries, thefts, arson
Full-time law enforcement employees in 2021, including police officers: 34 (23 officers - 21 male; 2 female).
| Officers per 1,000 residents here: | 0.46 |
| California average: | 2.30 |
 Recent articles from our blog. Our writers, many of them Ph.D. graduates or candidates, create easy-to-read articles on a wide variety of topics.

 | Lincoln vs Roseville? (20 replies) |
| As gentrification closes in, immigrants in Lincoln Heights find their American dream slipping away (13 replies) |
| Sun city lincoln hills comments (6 replies) |
| Sun city lincoln hills questions (1 reply) |
| Greater Sacramento Metro Area Election Results (45 replies) |
| Sun city lincoln hills and sun city roseville (0 replies) |
Latest news from Lincoln, CA collected exclusively by city-data.com from local newspapers, TV, and radio stations
Ancestries: English (9.6%), German (8.0%), American (7.4%), European (5.7%), Irish (5.3%), Italian (4.3%).
Current Local Time: PST time zone
Elevation: 164 feet
Land area: 18.3 square miles.
Population density: 2,872 people per square mile (average).
5,439 residents are foreign born (5.1% Asia, 3.0% Latin America, 2.2% Europe).
| This city: | 10.6% |
| California: | 26.5% |
Median real estate property taxes paid for housing units with mortgages in 2022: $5,859 (0.9%)
Median real estate property taxes paid for housing units with no mortgage in 2022: $5,377 (0.8%)
Nearest city with pop. 50,000+: Loomis Basin-Folsom Lake, CA  (8.3 miles , pop. 67,397).
Nearest city with pop. 200,000+: Sacramento, CA (24.8 miles , pop. 407,018).
Nearest city with pop. 1,000,000+: Los Angeles, CA (369.6 miles , pop. 3,694,820).
Nearest cities:
), ), ), ), Latitude: 38.89 N, Longitude: 121.30 W
Daytime population change due to commuting: -6,943 (-13.5%)
Workers who live and work in this city: 6,966 (33.6%)
Area code: 916

Lincoln tourist attractions:
Lincoln, California accommodation & food services, waste management - Economy and Business Data
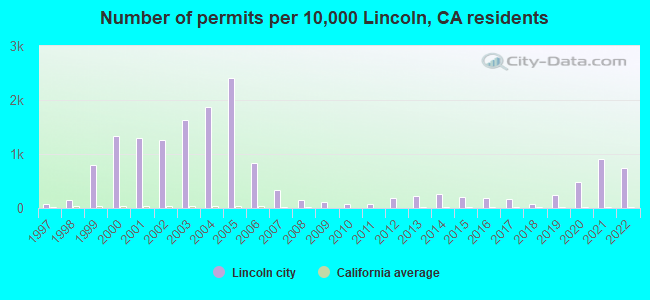
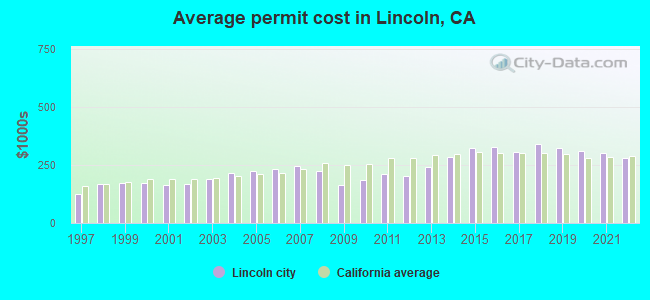
Single-family new house construction building permits:
- 2022: 826 buildings, average cost: $281,400
- 2021: 1016 buildings, average cost: $301,100
- 2020: 546 buildings, average cost: $311,600
- 2019: 260 buildings, average cost: $322,200
- 2018: 92 buildings, average cost: $340,700
- 2017: 181 buildings, average cost: $306,000
- 2016: 217 buildings, average cost: $328,100
- 2015: 233 buildings, average cost: $321,700
- 2014: 286 buildings, average cost: $284,100
- 2013: 248 buildings, average cost: $243,400
- 2012: 216 buildings, average cost: $204,900
- 2011: 92 buildings, average cost: $211,400
- 2010: 90 buildings, average cost: $186,500
- 2009: 122 buildings, average cost: $162,800
- 2008: 165 buildings, average cost: $225,100
- 2007: 379 buildings, average cost: $244,900
- 2006: 938 buildings, average cost: $233,400
- 2005: 2689 buildings, average cost: $225,700
- 2004: 2099 buildings, average cost: $213,600
- 2003: 1817 buildings, average cost: $189,100
- 2002: 1415 buildings, average cost: $170,000
- 2001: 1448 buildings, average cost: $162,600
- 2000: 1490 buildings, average cost: $174,000
- 1999: 888 buildings, average cost: $173,400
- 1998: 173 buildings, average cost: $167,500
- 1997: 80 buildings, average cost: $126,700
| Here: | 4.5% |
| California: | 5.1% |
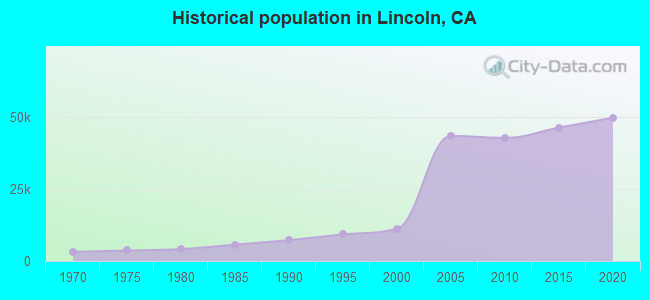
Population change in the 1990s: +3,607 (+47.5%).
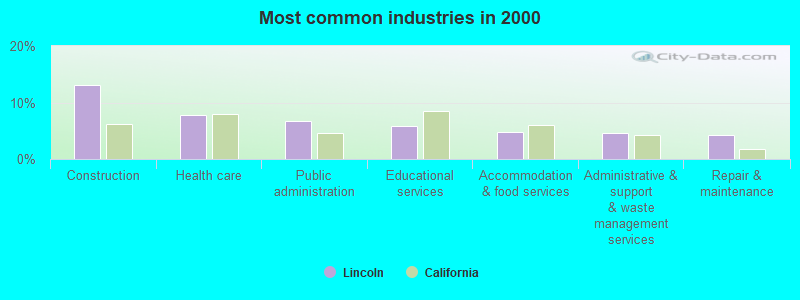
- Construction (13.1%)
- Health care (7.7%)
- Public administration (6.7%)
- Educational services (5.8%)
- Accommodation & food services (4.7%)
- Administrative & support & waste management services (4.5%)
- Repair & maintenance (4.2%)
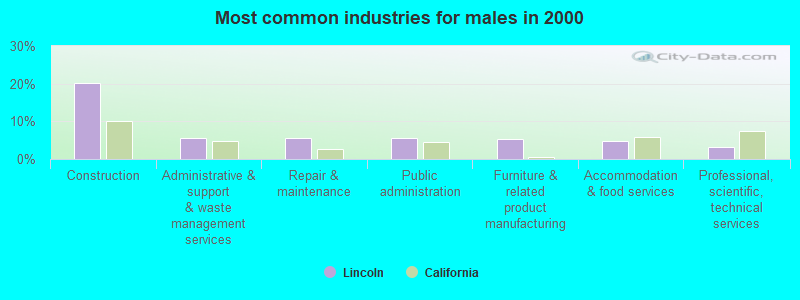
- Construction (20.1%)
- Administrative & support & waste management services (5.6%)
- Repair & maintenance (5.5%)
- Public administration (5.5%)
- Furniture & related product manufacturing (5.3%)
- Accommodation & food services (4.7%)
- Professional, scientific, technical services (3.3%)
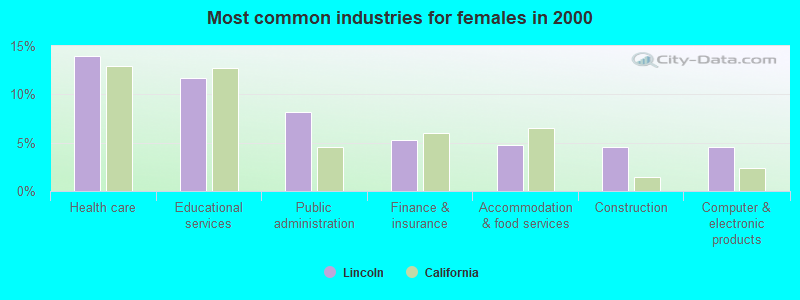
- Health care (14.0%)
- Educational services (11.7%)
- Public administration (8.2%)
- Finance & insurance (5.3%)
- Accommodation & food services (4.7%)
- Construction (4.6%)
- Computer & electronic products (4.6%)
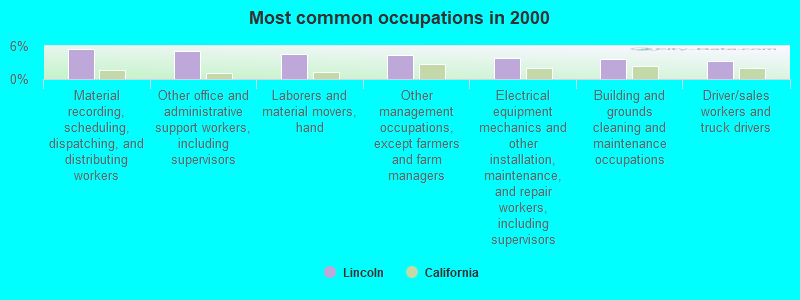
- Material recording, scheduling, dispatching, and distributing workers (5.5%)
- Other office and administrative support workers, including supervisors (5.2%)
- Laborers and material movers, hand (4.5%)
- Other management occupations, except farmers and farm managers (4.3%)
- Electrical equipment mechanics and other installation, maintenance, and repair workers, including supervisors (3.7%)
- Building and grounds cleaning and maintenance occupations (3.6%)
- Driver/sales workers and truck drivers (3.3%)
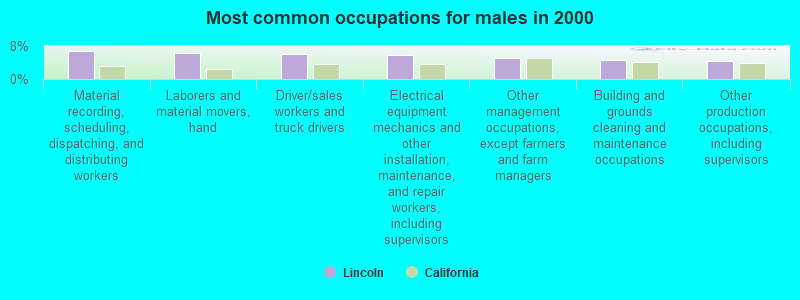
- Material recording, scheduling, dispatching, and distributing workers (6.8%)
- Laborers and material movers, hand (6.3%)
- Driver/sales workers and truck drivers (5.9%)
- Electrical equipment mechanics and other installation, maintenance, and repair workers, including supervisors (5.9%)
- Other management occupations, except farmers and farm managers (5.2%)
- Building and grounds cleaning and maintenance occupations (4.5%)
- Other production occupations, including supervisors (4.3%)
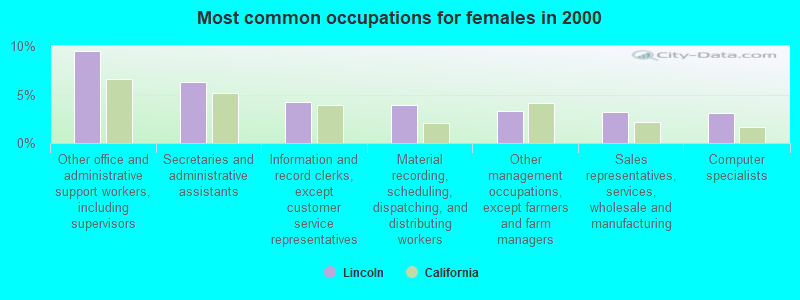
- Other office and administrative support workers, including supervisors (9.4%)
- Secretaries and administrative assistants (6.3%)
- Information and record clerks, except customer service representatives (4.2%)
- Material recording, scheduling, dispatching, and distributing workers (3.9%)
- Other management occupations, except farmers and farm managers (3.3%)
- Sales representatives, services, wholesale and manufacturing (3.2%)
- Computer specialists (3.1%)
Average climate in Lincoln, California
Based on data reported by over 4,000 weather stations


|
|


(lower is better)
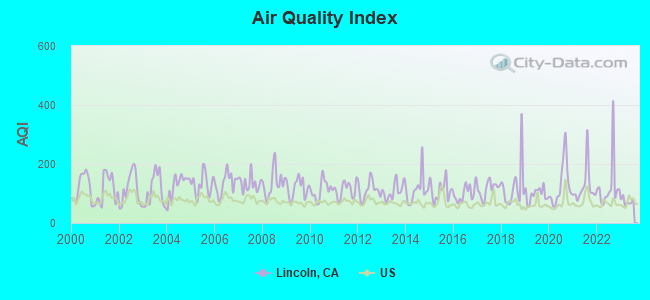
Air Quality Index (AQI) level in 2023 was 73.5. This is about average.
| City: | 73.5 |
| U.S.: | 72.6 |
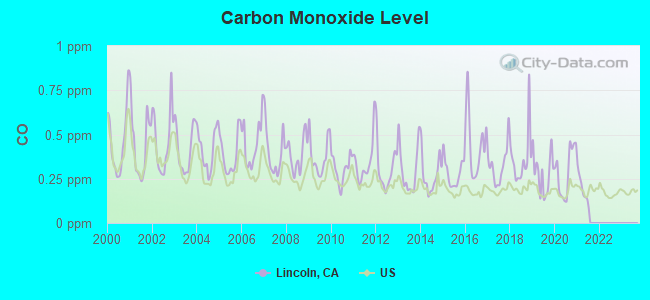
Carbon Monoxide (CO) [ppm] level in 2021 was 0.194. This is better than average. Closest monitor was 8.0 miles away from the city center.
| City: | 0.194 |
| U.S.: | 0.251 |
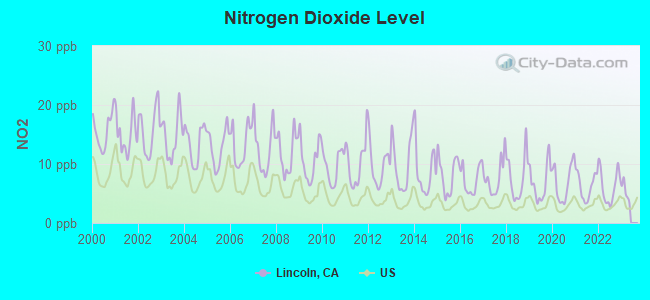
Nitrogen Dioxide (NO2) [ppb] level in 2022 was 6.23. This is worse than average. Closest monitor was 8.0 miles away from the city center.
| City: | 6.23 |
| U.S.: | 5.11 |
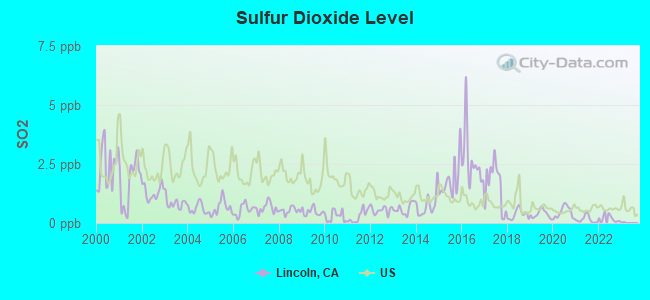
Sulfur Dioxide (SO2) [ppb] level in 2022 was 0.207. This is significantly better than average. Closest monitor was 12.9 miles away from the city center.
| City: | 0.207 |
| U.S.: | 1.515 |
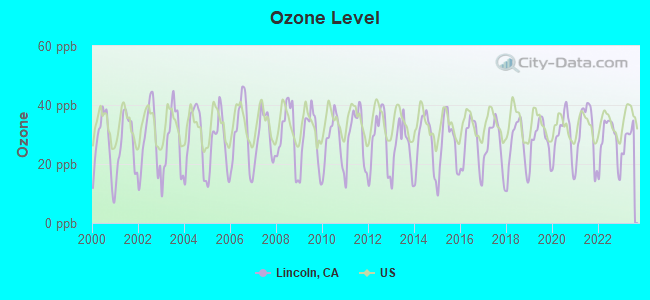
Ozone [ppb] level in 2023 was 29.1. This is about average. Closest monitor was 0.4 miles away from the city center.
| City: | 29.1 |
| U.S.: | 33.3 |
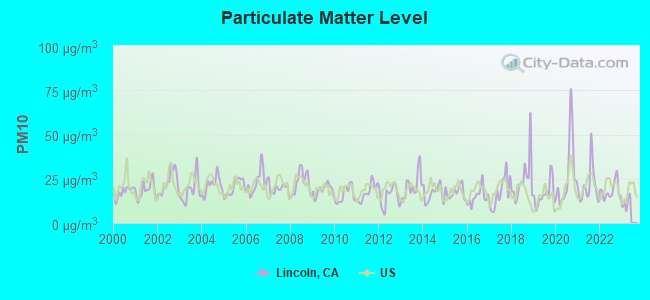
Particulate Matter (PM10) [µg/m3] level in 2022 was 18.2. This is about average. Closest monitor was 0.7 miles away from the city center.
| City: | 18.2 |
| U.S.: | 19.2 |
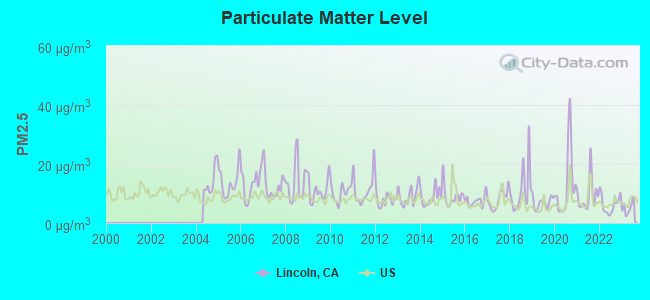
Particulate Matter (PM2.5) [µg/m3] level in 2023 was 5.12. This is significantly better than average. Closest monitor was 9.9 miles away from the city center.
| City: | 5.12 |
| U.S.: | 8.11 |
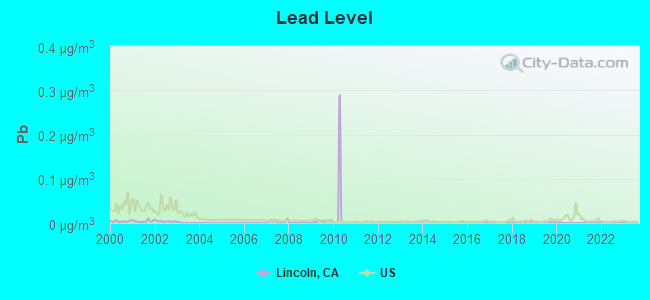
Lead (Pb) [µg/m3] level in 2023 was 0.00140. This is significantly better than average. Closest monitor was 9.9 miles away from the city center.
| City: | 0.00140 |
| U.S.: | 0.00931 |
Earthquake activity:
Lincoln-area historical earthquake activity is significantly above California state average. It is 7483% greater than the overall U.S. average.On 4/18/1906 at 13:12:21, a magnitude 7.9 (7.9 UK, Class: Major, Intensity: VIII - XII) earthquake occurred 110.8 miles away from Lincoln center, causing $524,000,000 total damage
On 10/3/1915 at 06:52:48, a magnitude 7.6 (7.6 UK) earthquake occurred 230.8 miles away from the city center
On 10/18/1989 at 00:04:15, a magnitude 7.1 (6.5 MB, 7.1 MS, 6.9 MW, 7.0 ML) earthquake occurred 125.6 miles away from Lincoln center, causing 62 deaths (62 shaking deaths) and 3757 injuries, causing $1,305,032,704 total damage
On 1/31/1922 at 13:17:28, a magnitude 7.6 (7.6 UK) earthquake occurred 258.6 miles away from the city center
On 12/21/1932 at 06:10:09, a magnitude 7.2 (7.2 UK) earthquake occurred 175.3 miles away from the city center
On 4/25/1992 at 18:06:04, a magnitude 7.2 (6.3 MB, 7.1 MS, 7.2 MW, 7.1 MW, Depth: 9.4 mi) earthquake occurred 179.0 miles away from the city center, causing $75,000,000 total damage
Magnitude types: body-wave magnitude (MB), local magnitude (ML), surface-wave magnitude (MS), moment magnitude (MW)
Natural disasters:
The number of natural disasters in Placer County (17) is near the US average (15).Major Disasters (Presidential) Declared: 9
Emergencies Declared: 2
Causes of natural disasters: Floods: 10, Storms: 6, Fires: 4, Landslides: 4, Mudslides: 3, Winter Storms: 3, Drought: 1, Heavy Rain: 1, Hurricane: 1, Tornado: 1, Other: 1 (Note: some incidents may be assigned to more than one category).
Hospitals and medical centers in Lincoln:
Other hospitals and medical centers near Lincoln:
- CASA DEL MAR #3 (Hospital, about 6 miles away; PENRYN, CA)
- RAI FAIRWAY ROCKLIN (Dialysis Facility, about 7 miles away; ROCKLIN, CA)
- RAI SECRET RAVINE PARKWAY (Dialysis Facility, about 9 miles away; ROSEVILLE, CA)
- KAISER FOUNDATION HOSPITAL - ROSEVILLE Acute Care Hospitals (about 10 miles away; ROSEVILLE, CA)
- RAI HARDING BLVD (Dialysis Facility, about 10 miles away; ROSEVILLE, CA)
- SUTTER VISITING NURSE ASSOCIATION AND HOSPICE (Home Health Center, about 10 miles away; ROSEVILLE, CA)
- MAXIM HEALTHCARE SERVICES, INC (Home Health Center, about 10 miles away; ROSEVILLE, CA)
Airports located in Lincoln:
- Lincoln Regional/Karl Harder Field Airport (LHM) (Runways: 2, Air Taxi Ops: 3,200, Itinerant Ops: 34,100, Local Ops: 37,100)
Amtrak stations near Lincoln:
- 8 miles: ROCKLIN (ROCKLIN RD. & RAILROAD AVE.) - Bus Station . Services: partially wheelchair accessible, free short-term parking.
- 10 miles: ROSEVILLE (201 PACIFIC ST.) . Services: partially wheelchair accessible, public payphones, free short-term parking, free long-term parking, taxi stand, intercity bus service.
- 12 miles: AUBURN (NEVADA & FULWEILER STS.) - Bus Station . Services: fully wheelchair accessible, public payphones, free short-term parking.
Colleges/universities with over 2000 students nearest to Lincoln:
- Sierra College (about 8 miles; Rocklin, CA; Full-time enrollment: 11,488)
- American River College (about 17 miles; Sacramento, CA; FT enrollment: 20,452)
- Folsom Lake College (about 19 miles; Folsom, CA; FT enrollment: 5,308)
- Universal Technical Institute of Northern California Inc (about 21 miles; Sacramento, CA; FT enrollment: 3,193)
- Yuba College (about 22 miles; Marysville, CA; FT enrollment: 4,737)
- University of Phoenix-Sacramento Valley Campus (about 23 miles; Sacramento, CA; FT enrollment: 2,855)
- California State University-Sacramento (about 24 miles; Sacramento, CA; FT enrollment: 22,234)
Public high schools in Lincoln:
- HORIZON CHARTER (Students: 1,941, Location: 2800 NICOLAUS RD., STE. 100, Grades: KG-12, Charter school)
- LINCOLN HIGH (Students: 1,040, Location: 790 J ST., Grades: 9-12)
- PHOENIX HIGH (CONTINUATION) (Students: 29, Location: 870 J ST., Grades: 9-12)
- PARTNERSHIPS FOR STUDENT-CENTERED LEARNING (Location: 2800 NICOLAUS RD., STE. 100, Grades: KG-12, Charter school)
Public elementary/middle schools in Lincoln:
- TWELVE BRIDGES MIDDLE (Students: 777, Location: 770 W.VIEW DR., Grades: 6-8)
- GLEN EDWARDS MIDDLE (Students: 589, Location: 204 L ST., Grades: 6-8)
- TWELVE BRIDGES ELEMENTARY (Students: 456, Location: 2450 E.RIDGE DR., Grades: KG-5)
- LINCOLN CROSSING ELEMENTARY (Students: 358, Location: 635 GROVELAND LN., Grades: KG-5)
- CREEKSIDE OAKS ELEMENTARY (Students: 344, Location: 2030 FIRST ST., Grades: KG-5)
- FOSKETT RANCH ELEMENTARY (Students: 292, Location: 1561 JOINER PKWY., Grades: KG-5)
- FIRST STREET (Students: 264, Location: 1400 FIRST ST., Grades: KG-5)
- CARLIN C. COPPIN ELEMENTARY (Students: 252, Location: 150 12TH ST., Grades: KG-5)
Private elementary/middle school in Lincoln:
Points of interest:
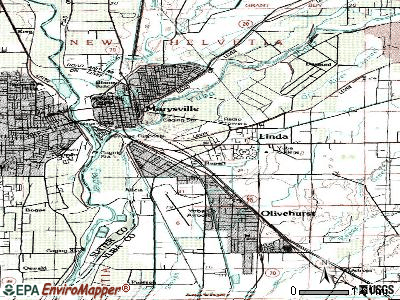
Notable locations in Lincoln: Lincoln Rodeo Grounds (A), Lincoln Public Library (B), Lincoln City Hall (C), Placer County Fire Department Station 33 / Lincoln City Fire Department Station 1 (D), Placer County Fire Department Station 35 / Lincoln City Fire Department Station 3 (E), Placer County Fire Department Station 34 / Lincoln City Fire Department Station 2 (F). Display/hide their locations on the map
Park in Lincoln: McBean Memorial Park (1). Display/hide its location on the map
Birthplace of: Fred Clark - Film actor, Fred Besana (baseball) - Baseball player.
Drinking water stations with addresses in Lincoln and their reported violations in the past:
LDS RECREATION BALL PARK (Population served: 25, Groundwater):Past monitoring violations:EVERYBODY S INN (Population served: 25, Groundwater):
- One routine major monitoring violation
Past monitoring violations:
- 10 routine major monitoring violations
| This city: | 2.6 people |
| California: | 2.9 people |
| This city: | 73.7% |
| Whole state: | 68.7% |
| This city: | 5.4% |
| Whole state: | 7.2% |
Likely homosexual households (counted as self-reported same-sex unmarried-partner households)
- Lesbian couples: 0.4% of all households
- Gay men: 0.3% of all households
People in group quarters in Lincoln in 2010:
- 85 people in nursing facilities/skilled-nursing facilities
- 18 people in other noninstitutional facilities
- 11 people in group homes intended for adults
Banks with branches in Lincoln (2011 data):
- Umpqua Bank: Twelve Bridges Branch, Lincoln Hills Branch, Lincoln Downtown Branch. Info updated 2011/09/02: Bank assets: $11,556.7 mil, Deposits: $9,325.3 mil, headquarters in Roseburg, OR, positive income, Commercial Lending Specialization, 193 total offices, Holding Company: Umpqua Holdings Corporation
- Wells Fargo Bank, National Association: Lincoln Hills Branch at 1520 Del Webb Boulvevard, Suite C-103, branch established on 2005/10/11; Lincoln Branch at 945 S State Highway 65, branch established on 2005/03/29. Info updated 2011/04/05: Bank assets: $1,161,490.0 mil, Deposits: $905,653.0 mil, headquarters in Sioux Falls, SD, positive income, 6395 total offices, Holding Company: Wells Fargo & Company
- U.S. Bank National Association: Lincoln Branch at 525 Mcbean Park Drive, branch established on 1926/01/01; South Highway 65 Safeway Branch at 405 South Highway 65, branch established on 2004/03/22. Info updated 2012/01/30: Bank assets: $330,470.8 mil, Deposits: $236,091.5 mil, headquarters in Cincinnati, OH, positive income, 3121 total offices, Holding Company: U.S. Bancorp
- Tri Counties Bank: Lincoln Branch at 765 S. Highway 65, branch established on 2005/01/24. Info updated 2011/09/26: Bank assets: $2,554.4 mil, Deposits: $2,191.2 mil, headquarters in Chico, CA, positive income, Commercial Lending Specialization, 71 total offices, Holding Company: Trico Bancshares
- Compass Bank: Lincoln Branch at 701 Sterling Parkway, branch established on 2006/06/19. Info updated 2011/02/24: Bank assets: $63,107.0 mil, Deposits: $46,232.4 mil, headquarters in Birmingham, AL, negative income in the last year, Commercial Lending Specialization, 720 total offices, Holding Company: Banco Bilbao Vizcaya Argentaria, S.A.
- Bank of America, National Association: Sterling Pointe Branch at 685 South Highway 65, branch established on 2005/08/29. Info updated 2009/11/18: Bank assets: $1,451,969.3 mil, Deposits: $1,077,176.8 mil, headquarters in Charlotte, NC, positive income, 5782 total offices, Holding Company: Bank Of America Corporation
- First Bank: Lincoln Crossing Branch at 109 Ferrari Ranch Road, branch established on 2007/03/12. Info updated 2007/12/04: Bank assets: $6,579.8 mil, Deposits: $5,800.6 mil, headquarters in Creve Coeur, MO, negative income in the last year, Commercial Lending Specialization, 148 total offices, Holding Company: First Banks, Inc.
- JPMorgan Chase Bank, National Association: Lincoln at 705 S Hwy 65, branch established on 2005/02/28. Info updated 2011/11/10: Bank assets: $1,811,678.0 mil, Deposits: $1,190,738.0 mil, headquarters in Columbus, OH, positive income, International Specialization, 5577 total offices, Holding Company: Jpmorgan Chase & Co.
For population 15 years and over in Lincoln:
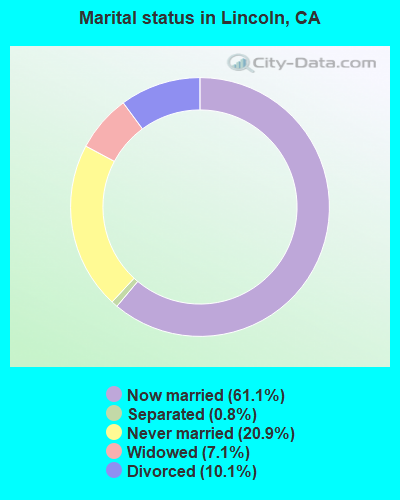
- Never married: 20.9%
- Now married: 61.1%
- Separated: 0.8%
- Widowed: 7.1%
- Divorced: 10.1%
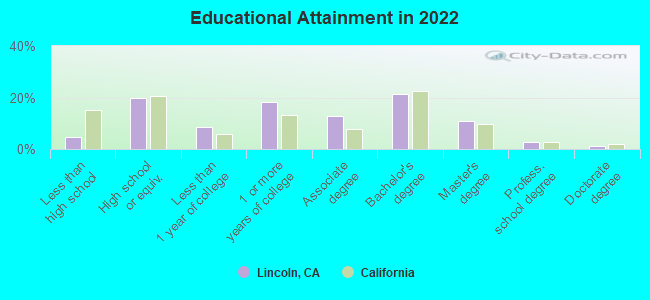
For population 25 years and over in Lincoln:
- High school or higher: 95.0%
- Bachelor's degree or higher: 37.1%
- Graduate or professional degree: 14.5%
- Unemployed: 3.6%
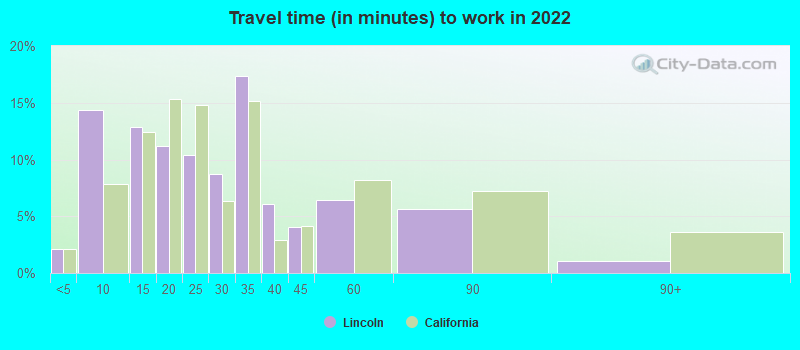
- Mean travel time to work (commute): 23.4 minutes
| Here: | 10.5 |
| California average: | 15.5 |
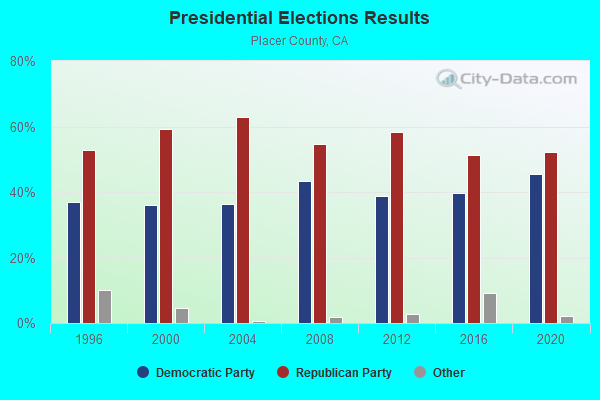
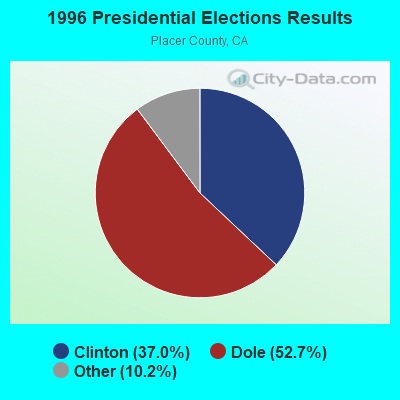
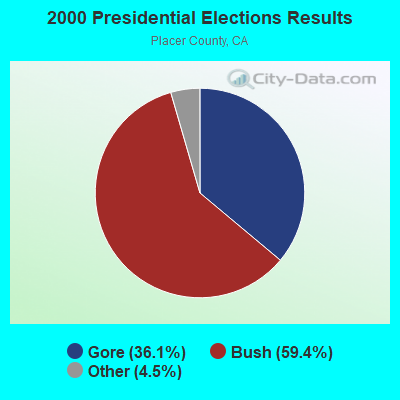
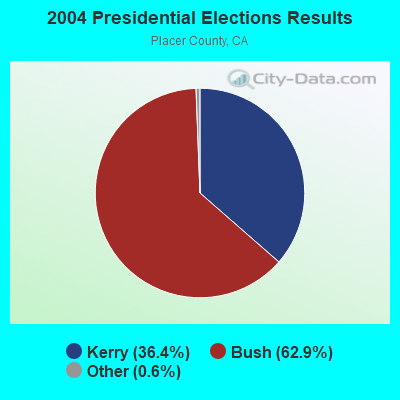
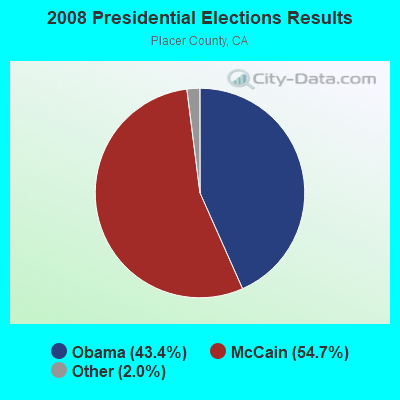
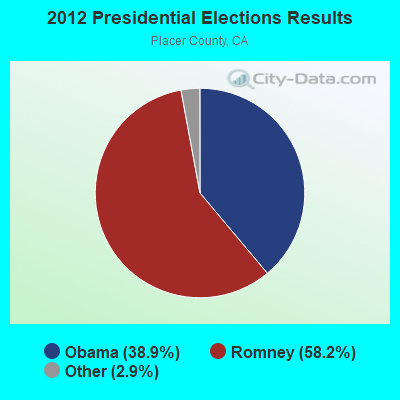
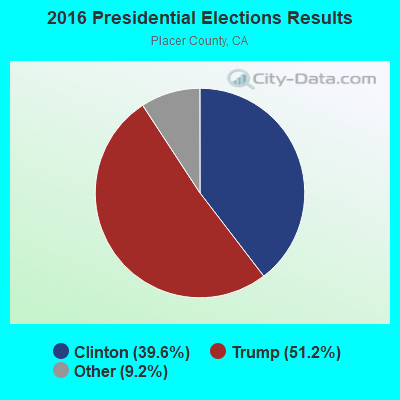
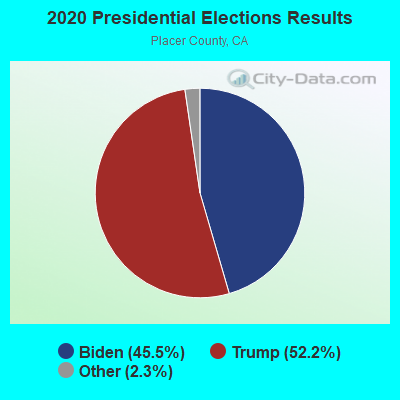
Graphs represent county-level data. Detailed 2008 Election Results
Religion statistics for Lincoln, CA (based on Placer County data)
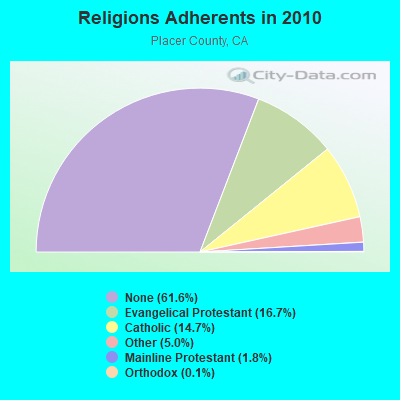
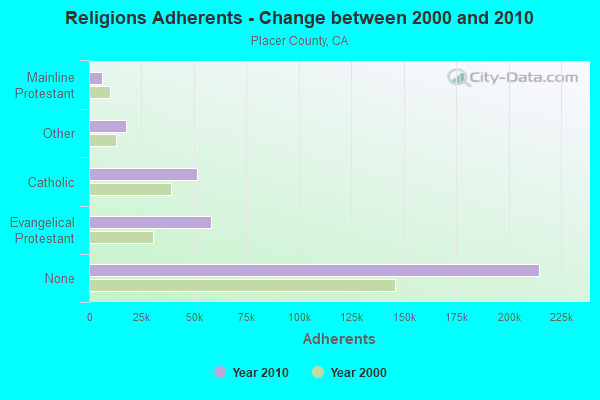
| Religion | Adherents | Congregations |
|---|---|---|
| Evangelical Protestant | 58,135 | 153 |
| Catholic | 51,342 | 12 |
| Other | 17,462 | 57 |
| Mainline Protestant | 6,376 | 30 |
| Orthodox | 400 | 1 |
| None | 214,717 | - |
Food Environment Statistics:
| This county: | 1.66 / 10,000 pop. |
| California: | 2.14 / 10,000 pop. |
| Placer County: | 0.06 / 10,000 pop. |
| California: | 0.04 / 10,000 pop. |
| Placer County: | 0.60 / 10,000 pop. |
| California: | 0.62 / 10,000 pop. |
| Placer County: | 2.23 / 10,000 pop. |
| State: | 1.49 / 10,000 pop. |
| Here: | 9.00 / 10,000 pop. |
| State: | 7.42 / 10,000 pop. |
| This county: | 6.7% |
| State: | 7.3% |
| Placer County: | 17.6% |
| California: | 21.3% |
| Here: | 14.5% |
| California: | 17.9% |
Health and Nutrition:
| This city: | 48.8% |
| California: | 49.4% |
| Here: | 47.3% |
| California: | 48.0% |
| Lincoln: | 28.6 |
| State: | 28.1 |
| This city: | 21.3% |
| California: | 20.2% |
| Lincoln: | 9.5% |
| California: | 11.2% |
| Lincoln: | 6.8 |
| California: | 6.8 |
| Lincoln: | 33.8% |
| California: | 31.5% |
| Lincoln: | 56.3% |
| California: | 56.4% |
| This city: | 79.6% |
| State: | 80.9% |
More about Health and Nutrition of Lincoln, CA Residents
| Local government employment and payroll (March 2022) | |||||
| Function | Full-time employees | Monthly full-time payroll | Average yearly full-time wage | Part-time employees | Monthly part-time payroll |
|---|---|---|---|---|---|
| Police Protection - Officers | 28 | $311,229 | $133,384 | 1 | $1,399 |
| Other Government Administration | 20 | $180,564 | $108,338 | 5 | $3,399 |
| Firefighters | 19 | $134,722 | $85,088 | 1 | $332 |
| Financial Administration | 15 | $98,383 | $78,706 | 1 | $1,450 |
| Solid Waste Management | 15 | $81,014 | $64,811 | 0 | $0 |
| Other and Unallocable | 11 | $86,018 | $93,838 | 0 | $0 |
| Water Supply | 10 | $62,461 | $74,953 | 0 | $0 |
| Parks and Recreation | 10 | $67,049 | $80,459 | 16 | $7,511 |
| Housing and Community Development (Local) | 10 | $79,832 | $95,798 | 7 | $700 |
| Streets and Highways | 9 | $55,585 | $74,113 | 0 | $0 |
| Police - Other | 8 | $46,963 | $70,445 | 1 | $2,969 |
| Sewerage | 7 | $49,376 | $84,645 | 0 | $0 |
| Local Libraries | 5 | $48,307 | $115,937 | 7 | $21,474 |
| Judicial and Legal | 1 | $8,359 | $100,308 | 0 | $0 |
| Airports | 1 | $7,442 | $89,304 | 1 | $1,880 |
| Totals for Government | 169 | $1,317,304 | $93,536 | 40 | $41,115 |
Lincoln government finances - Expenditure in 2017 (per resident):
- Construction - Regular Highways: $3,361,000 ($63.98)
Housing and Community Development: $902,000 ($17.17)
Parks and Recreation: $851,000 ($16.20)
Solid Waste Management: $467,000 ($8.89)
Protective Inspection and Regulation - Other: $356,000 ($6.78)
Sewerage: $168,000 ($3.20)
- Current Operations - Water Utilities: $12,353,000 ($235.14)
Sewerage: $8,438,000 ($160.62)
Parks and Recreation: $7,571,000 ($144.12)
Police Protection: $5,374,000 ($102.30)
Local Fire Protection: $4,591,000 ($87.39)
Regular Highways: $4,360,000 ($82.99)
Solid Waste Management: $4,284,000 ($81.55)
Air Transportation: $2,829,000 ($53.85)
General - Other: $2,774,000 ($52.80)
Protective Inspection and Regulation - Other: $2,620,000 ($49.87)
Transit Utilities: $2,475,000 ($47.11)
Central Staff Services: $2,313,000 ($44.03)
Housing and Community Development: $1,353,000 ($25.75)
Financial Administration: $972,000 ($18.50)
Libraries: $543,000 ($10.34)
- General - Interest on Debt: $1,495,000 ($28.46)
- Other Capital Outlay - General - Other: $790,000 ($15.04)
Sewerage: $173,000 ($3.29)
Water Utilities: $110,000 ($2.09)
Air Transportation: $55,000 ($1.05)
Police Protection: $19,000 ($0.36)
Regular Highways: $8,000 ($0.15)
- Total Salaries and Wages: $187,000 ($3.56)
Lincoln government finances - Revenue in 2017 (per resident):
- Charges - Other: $28,709,000 ($546.48)
Sewerage: $18,338,000 ($349.07)
Solid Waste Management: $6,879,000 ($130.94)
Air Transportation: $1,305,000 ($24.84)
Parks and Recreation: $990,000 ($18.84)
- Federal Intergovernmental - Other: $778,000 ($14.81)
Air Transportation: $461,000 ($8.78)
- Local Intergovernmental - Transit Utilities: $375,000 ($7.14)
Sewerage: $360,000 ($6.85)
- Miscellaneous - General Revenue - Other: $7,960,000 ($151.52)
Interest Earnings: $1,174,000 ($22.35)
Fines and Forfeits: $68,000 ($1.29)
- Revenue - Water Utilities: $17,358,000 ($330.41)
Transit Utilities: $4,000 ($0.08)
- State Intergovernmental - Transit Utilities: $1,130,000 ($21.51)
Highways: $914,000 ($17.40)
Other: $263,000 ($5.01)
Water Utilities: $172,000 ($3.27)
General Local Government Support: $46,000 ($0.88)
- Tax - Property: $10,211,000 ($194.37)
General Sales and Gross Receipts: $6,533,000 ($124.36)
Other License: $2,011,000 ($38.28)
Public Utilities Sales: $807,000 ($15.36)
Documentary and Stock Transfer: $399,000 ($7.60)
Other Selective Sales: $284,000 ($5.41)
Occupation and Business License - Other: $96,000 ($1.83)
Other: $66,000 ($1.26)
Lincoln government finances - Debt in 2017 (per resident):
- Long Term Debt - Beginning Outstanding - Unspecified Public Purpose: $29,604,000 ($563.52)
Retired Unspecified Public Purpose: $29,242,000 ($556.63)
Outstanding Unspecified Public Purpose: $27,931,000 ($531.67)
Issue, Unspecified Public Purpose: $27,569,000 ($524.78)
Lincoln government finances - Cash and Securities in 2017 (per resident):
- Bond Funds - Cash and Securities: $22,292,000 ($424.33)
- Other Funds - Cash and Securities: $140,837,000 ($2680.87)
- Sinking Funds - Cash and Securities: $2,992,000 ($56.95)
9.43% of this county's 2021 resident taxpayers lived in other counties in 2020 ($99,508 average adjusted gross income)
| Here: | 9.43% |
| California average: | 5.19% |
0.03% of residents moved from foreign countries ($239 average AGI)
Placer County: 0.03% California average: 0.03%
Top counties from which taxpayers relocated into this county between 2020 and 2021:
| from Sacramento County, CA | |
| from Santa Clara County, CA | |
| from Alameda County, CA |
8.04% of this county's 2020 resident taxpayers moved to other counties in 2021 ($95,121 average adjusted gross income)
| Here: | 8.04% |
| California average: | 6.14% |
0.03% of residents moved to foreign countries ($247 average AGI)
Placer County: 0.03% California average: 0.02%
Top counties to which taxpayers relocated from this county between 2020 and 2021:
| to Sacramento County, CA | |
| to Nevada County, CA | |
| to El Dorado County, CA |
| Businesses in Lincoln, CA | ||||
| Name | Count | Name | Count | |
|---|---|---|---|---|
| Ace Hardware | 1 | KFC | 1 | |
| AutoZone | 1 | Little Caesars Pizza | 1 | |
| Blockbuster | 1 | Lowe's | 1 | |
| Burger King | 1 | McDonald's | 2 | |
| CVS | 1 | Nike | 1 | |
| Carl\s Jr. | 1 | Panda Express | 2 | |
| Cold Stone Creamery | 1 | PetSmart | 1 | |
| Curves | 1 | Quiznos | 1 | |
| DHL | 1 | Red Robin | 1 | |
| Famous Footwear | 1 | Safeway | 1 | |
| FedEx | 1 | Staples | 1 | |
| Firestone Complete Auto Care | 1 | Starbucks | 5 | |
| GNC | 1 | Subway | 4 | |
| GameStop | 1 | T.J.Maxx | 1 | |
| H&R Block | 1 | Target | 1 | |
| Holiday Inn | 1 | U-Haul | 2 | |
| Home Depot | 1 | UPS | 4 | |
| Jack In The Box | 1 | Verizon Wireless | 2 | |
| Jamba Juice | 1 | Vons | 1 | |
Strongest AM radio stations in Lincoln:
- KFIA (710 AM; 25 kW; CARMICHAEL, CA; Owner: VISTA BROADCASTING INC.)
- KFBK (1530 AM; 50 kW; SACRAMENTO, CA; Owner: AMFM RADIO LICENSES, L.L.C.)
- KLIB (1110 AM; 10 kW; ROSEVILLE, CA; Owner: WAY BROADCASTING, INC.)
- KFSG (1690 AM; 10 kW; ROSEVILLE, CA; Owner: WAY BROADCASTING, INC.)
- KAHI (950 AM; 10 kW; AUBURN, CA; Owner: IHR EDUCATIONAL BROADCASTING)
- KSTE (650 AM; 25 kW; RANCHO CORDOVA, CA; Owner: AMFM RADIO LICENSES, L.L.C.)
- KHTK (1140 AM; 50 kW; SACRAMENTO, CA; Owner: INFINITY RADIO SUBSIDIARY OPERATIONS INC.)
- KSMH (1620 AM; 10 kW; WEST SACRAMENTO, CA; Owner: IHR EDUCATIONAL BROADCASTING)
- KCBC (770 AM; 50 kW; RIVERBANK, CA; Owner: KIERTRON, INC.)
- KCBS (740 AM; 50 kW; SAN FRANCISCO, CA; Owner: INFINITY BROADCASTING OPERATIONS, INC.)
- KNCO (830 AM; 5 kW; GRASS VALLEY, CA; Owner: NEVADA COUNTY BROADCASTERS, INC.)
- KCTC (1320 AM; 5 kW; SACRAMENTO, CA; Owner: ENTERCOM SACRAMENTO LICENSE, LLC)
- KMYC (1410 AM; 5 kW; MARYSVILLE, CA; Owner: THOMAS F. HUTH)
Strongest FM radio stations in Lincoln:
- KXCL (103.9 FM; YUBA CITY, CA; Owner: HARLAN COMMUNICATIONS, INC.)
- KRCX-FM (99.9 FM; MARYSVILLE, CA; Owner: ENTRAVISION HOLDINGS, LLC)
- KMJE (101.5 FM; GRIDLEY, CA; Owner: RESULTS RADIO LICENSEE, LLC)
- K213BZ (90.5 FM; RICHVALE, CA; Owner: FAMILY STATIONS, INC.)
- KHYL (101.1 FM; AUBURN, CA; Owner: AMFM RADIO LICENSES, L.L.C.)
- KKCY (103.1 FM; COLUSA, CA; Owner: RESULTS RADIO LICENSEE, LLC)
- KXPR (90.9 FM; SACRAMENTO, CA; Owner: CALIFORNIA STATE UNIVERSITY)
- KXOA (93.7 FM; ROSEVILLE, CA; Owner: INFINITY RADIO SUBSIDIARY OPERATIONS INC.)
- KVMR (89.5 FM; NEVADA CITY, CA; Owner: NEVADA CITY COMMUNITY BROADCAST GRUP)
- KLVS (99.3 FM; GRASS VALLEY, CA; Owner: EDUCATIONAL MEDIA FOUNDATION)
- KGBY (92.5 FM; SACRAMENTO, CA; Owner: AMFM RADIO LICENSES, L.L.C.)
- KEDR (88.1 FM; SACRAMENTO, CA; Owner: FAMILY STATIONS, INC.)
- KNCO-FM (94.1 FM; GRASS VALLEY, CA; Owner: NEVADA COUNTY BROADCASTERS, INC.)
- KDND (107.9 FM; SACRAMENTO, CA; Owner: ENTERCOM SACRAMENTO LICENSE, LLC)
- KKSF-FM1 (103.7 FM; PLEASANTON, ETC., CA; Owner: AMFM RADIO LICENSES, L.L.C.)
- KWYL (102.9 FM; SOUTH LAKE TAHOE, CA; Owner: CITADEL BROADCASTING COMPANY)
- KNDL (89.9 FM; ANGWIN, CA; Owner: HOWELL MOUNTAIN BROADCASTING COMPANY)
- KLVR (91.9 FM; SANTA ROSA, CA; Owner: EDUCATIONAL MEDIA FOUNDATION)
- KSEG (96.9 FM; SACRAMENTO, CA; Owner: ENTERCOM SACRAMENTO LICENSE, LLC)
- KUIC (95.3 FM; VACAVILLE, CA; Owner: KUIC, INC.)
TV broadcast stations around Lincoln:
- K27FX (Channel 27; EUREKA, CA; Owner: MS COMMUNICATIONS, LLC)
- KMMK-LP (Channel 14; SACRAMENTO, CA; Owner: CABALLERO TELEVISION TEXAS, L.L.C.)
- KEZT-CA (Channel 23; SACRAMENTO, CA; Owner: TELEFUTURA SACRAMENTO LLC)
- KSPX (Channel 29; SACRAMENTO, CA; Owner: PAXSON SACRAMENTO LICENSE, INC.)
- KTXL (Channel 40; SACRAMENTO, CA; Owner: CHANNEL 40, INC.)
- K27EU (Channel 27; SACRAMENTO, CA; Owner: ABUNDANT LIFE BROADCASTING, INC.)
- K17EH (Channel 17; EUREKA, CA; Owner: MS COMMUNICATIONS, LLC)
- KQCA (Channel 58; STOCKTON, CA; Owner: KCRA HEARST-ARGYLE TELEVISION, INC.)
- KCRA-TV (Channel 3; SACRAMENTO, CA; Owner: KCRA HEARST-ARGYLE TELEVISION, INC.)
- KOVR (Channel 13; STOCKTON, CA; Owner: SCI - SACRAMENTO LICENSEE, LLC)
- KXTV (Channel 10; SACRAMENTO, CA; Owner: KXTV, INC.)
- KVIE (Channel 6; SACRAMENTO, CA; Owner: KVIE, INC.)
- KUVS (Channel 19; MODESTO, CA; Owner: KUVS LICENSE PARTNERSHIP, G.P.)
- KMAX-TV (Channel 31; SACRAMENTO, CA; Owner: UPN STATIONS GROUP INC.)
- KSAO-LP (Channel 49; SACRAMENTO, CA; Owner: GARY M. COCOLA FAMILY TRUST, GARY M. COCOLA TRUSTEE)
- KBTV-LP (Channel 8; SACRAMENTO, CA; Owner: INCISOR COMMUNICATIONS, L.L.C.)
- K22FR (Channel 22; SACRAMENTO, CA; Owner: NATIONAL MINORITY T.V., INC.)
- KMUM-CA (Channel 15; SACRAMENTO, CA; Owner: CABALLERO TELEVISION TEXAS, L.L.C.)
- K69FB (Channel 69; SACRAMENTO, CA; Owner: TRINITY BROADCASTING NETWORK)
- KCSO-LP (Channel 33; SACRAMENTO, CA; Owner: SAINTE 51, L.P.)
- KRJR-LP (Channel 47; SACRAMENTO, CA; Owner: WORD OF GOD FELLOWSHIP, INC.)
- KGTN-LP (Channel 62; PLACERVILLE, CA; Owner: PRAISE THE LORD STUDIO CHAPEL)
- National Bridge Inventory (NBI) Statistics
- 52Number of bridges
- 709ft / 216mTotal length
- 623,615Total average daily traffic
- 47,501Total average daily truck traffic
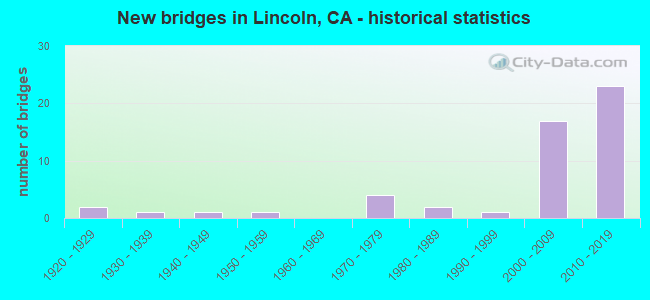
- New bridges - historical statistics
- 21920-1929
- 11930-1939
- 11940-1949
- 11950-1959
- 41970-1979
- 21980-1989
- 11990-1999
- 172000-2009
- 232010-2019
FCC Registered Antenna Towers: 116 (See the full list of FCC Registered Antenna Towers)
FCC Registered Broadcast Land Mobile Towers: 21 (See the full list of FCC Registered Broadcast Land Mobile Towers in Lincoln, CA)
FCC Registered Microwave Towers: 14 (See the full list of FCC Registered Microwave Towers in this town)
FCC Registered Maritime Coast & Aviation Ground Towers: 3 (See the full list of FCC Registered Maritime Coast & Aviation Ground Towers)
FCC Registered Amateur Radio Licenses: 383 (See the full list of FCC Registered Amateur Radio Licenses in Lincoln)
FAA Registered Aircraft: 82 (See the full list of FAA Registered Aircraft in Lincoln)
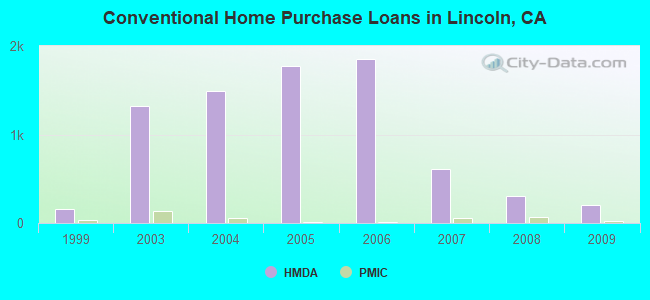
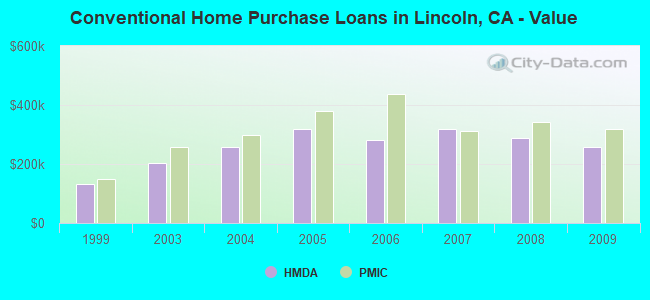
| Home Mortgage Disclosure Act Aggregated Statistics For Year 2009 (Based on 3 partial tracts) | ||||||||||||
| A) FHA, FSA/RHS & VA Home Purchase Loans | B) Conventional Home Purchase Loans | C) Refinancings | D) Home Improvement Loans | F) Non-occupant Loans on < 5 Family Dwellings (A B C & D) | G) Loans On Manufactured Home Dwelling (A B C & D) | |||||||
|---|---|---|---|---|---|---|---|---|---|---|---|---|
| Number | Average Value | Number | Average Value | Number | Average Value | Number | Average Value | Number | Average Value | Number | Average Value | |
| LOANS ORIGINATED | 177 | $284,893 | 202 | $259,193 | 723 | $244,655 | 26 | $126,485 | 77 | $201,295 | 1 | $230,180 |
| APPLICATIONS APPROVED, NOT ACCEPTED | 16 | $279,376 | 20 | $264,490 | 62 | $277,707 | 3 | $182,937 | 6 | $187,967 | 0 | $0 |
| APPLICATIONS DENIED | 39 | $240,341 | 29 | $279,939 | 207 | $277,067 | 14 | $114,668 | 19 | $220,246 | 1 | $227,020 |
| APPLICATIONS WITHDRAWN | 28 | $256,534 | 33 | $273,234 | 160 | $270,174 | 7 | $146,191 | 18 | $209,393 | 0 | $0 |
| FILES CLOSED FOR INCOMPLETENESS | 7 | $232,000 | 4 | $248,132 | 27 | $276,177 | 2 | $156,065 | 3 | $215,973 | 1 | $149,310 |
Detailed HMDA statistics for the following Tracts: 0213.03 , 0214.01, 0214.02
| Private Mortgage Insurance Companies Aggregated Statistics For Year 2009 (Based on 3 partial tracts) | ||||||
| A) Conventional Home Purchase Loans | B) Refinancings | C) Non-occupant Loans on < 5 Family Dwellings (A & B) | ||||
|---|---|---|---|---|---|---|
| Number | Average Value | Number | Average Value | Number | Average Value | |
| LOANS ORIGINATED | 22 | $317,438 | 6 | $310,868 | 1 | $130,540 |
| APPLICATIONS APPROVED, NOT ACCEPTED | 10 | $360,927 | 3 | $314,087 | 0 | $0 |
| APPLICATIONS DENIED | 4 | $425,178 | 3 | $326,783 | 0 | $0 |
| APPLICATIONS WITHDRAWN | 1 | $181,610 | 0 | $0 | 0 | $0 |
| FILES CLOSED FOR INCOMPLETENESS | 3 | $418,600 | 0 | $0 | 0 | $0 |
Detailed PMIC statistics for the following Tracts: 0213.03 , 0214.01, 0214.02
2005 - 2018 National Fire Incident Reporting System (NFIRS) incidents
- Fire incident types reported to NFIRS in Lincoln, CA
- 39259.6%Outside Fires
- 17025.8%Structure Fires
- 619.3%Mobile Property/Vehicle Fires
- 355.3%Other
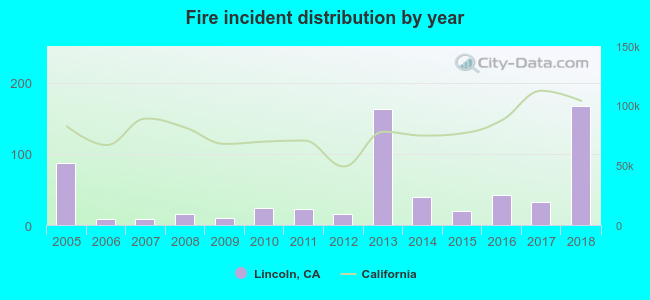 According to the data from the years 2005 - 2018 the average number of fires per year is 47. The highest number of reported fire incidents - 168 took place in 2018, and the least - 9 in 2006. The data has a rising trend.
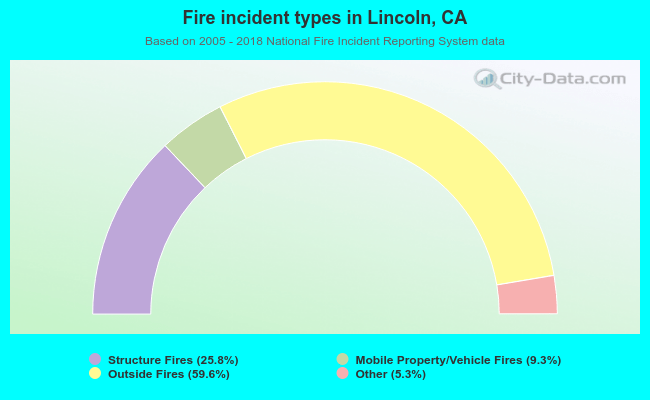 When looking into fire subcategories, the most reports belonged to: Outside Fires (59.6%), and Structure Fires (25.8%).
| Most common first names in Lincoln, CA among deceased individuals | ||
| Name | Count | Lived (average) |
|---|---|---|
| Robert | 94 | 73.2 years |
| James | 85 | 75.3 years |
| Mary | 78 | 81.5 years |
| John | 72 | 76.4 years |
| William | 68 | 74.0 years |
| Richard | 40 | 71.0 years |
| Charles | 40 | 78.5 years |
| George | 38 | 75.5 years |
| Helen | 37 | 82.5 years |
| Frank | 34 | 75.2 years |
| Most common last names in Lincoln, CA among deceased individuals | ||
| Last name | Count | Lived (average) |
|---|---|---|
| Smith | 36 | 77.3 years |
| Johnson | 23 | 78.6 years |
| Brown | 20 | 77.1 years |
| Wilson | 19 | 77.6 years |
| Miller | 17 | 78.1 years |
| Garcia | 14 | 72.1 years |
| Williams | 13 | 84.2 years |
| Anderson | 12 | 82.7 years |
| Mitchell | 12 | 73.7 years |
| Jones | 12 | 72.6 years |
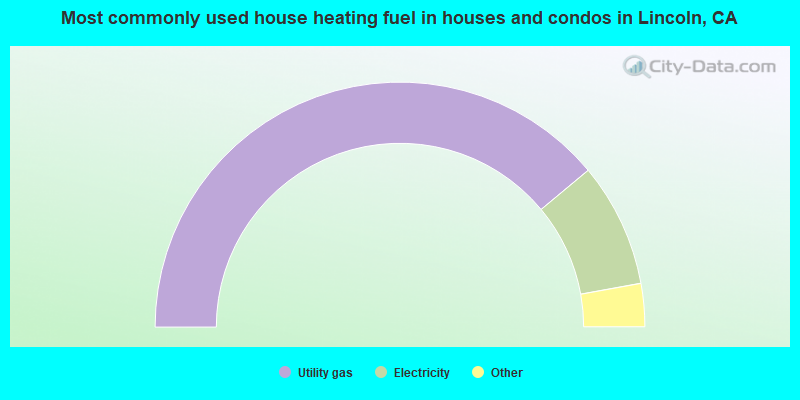
- 78.0%Utility gas
- 16.4%Electricity
- 3.9%Solar energy
- 1.4%Bottled, tank, or LP gas
- 0.3%Wood
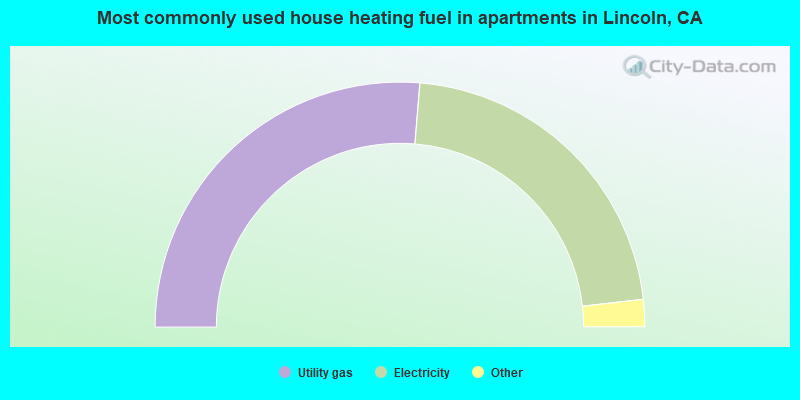
- 52.6%Utility gas
- 43.8%Electricity
- 1.4%Solar energy
- 1.1%No fuel used
- 1.0%Bottled, tank, or LP gas
- 0.2%Wood
Lincoln compared to California state average:
- Unemployed percentage significantly below state average.
- Hispanic race population percentage above state average.
- Median age significantly above state average.
- Foreign-born population percentage above state average.
- Renting percentage below state average.
- Length of stay since moving in significantly above state average.
- Number of rooms per house above state average.
- House age significantly below state average.
- Number of college students above state average.
Lincoln on our top lists:
- #5 on the list of "Top 101 cities with the largest percentage population increase from 2000 (population 5,000+)"
- #9 on the list of "Top 101 cities with the largest city-data.com crime index per police officer (population 5,000+)"
- #16 on the list of "Top 101 cities with the lowest number of police officers per 1000 residents (population 5,000+)"
- #71 on the list of "Top 100 fastest growing cities from 2000 to 2014 (pop. 5,000+)"
- #11 on the list of "Top 101 counties with the highest lead air pollution readings in 2012 (µg/m3)"
- #19 on the list of "Top 101 counties with the lowest lead air pollution readings in 2012 (µg/m3)"
- #31 on the list of "Top 101 counties with the highest Nitrogen Dioxide air pollution readings in 2012 (ppm)"
- #32 on the list of "Top 101 counties with the lowest Particulate Matter (PM2.5) Annual air pollution readings in 2012 (µg/m3)"
- #48 on the list of "Top 101 counties with the lowest Particulate Matter (PM10) Annual air pollution readings in 2012 (µg/m3)"

|
|
Total of 210 patent applications in 2008-2024.