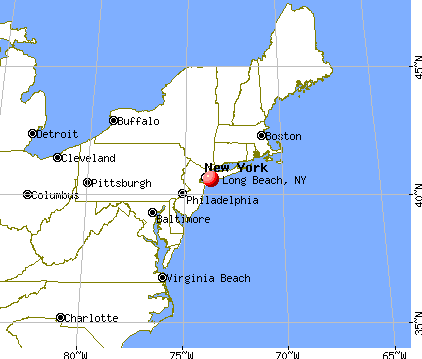
Long Beach, New York
Long Beach: light on monroe beach!

Long Beach: Sunrise on the Beach

Long Beach: the best city in the world
Long Beach: grand ave

Long Beach: November sunset
Long Beach: long beach from the the bay

Long Beach: Sunrise on the Beach

Long Beach: ahead

Long Beach: HDR image of the L.B. bridge -jan08-
Long Beach: beach and boardwalk
Long Beach: Father and son winter walk on Long Beach New York
- see
23
more - add
your
Submit your own pictures of this city and show them to the world
- OSM Map
- General Map
- Google Map
- MSN Map
Population change since 2000: -2.4%
 |
| Males: 17,747 | |
| Females: 16,857 |
| Median resident age: | 45.4 years |
| New York median age: | 40.0 years |
Zip codes: 11561.
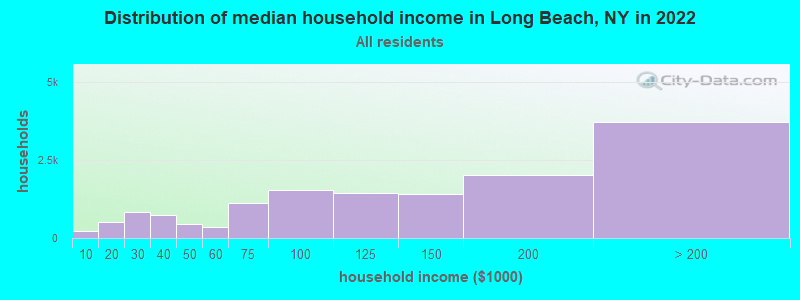
| Long Beach: | $125,311 |
| NY: | $79,557 |
Estimated per capita income in 2022: $63,589 (it was $31,069 in 2000)
Long Beach city income, earnings, and wages data
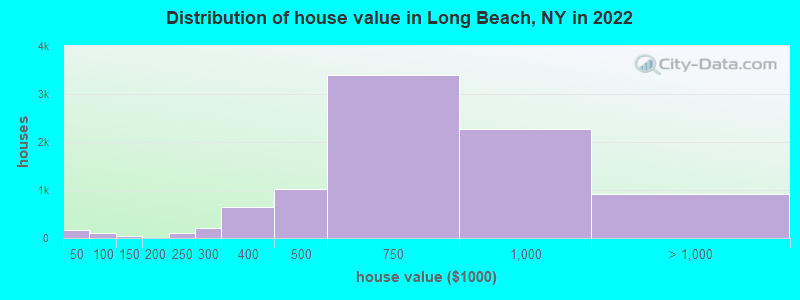
Estimated median house or condo value in 2022: $652,018 (it was $214,000 in 2000)
| Long Beach: | $652,018 |
| NY: | $400,400 |
Mean prices in 2022: all housing units: $682,994; detached houses: $802,309; townhouses or other attached units: $659,830; in 2-unit structures: $619,877; in 3-to-4-unit structures: $515,077; in 5-or-more-unit structures: $424,401
Median gross rent in 2022: $2,138.
(4.6% for White Non-Hispanic residents, 7.5% for Black residents, 9.0% for Hispanic or Latino residents, 22.1% for other race residents, 3.8% for two or more races residents)
Detailed information about poverty and poor residents in Long Beach, NY


Compare current foreclosures in Long Beach, NY:
| Photo | Address | Area | Beds / Baths | Price | Details |
|---|---|---|---|---|---|

|
#1
E Hudson St
Long Beach, NY 11561
|
936 sq. feet
|
2 baths 3 beds |
show details | |

|
#2
Wilson Ave
Long Beach, NY 11561
|
1,311 sq. feet
|
1 baths 1 beds |
show details | |

|
#3
Kirkwood St
Long Beach, NY 11561
|
1,926 sq. feet
|
2 baths 3 beds |
show details | |

|
#4
E Hudson St
Long Beach, NY 11561
|
1,870 sq. feet
|
2 baths - beds |
show details | |

|
#5
California St
Long Beach, NY 11561
|
1,404 sq. feet
|
2 baths - beds |
show details | |

|
#6
W Olive St
Long Beach, NY 11561
|
1,358 sq. feet
|
3 baths - beds |
show details | |

|
#7
E Olive St
Long Beach, NY 11561
|
2,546 sq. feet
|
3 baths - beds |
show details | |

|
#8
E Hudson St
Long Beach, NY 11561
|
2,088 sq. feet
|
2 baths - beds |
show details | |

|
#9
New Hampshire St
Long Beach, NY 11561
|
804 sq. feet
|
1 baths - beds |
show details | |

|
#10
Atlantic Ave
Long Beach, NY 11561
|
1,551 sq. feet
|
4 baths - beds |
show details |
| Photo | Address | Area | Beds / Baths | Price | Details |
|---|---|---|---|---|---|

|
#11
E Beech St
Long Beach, NY 11561
|
2,541 sq. feet
|
4 baths - beds |
show details | |

|
#12
W Hudson St
Long Beach, NY 11561
|
2,352 sq. feet
|
3 baths - beds |
show details | |

|
#13
W Olive St # 2
Long Beach, NY 11561
|
3,018 sq. feet
|
4 baths - beds |
show details | |

|
#14
E Beech St
Long Beach, NY 11561
|
1,314 sq. feet
|
2 baths - beds |
show details | |

|
#15
E Hudson St
Long Beach, NY 11561
|
1,392 sq. feet
|
3 baths - beds |
show details | |

|
#16
Lido Blvd Apt 79a
Long Beach, NY 11561
|
1,040 sq. feet
|
1 baths - beds |
show details | |

|
#17
W Penn St
Long Beach, NY 11561
|
2,007 sq. feet
|
2 baths - beds |
show details | |

|
#18
E Beech St
Long Beach, NY 11561
|
4,514 sq. feet
|
2 baths - beds |
show details | |

|
#19
Belmont Ave
Long Beach, NY 11561
|
1,698 sq. feet
|
1 baths - beds |
show details | |

|
#20
Broadway
Long Beach, NY 11561
|
895 sq. feet
|
2 baths - beds |
show details |
| Photo | Address | Area | Beds / Baths | Price | Details |
|---|---|---|---|---|---|

|
#21
E Fulton St
Long Beach, NY 11561
|
2,061 sq. feet
|
4 baths - beds |
show details | |

|
#22
Michigan St
Long Beach, NY 11561
|
930 sq. feet
|
1 baths - beds |
show details | |

|
#23
E Market St
Long Beach, NY 11561
|
1,872 sq. feet
|
2 baths - beds |
show details | |

|
#24
Shore 14
Long Beach, NY 11561
|
958 sq. feet
|
2 baths - beds |
show details | |

|
#25
E Park Ave
Long Beach, NY 11561
|
1,894 sq. feet
|
3 baths - beds |
show details | |

|
#26
Minnesota Ave
Long Beach, NY 11561
|
1,012 sq. feet
|
2 baths - beds |
show details | |

|
#27
E Market St
Long Beach, NY 11561
|
3,792 sq. feet
|
5 baths - beds |
show details | |

|
#28
E Fulton St
Long Beach, NY 11561
|
1,162 sq. feet
|
1 baths - beds |
show details | |

|
#29
E Pine St
Long Beach, NY 11561
|
1,272 sq. feet
|
1 baths - beds |
show details | |

|
#30
W Penn St
Long Beach, NY 11561
|
1,641 sq. feet
|
1 baths - beds |
show details |
| Photo | Address | Area | Beds / Baths | Price | Details |
|---|---|---|---|---|---|

|
#31
Wyoming Ave
Long Beach, NY 11561
|
1,034 sq. feet
|
2 baths - beds |
show details | |

|
#32
Belmont Ave
Long Beach, NY 11561
|
1,686 sq. feet
|
2 baths - beds |
show details | |

|
#33
Connecticut Ave
Long Beach, NY 11561
|
1,804 sq. feet
|
1 baths - beds |
show details | |

|
#34
W Bay Dr
Long Beach, NY 11561
|
2,753 sq. feet
|
3 baths - beds |
show details | |

|
#35
Vinton St
Long Beach, NY 11561
|
1,757 sq. feet
|
2 baths - beds |
show details | |

|
#36
Franklin Blvd
Long Beach, NY 11561
|
2,327 sq. feet
|
3 baths - beds |
show details | |

|
#37
Shore 799
Long Beach, NY 11561
|
958 sq. feet
|
2 baths - beds |
show details | |

|
#38
New York Ave
Long Beach, NY 11561
|
1,812 sq. feet
|
2 baths - beds |
show details | |

|
#39
Doyle St
Long Beach, NY 11561
|
1,917 sq. feet
|
1 baths - beds |
show details | |

|
#40
Pennsylvania Ave
Long Beach, NY 11561
|
576 sq. feet
|
1 baths - beds |
show details |
| Photo | Address | Area | Beds / Baths | Price | Details |
|---|---|---|---|---|---|

|
#41
Laurelton Blvd
Long Beach, NY 11561
|
3,821 sq. feet
|
2 baths - beds |
show details | |

|
#42
E Park Ave
Long Beach, NY 11561
|
1,977 sq. feet
|
3 baths - beds |
show details | |

|
#43
W Park Ave
Long Beach, NY 11561
|
2,032 sq. feet
|
2 baths - beds |
show details | |

|
#44
New York Ave
Long Beach, NY 11561
|
924 sq. feet
|
1 baths - beds |
show details | |

|
#45
E Hudson St
Long Beach, NY 11561
|
2,059 sq. feet
|
4 baths - beds |
show details | |

|
#46
Washington Blvd
Long Beach, NY 11561
|
2,588 sq. feet
|
3 baths - beds |
show details | |

|
#47
Wilson Ave
Long Beach, NY 11561
|
1,311 sq. feet
|
3 baths - beds |
show details | |

|
#48
Troy Ave
Long Beach, NY 11561
|
2,120 sq. feet
|
4 baths - beds |
show details | |

|
#49
Farrell St
Long Beach, NY 11561
|
924 sq. feet
|
2 baths - beds |
show details | |

|
Check over 1 million property listings on Foreclosure.com!
|
browse all offers | |||


- 24,34070.4%White alone
- 5,06414.6%Hispanic
- 1,7275.0%Asian alone
- 1,7114.9%Black alone
- 9002.6%Two or more races
- 2370.7%Other race alone
- 330.10%American Indian alone
- 30.01%Native Hawaiian and Other
Pacific Islander alone
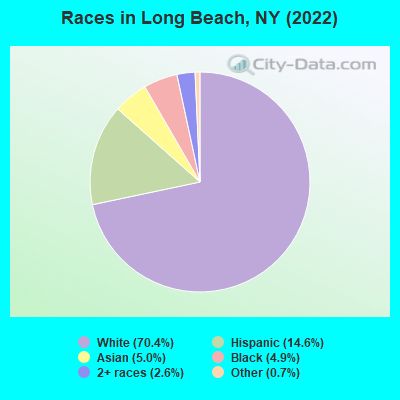
Races in Long Beach detailed stats: ancestries, foreign born residents, place of birth
According to our research of New York and other state lists, there were 6 registered sex offenders living in Long Beach, New York as of May 26, 2024.
The ratio of all residents to sex offenders in Long Beach is 5,631 to 1.
The ratio of registered sex offenders to all residents in this city is much lower than the state average.
Type |
2009 |
2010 |
2011 |
2012 |
2013 |
2014 |
2015 |
2016 |
2017 |
2018 |
2019 |
2020 |
2022 |
|---|---|---|---|---|---|---|---|---|---|---|---|---|---|
| Murders (per 100,000) | 0 (0.0) | 0 (0.0) | 0 (0.0) | 0 (0.0) | 0 (0.0) | 1 (3.0) | 0 (0.0) | 0 (0.0) | 0 (0.0) | 0 (0.0) | 0 (0.0) | 0 (0.0) | 0 (0.0) |
| Rapes (per 100,000) | 2 (5.6) | 0 (0.0) | 0 (0.0) | 0 (0.0) | 1 (3.0) | 0 (0.0) | 0 (0.0) | 0 (0.0) | 0 (0.0) | 0 (0.0) | 0 (0.0) | 0 (0.0) | 1 (2.9) |
| Robberies (per 100,000) | 6 (16.8) | 12 (36.1) | 11 (32.9) | 14 (41.7) | 13 (38.8) | 15 (44.6) | 11 (32.6) | 3 (8.9) | 9 (26.7) | 6 (17.8) | 2 (6.0) | 6 (17.9) | 8 (23.1) |
| Assaults (per 100,000) | 18 (50.4) | 28 (84.1) | 29 (86.8) | 31 (92.3) | 21 (62.6) | 27 (80.3) | 33 (97.8) | 20 (59.5) | 12 (35.5) | 23 (68.0) | 17 (50.7) | 7 (20.9) | 22 (63.5) |
| Burglaries (per 100,000) | 21 (58.8) | 33 (99.2) | 25 (74.8) | 66 (196.6) | 42 (125.2) | 35 (104.1) | 49 (145.2) | 22 (65.5) | 11 (32.6) | 5 (14.8) | 5 (14.9) | 4 (12.0) | 11 (31.7) |
| Thefts (per 100,000) | 207 (579.5) | 216 (649.1) | 237 (709.1) | 236 (702.9) | 277 (826.0) | 252 (749.7) | 252 (746.6) | 246 (732.3) | 180 (533.0) | 71 (210.1) | 53 (158.0) | 39 (116.6) | 32 (92.3) |
| Auto thefts (per 100,000) | 4 (11.2) | 12 (36.1) | 13 (38.9) | 13 (38.7) | 18 (53.7) | 9 (26.8) | 14 (41.5) | 14 (41.7) | 8 (23.7) | 4 (11.8) | 8 (23.8) | 3 (9.0) | 7 (20.2) |
| Arson (per 100,000) | 0 (0.0) | 0 (0.0) | 0 (0.0) | 0 (0.0) | 2 (6.0) | 1 (3.0) | 0 (0.0) | 1 (3.0) | 0 (0.0) | 0 (0.0) | 1 (3.0) | 0 (0.0) | 0 (0.0) |
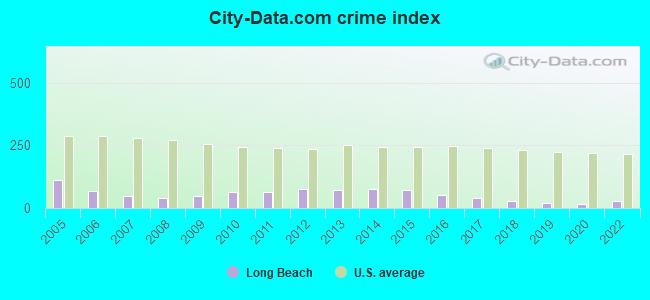
| City-Data.com crime index | 47.8 | 63.4 | 63.9 | 75.9 | 72.6 | 74.8 | 72.7 | 51.8 | 40.6 | 29.3 | 21.2 | 15.8 | 29.5 |
The City-Data.com crime index weighs serious crimes and violent crimes more heavily. Higher means more crime, U.S. average is 246.1. It adjusts for the number of visitors and daily workers commuting into cities.
Crime rate in Long Beach detailed stats: murders, rapes, robberies, assaults, burglaries, thefts, arson
Full-time law enforcement employees in 2021, including police officers: 84 (68 officers - 58 male; 10 female).
| Officers per 1,000 residents here: | 2.04 |
| New York average: | 3.28 |
 Recent articles from our blog. Our writers, many of them Ph.D. graduates or candidates, create easy-to-read articles on a wide variety of topics.

 | What has happened to Long Beach ?? (11 replies) |
| Long Beach changes? (2 replies) |
| Is Long Beach really nice and worth the trip? (20 replies) |
| Long Beach and Lindenhurst are Long Island Winners of First Round of NY Forward Program (7 replies) |
| Anyone live in Long Beach here? (2 replies) |
| Interested in buying in Long Beach (flood insurance, commutability, etc.) (15 replies) |
Latest news from Long Beach, NY collected exclusively by city-data.com from local newspapers, TV, and radio stations
Long Beach, NY City Guides:
Ancestries: Irish (16.8%), Italian (14.4%), American (4.8%), Polish (3.0%), European (2.8%), Russian (2.6%).
Current Local Time: EST time zone
Incorporated in 1913
Land area: 2.14 square miles.
Population density: 16,193 people per square mile (very high).
5,310 residents are foreign born (7.6% Latin America, 3.9% Asia, 3.6% Europe).
| This city: | 15.3% |
| New York: | 22.6% |
Median real estate property taxes paid for housing units with mortgages in 2022: $10,001 (1.5%)
Median real estate property taxes paid for housing units with no mortgage in 2022: $10,001 (1.6%)
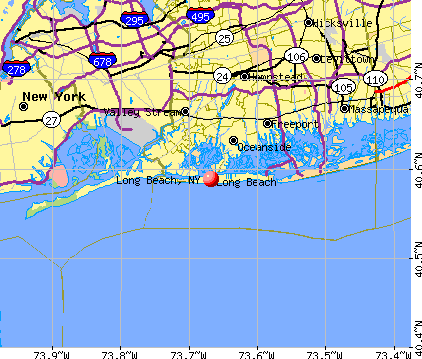
Nearest city with pop. 50,000+: Hempstead, NY  (8.5 miles , pop. 56,554).
Nearest city with pop. 200,000+: Queens, NY (11.8 miles , pop. 2,229,379).
Nearest cities:
), ), ), ), )Latitude: 40.59 N, Longitude: 73.67 W
Daytime population change due to commuting: -10,092 (-29.2%)
Workers who live and work in this city: 6,048 (30.6%)

Long Beach, New York accommodation & food services, waste management - Economy and Business Data
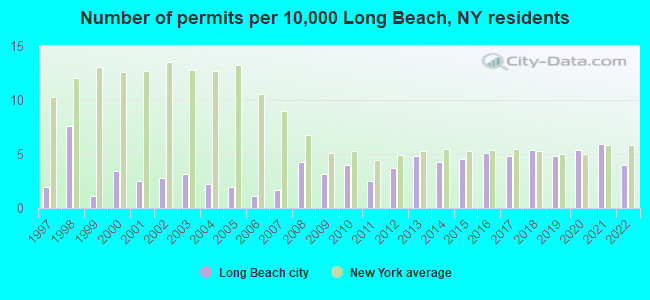
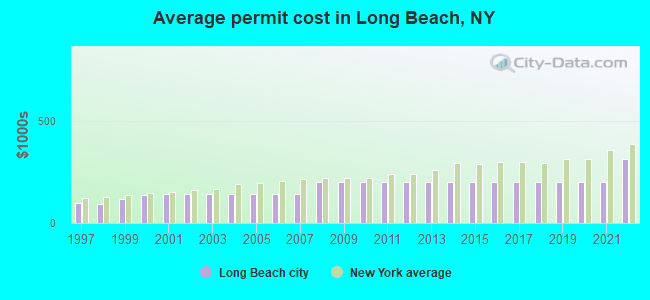
Single-family new house construction building permits:
- 2022: 14 buildings, average cost: $314,300
- 2021: 21 buildings, average cost: $200,000
- 2020: 19 buildings, average cost: $200,000
- 2019: 17 buildings, average cost: $200,000
- 2018: 19 buildings, average cost: $200,000
- 2017: 17 buildings, average cost: $200,000
- 2016: 18 buildings, average cost: $200,000
- 2015: 16 buildings, average cost: $200,000
- 2014: 15 buildings, average cost: $200,000
- 2013: 17 buildings, average cost: $200,000
- 2012: 13 buildings, average cost: $200,000
- 2011: 9 buildings, average cost: $200,000
- 2010: 14 buildings, average cost: $200,000
- 2009: 11 buildings, average cost: $200,000
- 2008: 15 buildings, average cost: $200,000
- 2007: 6 buildings, average cost: $142,500
- 2006: 4 buildings, average cost: $142,500
- 2005: 7 buildings, average cost: $142,500
- 2004: 8 buildings, average cost: $142,500
- 2003: 11 buildings, average cost: $142,600
- 2002: 10 buildings, average cost: $142,300
- 2001: 9 buildings, average cost: $143,700
- 2000: 12 buildings, average cost: $139,200
- 1999: 4 buildings, average cost: $115,000
- 1998: 27 buildings, average cost: $94,000
- 1997: 7 buildings, average cost: $96,700
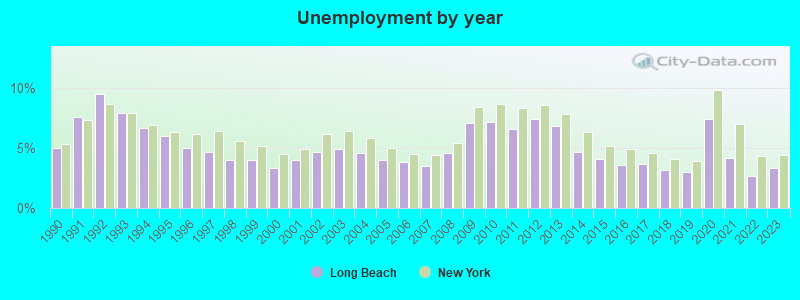
| Here: | 3.3% |
| New York: | 4.4% |
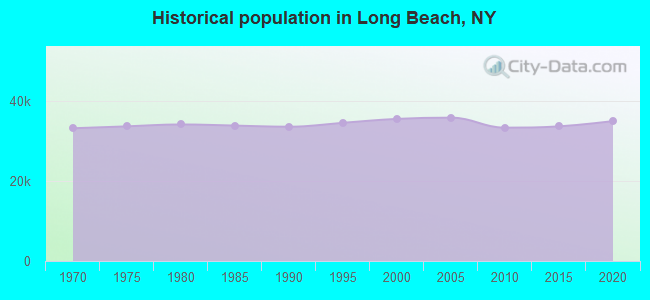
Population change in the 1990s: +1,985 (+5.9%).
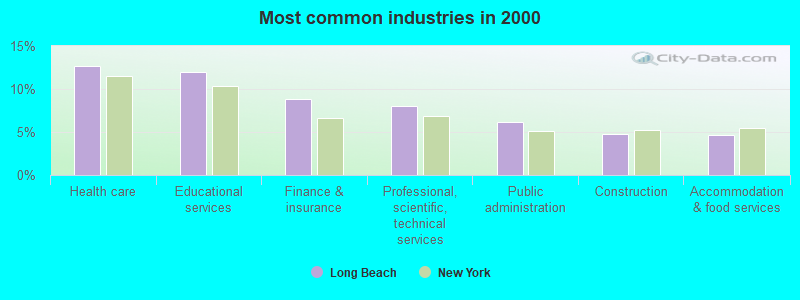
- Health care (12.7%)
- Educational services (12.0%)
- Finance & insurance (8.9%)
- Professional, scientific, technical services (8.0%)
- Public administration (6.2%)
- Construction (4.8%)
- Accommodation & food services (4.6%)
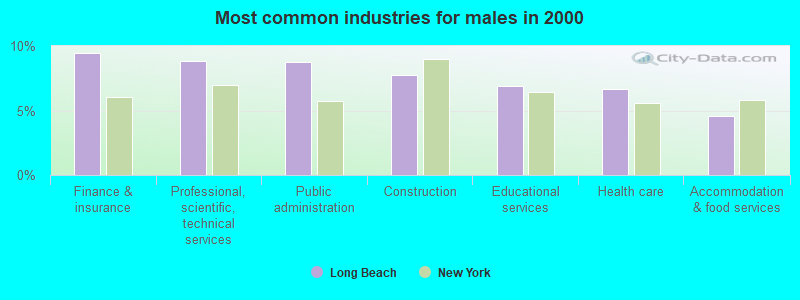
- Finance & insurance (9.4%)
- Professional, scientific, technical services (8.8%)
- Public administration (8.8%)
- Construction (7.7%)
- Educational services (6.9%)
- Health care (6.7%)
- Accommodation & food services (4.6%)
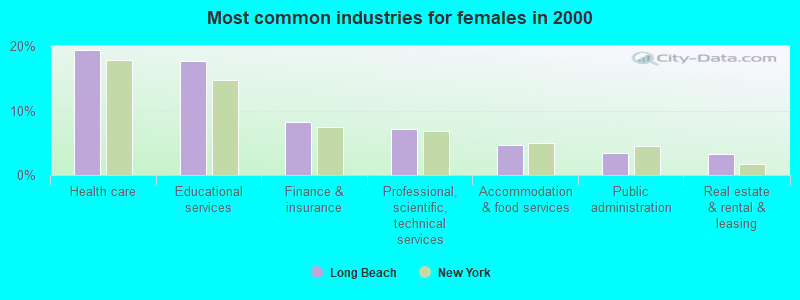
- Health care (19.4%)
- Educational services (17.7%)
- Finance & insurance (8.3%)
- Professional, scientific, technical services (7.1%)
- Accommodation & food services (4.6%)
- Public administration (3.3%)
- Real estate & rental & leasing (3.3%)
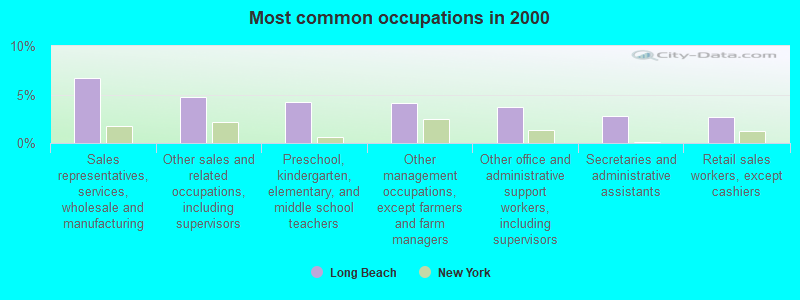
- Sales representatives, services, wholesale and manufacturing (6.7%)
- Other sales and related occupations, including supervisors (4.7%)
- Preschool, kindergarten, elementary, and middle school teachers (4.3%)
- Other management occupations, except farmers and farm managers (4.1%)
- Other office and administrative support workers, including supervisors (3.7%)
- Secretaries and administrative assistants (2.8%)
- Retail sales workers, except cashiers (2.7%)
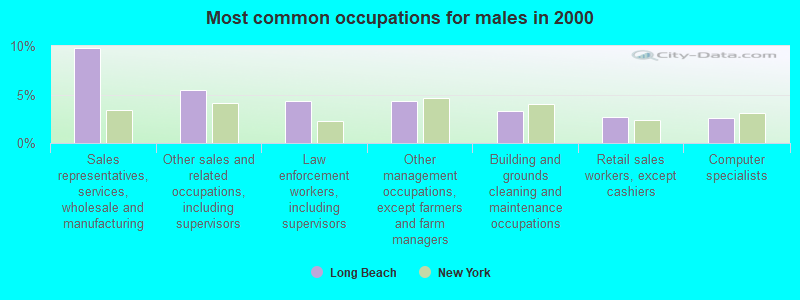
- Sales representatives, services, wholesale and manufacturing (9.8%)
- Other sales and related occupations, including supervisors (5.5%)
- Law enforcement workers, including supervisors (4.3%)
- Other management occupations, except farmers and farm managers (4.3%)
- Building and grounds cleaning and maintenance occupations (3.3%)
- Retail sales workers, except cashiers (2.7%)
- Computer specialists (2.6%)
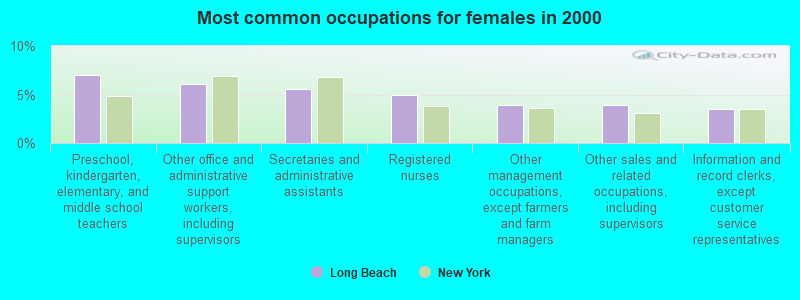
- Preschool, kindergarten, elementary, and middle school teachers (7.0%)
- Other office and administrative support workers, including supervisors (6.1%)
- Secretaries and administrative assistants (5.6%)
- Registered nurses (4.9%)
- Other management occupations, except farmers and farm managers (3.9%)
- Other sales and related occupations, including supervisors (3.9%)
- Information and record clerks, except customer service representatives (3.5%)
Average climate in Long Beach, New York
Based on data reported by over 4,000 weather stations


|
|


(lower is better)
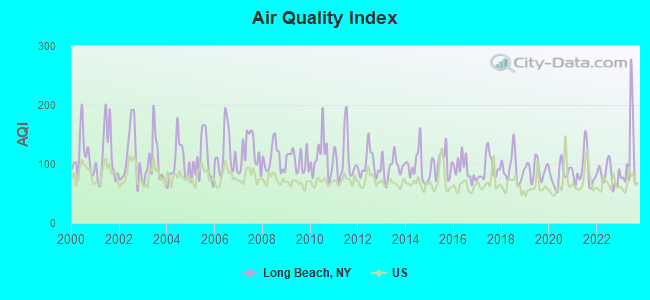
Air Quality Index (AQI) level in 2023 was 110. This is significantly worse than average.
| City: | 110 |
| U.S.: | 73 |
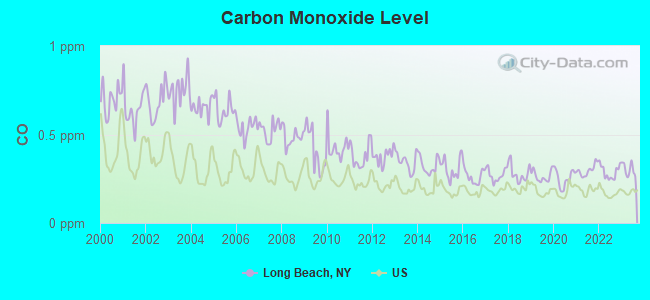
Carbon Monoxide (CO) [ppm] level in 2023 was 0.302. This is worse than average. Closest monitor was 7.3 miles away from the city center.
| City: | 0.302 |
| U.S.: | 0.251 |
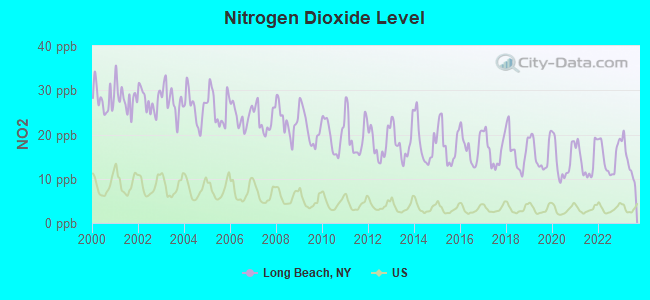
Nitrogen Dioxide (NO2) [ppb] level in 2023 was 14.0. This is significantly worse than average. Closest monitor was 10.4 miles away from the city center.
| City: | 14.0 |
| U.S.: | 5.1 |
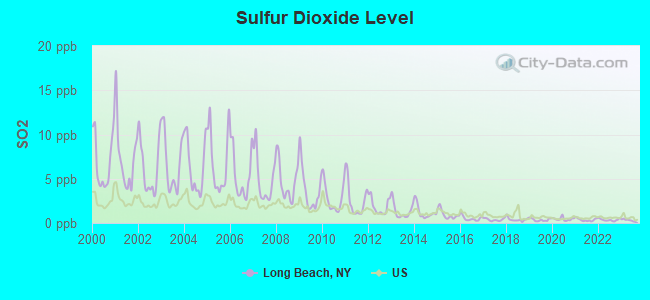
Sulfur Dioxide (SO2) [ppb] level in 2023 was 0.317. This is significantly better than average. Closest monitor was 2.5 miles away from the city center.
| City: | 0.317 |
| U.S.: | 1.515 |
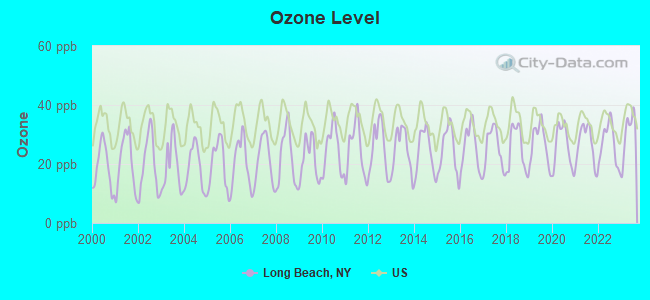
Ozone [ppb] level in 2023 was 30.5. This is about average. Closest monitor was 11.4 miles away from the city center.
| City: | 30.5 |
| U.S.: | 33.3 |
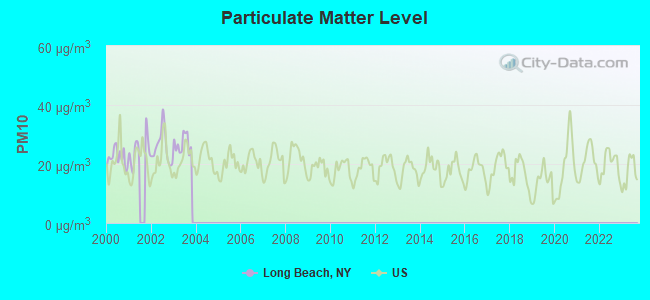
Particulate Matter (PM10) [µg/m3] level in 2003 was 26.9. This is worse than average. Closest monitor was 13.0 miles away from the city center.
| City: | 26.9 |
| U.S.: | 19.2 |
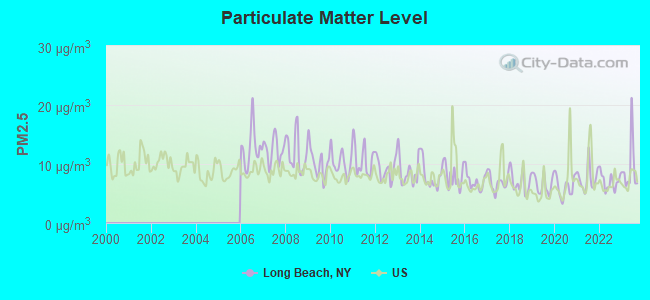
Particulate Matter (PM2.5) [µg/m3] level in 2023 was 9.32. This is about average. Closest monitor was 4.6 miles away from the city center.
| City: | 9.32 |
| U.S.: | 8.11 |
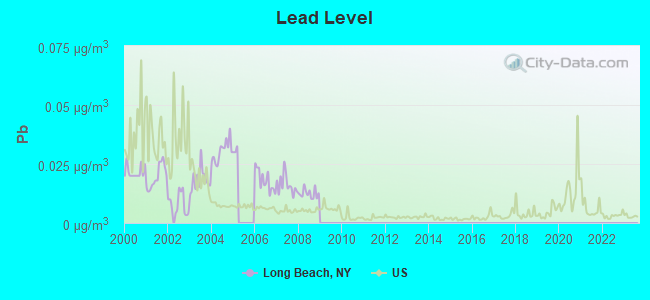
Lead (Pb) [µg/m3] level in 2008 was 0.0125. This is worse than average. Closest monitor was 11.6 miles away from the city center.
| City: | 0.0125 |
| U.S.: | 0.0093 |
Tornado activity:
Long Beach-area historical tornado activity is slightly above New York state average. It is 54% smaller than the overall U.S. average.
On 9/7/1998, a category F2 (max. wind speeds 113-157 mph) tornado 4.3 miles away from the Long Beach city center injured 6 people and caused $1 million in damages.
On 9/18/1973, a category F2 tornado 9.8 miles away from the city center .
Earthquake activity:
Long Beach-area historical earthquake activity is significantly above New York state average. It is 70% smaller than the overall U.S. average.On 8/23/2011 at 17:51:04, a magnitude 5.8 (5.8 MW, Depth: 3.7 mi, Class: Moderate, Intensity: VI - VII) earthquake occurred 294.2 miles away from Long Beach center
On 10/7/1983 at 10:18:46, a magnitude 5.3 (5.1 MB, 5.3 LG, 5.1 ML) earthquake occurred 235.3 miles away from the city center
On 1/16/1994 at 01:49:16, a magnitude 4.6 (4.6 MB, 4.6 LG, Depth: 3.1 mi, Class: Light, Intensity: IV - V) earthquake occurred 125.9 miles away from the city center
On 4/20/2002 at 10:50:47, a magnitude 5.3 (5.3 ML, Depth: 3.0 mi) earthquake occurred 271.4 miles away from Long Beach center
On 4/20/2002 at 10:50:47, a magnitude 5.2 (5.2 MB, 4.2 MS, 5.2 MW, 5.0 MW) earthquake occurred 269.7 miles away from the city center
On 8/22/1992 at 12:20:32, a magnitude 4.8 (4.8 MB, 3.8 MS, 4.7 LG, Depth: 6.2 mi) earthquake occurred 205.3 miles away from Long Beach center
Magnitude types: regional Lg-wave magnitude (LG), body-wave magnitude (MB), local magnitude (ML), surface-wave magnitude (MS), moment magnitude (MW)
Natural disasters:
The number of natural disasters in Nassau County (25) is a lot greater than the US average (15).Major Disasters (Presidential) Declared: 17
Emergencies Declared: 7
Causes of natural disasters: Hurricanes: 8, Storms: 7, Floods: 6, Blizzards: 2, Snowstorms: 2, Heavy Rain: 1, Power Outage: 1, Tropical Depression: 1, Tropical Storm: 1, Water Shortage: 1, Winter Storm: 1, Other: 3 (Note: some incidents may be assigned to more than one category).

Hospitals and medical centers in Long Beach:
- LONG BEACH MEDICAL CENTER (Voluntary non-profit - Private, provides emergency services, 455 EAST BAY DRIVE)
- BEACH TERRACE CARE CENTER (640 WEST BROADWAY)
- GRANDELL REHABILITATION AND NURSING CENTER (645 W BROADWAY)
- KOMANOFF CTR FOR GERIATRIC AND REHAB MEDICINE (375 EAST BAY DRIVE)
- LONG BEACH MEMORIAL NH (375 EAST BAY DRIVE)
- PARK AVENUE EXTENDED CARE FACILITY (425 NATIONAL BOULEVARD)
- LONG BEACH MEDICAL CENTER (455 EAST BAY DRIVE)
- LONG BEACH MEDICAL CENTER CHHA (249 EAST PARK AVENUE)
- LONG BEACH MEM NH LTHHCP (375 E BAY DR)
Amtrak stations near Long Beach:
- 8 miles: KENNEDY AIRPORT NEW YORK (QUEENS, ) - Bus Station . Services: enclosed waiting area, public restrooms, public payphones, snack bar and vending machines, ATM, paid short-term parking, paid long-term parking, car rental agency, taxi stand.
- 17 miles: LA GUARDIA AIRPORT (QUEENS, ) - Bus Station . Services: enclosed waiting area, public restrooms, public payphones, snack bar and vending machines, ATM, paid short-term parking, paid long-term parking, car rental agency, taxi stand.
College/University in Long Beach:
Colleges/universities with over 2000 students nearest to Long Beach:
- Molloy College (about 8 miles; Rockville Centre, NY; Full-time enrollment: 3,962)
- Adelphi University (about 10 miles; Garden City, NY; FT enrollment: 7,312)
- Hofstra University (about 10 miles; Hempstead, NY; FT enrollment: 9,429)
- CUNY York College (about 11 miles; Jamaica, NY; FT enrollment: 6,312)
- Nassau Community College (about 11 miles; Garden City, NY; FT enrollment: 18,552)
- St John's University-New York (about 12 miles; Queens, NY; FT enrollment: 15,175)
- CUNY Queensborough Community College (about 13 miles; Bayside, NY; FT enrollment: 11,931)
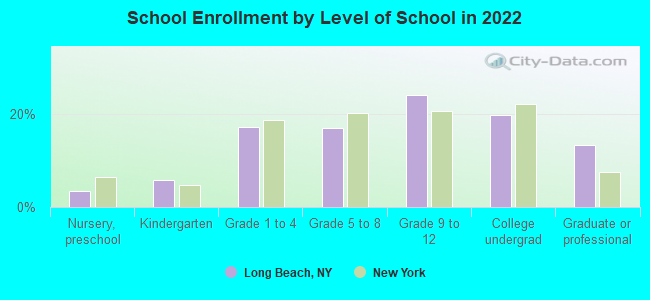
Public high school in Long Beach:
- LONG BEACH SENIOR HIGH SCHOOL (Students: 1,375, Location: 322 LAGOON DR W, Grades: 9-12)
Private high schools in Long Beach:
- MESIVTA OF LONG BEACH (Students: 139, Location: 205 W BEECH ST, Grades: 9-12, Boys only)
- HARRIET EISMAN COMMUNITY SCHOOL (Students: 104, Location: 165 E PARK AVE, Grades: 9-12)
- HARRIET E SNOW COMMUNITY SCHOOL (Students: 87, Location: 165 E PARK AVE, Grades: 9-12)
Public elementary/middle schools in Long Beach:
- LONG BEACH MIDDLE SCHOOL (Students: 837, Location: 239 LIDO BLVD, Grades: 6-8)
- LIDO ELEMENTARY SCHOOL (Students: 459, Location: 237 LIDO BLVD, Grades: PK-5)
- LINDELL BOULEVARD SCHOOL (Students: 422, Location: 601 LINDELL BLVD, Grades: KG-6)
- EAST ELEMENTARY SCHOOL (Location: 456 NEPTUNE BLVD, Grades: KG-5)
- WEST ELEMENTARY SCHOOL (Location: 91 MARYLAND AVE, Grades: KG-5)
Private elementary/middle schools in Long Beach:
- HEBREW ACADEMY OF LONG BEACH (Students: 772, Location: 530 W BROADWAY, Grades: 1-8)
- LONG BEACH CATHOLIC REGIONAL SCHOOL (Students: 492, Location: 735 W BROADWAY, Grades: PK-8)
- MONTESSORI SCHOOL OF LONG BEACH (Students: 27, Location: 111 DELAWARE AVE, Grades: PK-T1)
Library in Long Beach:
Points of interest:
Notable locations in Long Beach: City of Long Beach Water Treatment Plant (A), Long Beach Sewage Disposal Plant (B), Park Place Water Treatment Plant (C), Long Beach Station (D), Long Beach City Hall (E), West End Library (F), Long Beach Fire Department Station Number 3 (G), Long Beach Fire House Number 2 (H), Sonabend Family Library (I), Kennedy House (J), Laurel Theatre (K), Seaview Terrace (L), The Tides Nursing Home (M), Jewish War Veterans Memorial Building (N), Long Beach Public Library (O), Beach Terrace Care Center (P), Grandell Rehabilitation and Nursing Center (Q), Hoffmann Manor of Long Beach Assisted Living Facility (R), Komanoff Center for Geriatric and Rehabilitative Medicine (S), Park Avenue Extended Care Facility (T). Display/hide their locations on the map
Churches in Long Beach include: Sephardic Congregation of Long Beach (A), West End Synagogue (B), Temple Emanu-El (C), Saint Mary of the Isle Roman Catholic Church (D), Christian Lighthouse Missionary Baptist Church (E), Temple Beth El of Long Beach (F), Church of Saint Ignatius Martyr (G), People's Church of Long Beach (H), Temple Zion (I). Display/hide their locations on the map
Beach: Long Beach (A). Display/hide its location on the map
Birthplace of: Mike Portnoy - Drummer, Billy Crystal - (born 1947), comedian, television personality, Les Crane - Talk-show host, Mike Francesa - Sports radio host, Steven Libutti - Physician, Aline Kominsky-Crumb - Artist, John Lannan - Baseball player, Laura D'Auguste - Martial artist, Lori Laitman - Composer, Mike Palacio - Soccer player.
| This city: | 2.2 people |
| New York: | 2.6 people |
| This city: | 51.3% |
| Whole state: | 63.5% |
| This city: | 6.9% |
| Whole state: | 6.8% |
Likely homosexual households (counted as self-reported same-sex unmarried-partner households)
- Lesbian couples: 0.7% of all households
- Gay men: 0.3% of all households
People in group quarters in Long Beach in 2010:
- 822 people in nursing facilities/skilled-nursing facilities
- 126 people in college/university student housing
- 96 people in residential schools for people with disabilities
- 48 people in other noninstitutional facilities
- 2 people in mental (psychiatric) hospitals and psychiatric units in other hospitals
People in group quarters in Long Beach in 2000:
- 814 people in nursing homes
- 288 people in homes for the mentally retarded
- 174 people in homes for the physically handicapped
- 170 people in other noninstitutional group quarters
- 91 people in other group homes
- 86 people in homes for abused, dependent, and neglected children
- 76 people in college dormitories (includes college quarters off campus)
- 15 people in religious group quarters
Banks with branches in Long Beach (2011 data):
- JPMorgan Chase Bank, National Association: Long Beach West Branch at 220 E Park Ave, branch established on 2010/09/20; Long Beach Branch at 37 E Park Avenue, branch established on 2006/01/17. Info updated 2011/11/10: Bank assets: $1,811,678.0 mil, Deposits: $1,190,738.0 mil, headquarters in Columbus, OH, positive income, International Specialization, 5577 total offices, Holding Company: Jpmorgan Chase & Co.
- Emigrant Savings Bank - Long Island: Long Beach Branch at 280 East Park Avenue, branch established on 1972/06/09. Info updated 2006/11/03: Bank assets: $549.9 mil, Deposits: $490.3 mil, headquarters in Westbury, NY, positive income, Mortgage Lending Specialization, 7 total offices, Holding Company: New York Private Bank & Trust Corporation
- Citibank, National Association: Long Beach Branch at 135 East Park Avenue, branch established on 1987/07/13. Info updated 2012/01/10: Bank assets: $1,288,658.0 mil, Deposits: $882,541.0 mil, headquarters in Sioux Falls, SD, positive income, International Specialization, 1048 total offices, Holding Company: Citigroup Inc.
- TD Bank, National Association: Long Beach Branch at 550 Long Beach Boulevard, branch established on 2002/12/28. Info updated 2010/10/04: Bank assets: $188,912.6 mil, Deposits: $153,149.8 mil, headquarters in Wilmington, DE, positive income, 1314 total offices, Holding Company: Toronto-Dominion Bank, The
- Capital One, National Association: Long Beach Branch at 11 East Park Avenue, branch established on 2007/01/29. Info updated 2011/07/01: Bank assets: $133,477.8 mil, Deposits: $97,063.7 mil, headquarters in Mclean, VA, positive income, 984 total offices, Holding Company: Capital One Financial Corporation
- Bank of America, National Association: Long Beach Branch at 52 East Park Avenue, branch established on 1955/04/15. Info updated 2009/11/18: Bank assets: $1,451,969.3 mil, Deposits: $1,077,176.8 mil, headquarters in Charlotte, NC, positive income, 5782 total offices, Holding Company: Bank Of America Corporation
For population 15 years and over in Long Beach:
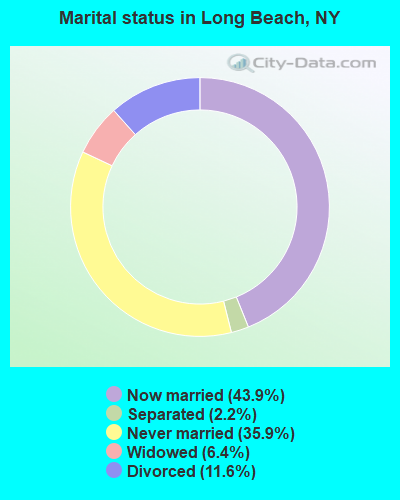
- Never married: 35.9%
- Now married: 43.9%
- Separated: 2.2%
- Widowed: 6.4%
- Divorced: 11.6%
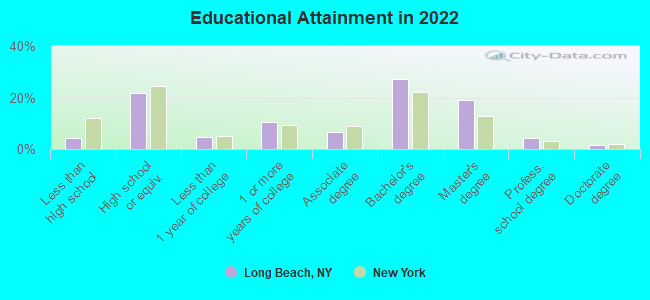
For population 25 years and over in Long Beach:
- High school or higher: 95.9%
- Bachelor's degree or higher: 51.2%
- Graduate or professional degree: 24.1%
- Unemployed: 5.7%
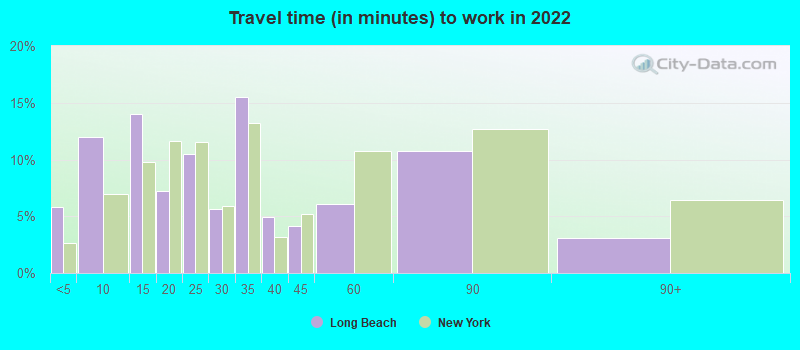
- Mean travel time to work (commute): 35.2 minutes
| Here: | 10.9 |
| New York average: | 13.9 |
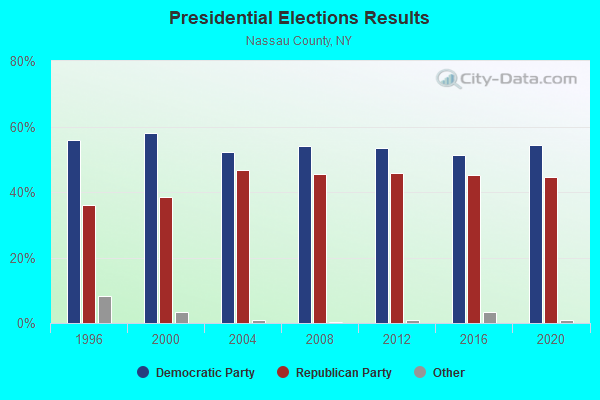
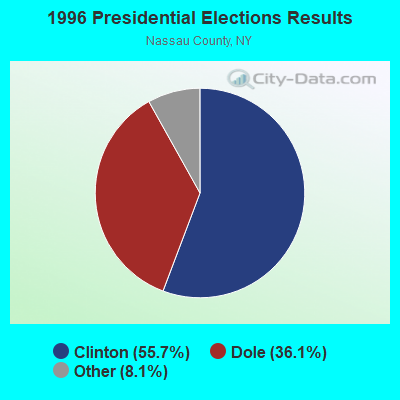
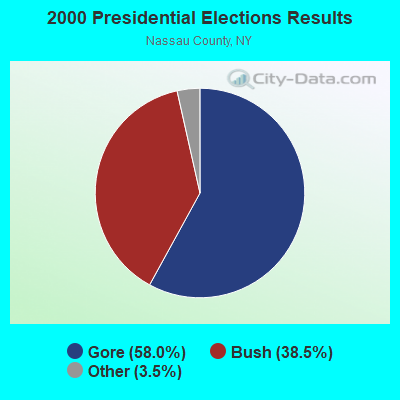
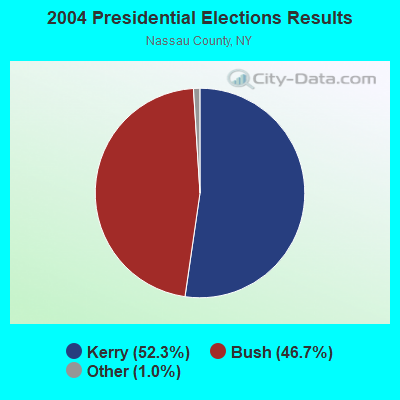
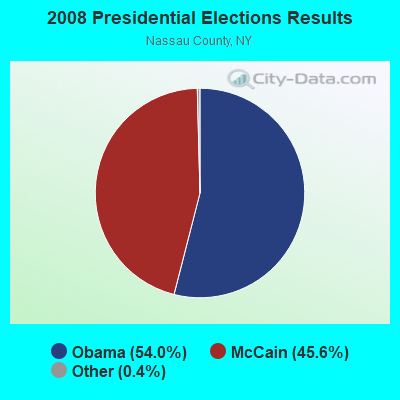
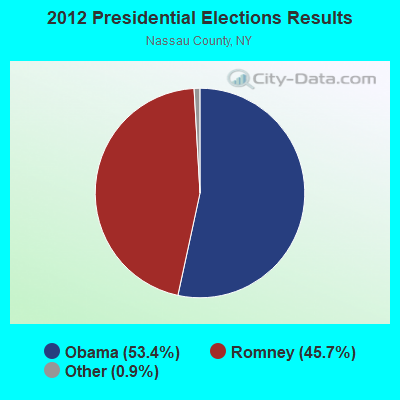
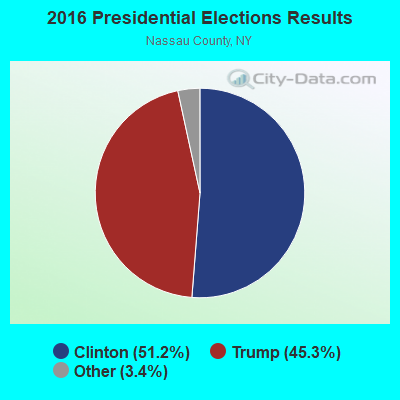
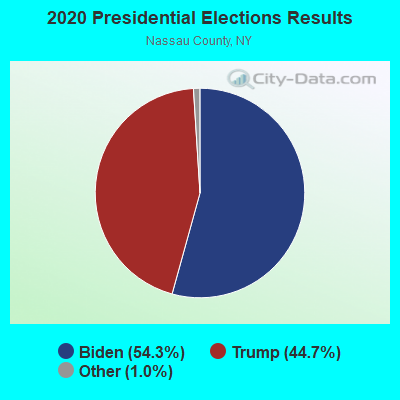
Graphs represent county-level data. Detailed 2008 Election Results
Religion statistics for Long Beach, NY (based on Nassau County data)
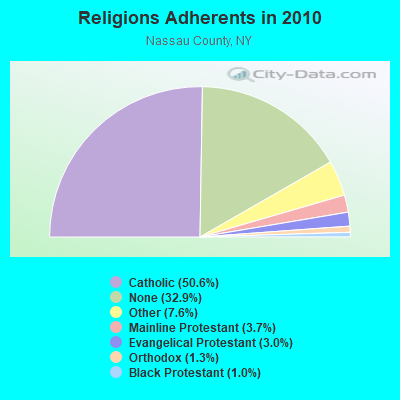
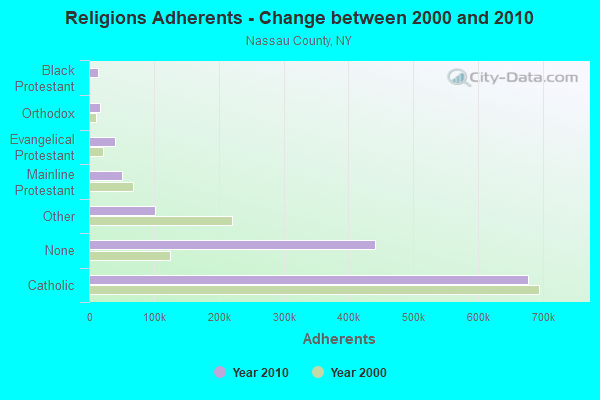
| Religion | Adherents | Congregations |
|---|---|---|
| Catholic | 677,149 | 73 |
| Other | 102,012 | 168 |
| Mainline Protestant | 50,181 | 184 |
| Evangelical Protestant | 39,923 | 251 |
| Orthodox | 16,758 | 22 |
| Black Protestant | 13,189 | 45 |
| None | 440,320 | - |
Food Environment Statistics:
| Nassau County: | 4.11 / 10,000 pop. |
| State: | 4.13 / 10,000 pop. |
| This county: | 0.05 / 10,000 pop. |
| New York: | 0.06 / 10,000 pop. |
| Here: | 1.49 / 10,000 pop. |
| New York: | 0.92 / 10,000 pop. |
| Nassau County: | 1.29 / 10,000 pop. |
| State: | 1.68 / 10,000 pop. |
| Nassau County: | 9.01 / 10,000 pop. |
| New York: | 8.82 / 10,000 pop. |
| This county: | 8.3% |
| New York: | 8.2% |
| Here: | 20.9% |
| New York: | 23.8% |
| Nassau County: | 22.2% |
| New York: | 15.6% |
Health and Nutrition:
| This city: | 52.2% |
| State: | 50.1% |
| Here: | 50.9% |
| New York: | 48.1% |
| This city: | 28.4 |
| New York: | 28.5 |
| This city: | 20.0% |
| State: | 20.3% |
| Here: | 9.7% |
| State: | 11.1% |
| This city: | 6.9 |
| State: | 6.8 |
| Long Beach: | 34.1% |
| New York: | 33.4% |
| This city: | 58.8% |
| New York: | 56.5% |
| Long Beach: | 80.2% |
| New York: | 80.2% |
More about Health and Nutrition of Long Beach, NY Residents
| Local government employment and payroll (March 2022) | |||||
| Function | Full-time employees | Monthly full-time payroll | Average yearly full-time wage | Part-time employees | Monthly part-time payroll |
|---|---|---|---|---|---|
| Police Protection - Officers | 70 | $947,403 | $162,412 | 0 | $0 |
| Streets and Highways | 48 | $397,108 | $99,277 | 16 | $39,978 |
| Firefighters | 31 | $378,269 | $146,427 | 0 | $0 |
| Transit | 23 | $137,326 | $71,648 | 12 | $30,263 |
| Other Government Administration | 23 | $101,883 | $53,156 | 7 | $13,901 |
| Solid Waste Management | 23 | $179,945 | $93,884 | 16 | $46,827 |
| Water Supply | 21 | $177,438 | $101,393 | 0 | $0 |
| Sewerage | 21 | $141,326 | $80,758 | 3 | $4,841 |
| Other and Unallocable | 20 | $126,571 | $75,943 | 0 | $0 |
| Housing and Community Development (Local) | 17 | $77,414 | $54,645 | 3 | $4,638 |
| Financial Administration | 16 | $107,789 | $80,842 | 2 | $1,714 |
| Police - Other | 16 | $106,272 | $79,704 | 10 | $19,361 |
| Parks and Recreation | 15 | $99,383 | $79,506 | 53 | $76,114 |
| Welfare | 11 | $54,644 | $59,612 | 24 | $20,403 |
| Judicial and Legal | 5 | $48,778 | $117,067 | 7 | $13,901 |
| Fire - Other | 0 | $0 | 11 | $17,404 | |
| Totals for Government | 360 | $3,081,549 | $102,718 | 164 | $289,345 |
Long Beach government finances - Expenditure in 2021 (per resident):
- Construction - General - Other: $5,179,000 ($149.66)
Regular Highways: $2,900,000 ($83.81)
Parks and Recreation: $1,835,000 ($53.03)
Water Utilities: $846,000 ($24.45)
Sewerage: $513,000 ($14.82)
- Current Operations - General - Other: $35,428,000 ($1023.81)
Police Protection: $12,430,000 ($359.21)
Solid Waste Management: $8,751,000 ($252.89)
Parks and Recreation: $4,716,000 ($136.28)
Water Utilities: $3,875,000 ($111.98)
Local Fire Protection: $3,558,000 ($102.82)
Sewerage: $3,074,000 ($88.83)
Judicial and Legal Services: $1,863,000 ($53.84)
Transit Utilities: $1,600,000 ($46.24)
Financial Administration: $1,548,000 ($44.73)
Central Staff Services: $1,399,000 ($40.43)
General Public Buildings: $1,267,000 ($36.61)
Natural Resources - Other: $838,000 ($24.22)
Regular Highways: $532,000 ($15.37)
Housing and Community Development: $155,000 ($4.48)
Health - Other: $123,000 ($3.55)
- General - Interest on Debt: $6,241,000 ($180.35)
- Intergovernmental to Local - Other - Other Higher Education: $305,000 ($8.81)
- Intergovernmental to State - Transit Utilities: $1,712,000 ($49.47)
- Other Capital Outlay - Local Fire Protection: $137,000 ($3.96)
Parks and Recreation: $25,000 ($0.72)
Central Staff Services: $24,000 ($0.69)
- Total Salaries and Wages: $38,327,000 ($1107.59)
Long Beach government finances - Revenue in 2021 (per resident):
- Charges - Solid Waste Management: $10,214,000 ($295.17)
Sewerage: $6,527,000 ($188.62)
Parks and Recreation: $4,972,000 ($143.68)
Other: $1,576,000 ($45.54)
Parking Facilities: $40,000 ($1.16)
- Federal Intergovernmental - Other: $13,040,000 ($376.84)
Housing and Community Development: $111,000 ($3.21)
- Local Intergovernmental - General Local Government Support: $1,966,000 ($56.81)
Other: $250,000 ($7.22)
- Miscellaneous - General Revenue - Other: $1,384,000 ($40.00)
Fines and Forfeits: $664,000 ($19.19)
Rents: $596,000 ($17.22)
Special Assessments: $302,000 ($8.73)
Interest Earnings: $121,000 ($3.50)
Donations From Private Sources: $24,000 ($0.69)
- Revenue - Water Utilities: $4,814,000 ($139.12)
Transit Utilities: $168,000 ($4.85)
- State Intergovernmental - General Local Government Support: $3,772,000 ($109.00)
Other: $855,000 ($24.71)
Transit Utilities: $788,000 ($22.77)
Highways: $302,000 ($8.73)
- Tax - Property: $46,583,000 ($1346.17)
Other License: $3,510,000 ($101.43)
General Sales and Gross Receipts: $2,779,000 ($80.31)
Public Utilities Sales: $1,267,000 ($36.61)
Occupation and Business License - Other: $424,000 ($12.25)
Long Beach government finances - Debt in 2021 (per resident):
- Long Term Debt - Outstanding Unspecified Public Purpose: $89,736,000 ($2593.23)
Beginning Outstanding - Unspecified Public Purpose: $71,198,000 ($2057.51)
Issue, Unspecified Public Purpose: $26,207,000 ($757.34)
Retired Unspecified Public Purpose: $7,669,000 ($221.62)
- Short Term Debt Outstanding - Beginning: $42,760,000 ($1235.70)
End of Fiscal Year: $29,356,000 ($848.34)
Long Beach government finances - Cash and Securities in 2021 (per resident):
- Bond Funds - Cash and Securities: $35,819,000 ($1035.11)
- Other Funds - Cash and Securities: $16,564,000 ($478.67)
- Sinking Funds - Cash and Securities: $287,000 ($8.29)
4.70% of this county's 2021 resident taxpayers lived in other counties in 2020 ($121,726 average adjusted gross income)
| Here: | 4.70% |
| New York average: | 5.29% |
0.01% of residents moved from foreign countries ($55 average AGI)
Nassau County: 0.01% New York average: 0.01%
Top counties from which taxpayers relocated into this county between 2020 and 2021:
| from Queens County, NY | |
| from Suffolk County, NY | |
| from Kings County, NY |
5.44% of this county's 2020 resident taxpayers moved to other counties in 2021 ($120,429 average adjusted gross income)
| Here: | 5.44% |
| New York average: | 6.93% |
0.01% of residents moved to foreign countries ($114 average AGI)
Nassau County: 0.01% New York average: 0.02%
Top counties to which taxpayers relocated from this county between 2020 and 2021:
| to Suffolk County, NY | |
| to Queens County, NY | |
| to New York County, NY |
| Businesses in Long Beach, NY | ||||
| Name | Count | Name | Count | |
|---|---|---|---|---|
| 7-Eleven | 1 | Nike | 2 | |
| AT&T | 1 | Pier 1 Imports | 1 | |
| Baskin-Robbins | 1 | RadioShack | 1 | |
| CVS | 1 | Rite Aid | 1 | |
| Circle K | 1 | Sprint Nextel | 1 | |
| Curves | 1 | Starbucks | 2 | |
| Domino's Pizza | 1 | T-Mobile | 2 | |
| Dunkin Donuts | 1 | Taco Bell | 1 | |
| FedEx | 2 | True Value | 2 | |
| GNC | 1 | UPS | 3 | |
| Jones New York | 1 | Waldbaums | 1 | |
| KFC | 1 | Walgreens | 1 | |
| McDonald's | 1 | |||
Strongest AM radio stations in Long Beach:
- WFAN (660 AM; 50 kW; NEW YORK, NY; Owner: INFINITY BROADCASTING OPERATIONS, INC.)
- WHLI (1100 AM; daytime; 10 kW; HEMPSTEAD, NY)
- WCBS (880 AM; 50 kW; NEW YORK, NY; Owner: INFINITY BROADCASTING OPERATIONS, INC.)
- WQEW (1560 AM; 50 kW; NEW YORK, NY; Owner: THE NEW YORK TIMES ELECTRONIC MEDIA COMPANY)
- WMCA (570 AM; 50 kW; NEW YORK, NY; Owner: SALEM MEDIA OF NEW YORK, LLC)
- WOR (710 AM; 50 kW; NEW YORK, NY; Owner: BUCKLEY BROADCASTING CORPORATION)
- WABC (770 AM; 50 kW; NEW YORK, NY; Owner: WABC-AM RADIO, INC.)
- WBBR (1130 AM; 50 kW; NEW YORK, NY; Owner: BLOOMBERG COMMUNICATIONS INC.)
- WEPN (1050 AM; 50 kW; NEW YORK, NY; Owner: NEW YORK AM RADIO, LLC)
- WGSM (740 AM; 25 kW; HUNTINGTON, NY; Owner: K RADIO LICENSEE, INC.)
- WINS (1010 AM; 50 kW; NEW YORK, NY; Owner: INFINITY BROADCASTING OPERATIONS, INC.)
- WADO (1280 AM; 50 kW; NEW YORK, NY; Owner: WADO-AM LICENSE CORP.)
- WLIB (1190 AM; 30 kW; NEW YORK, NY; Owner: ICBC BROADCAST HOLDINGS-NY, INC.)
Strongest FM radio stations in Long Beach:
- WNYC-FM (93.9 FM; NEW YORK, NY; Owner: WNYC RADIO)
- WQCD (101.9 FM; NEW YORK, NY; Owner: EMMIS RADIO LICENSE CORPORATION)
- WPAT-FM (93.1 FM; PATERSON, NJ; Owner: WPAT LICENSING, INC.)
- WKTU (103.5 FM; LAKE SUCCESS, NY; Owner: AMFM RADIO LICENSES, LLC)
- WCAA (105.9 FM; NEWARK, NJ; Owner: WADO-AM LICENSE CORP. ("WADO"))
- WBAI (99.5 FM; NEW YORK, NY; Owner: PACIFICA FOUNDATION, INC.)
- WBLS (107.5 FM; NEW YORK, NY; Owner: ICBC BROADCAST HOLDINGS-NY, INC.)
- WLTW (106.7 FM; NEW YORK, NY; Owner: AMFM NEW YORK LICENSES, LLC)
- WQXR-FM (96.3 FM; NEW YORK, NY; Owner: THE NEW YORK TIMES ELECTRONIC MEDIA COMPANY)
- WSKQ-FM (97.9 FM; NEW YORK, NY; Owner: WSKQ LICENSING, INC.)
- WXRK (92.3 FM; NEW YORK, NY; Owner: INFINITY BROADCASTING OPERATIONS, INC.)
- WQHT (97.1 FM; NEW YORK, NY; Owner: EMMIS LICENSE CORPORATION OF NEW YORK)
- WAXQ (104.3 FM; NEW YORK, NY; Owner: AMFM NEW YORK LICENSES, LLC)
- WHTZ (100.3 FM; NEWARK, NJ; Owner: AMFM RADIO LICENSES, L.L.C.)
- WWPR-FM (105.1 FM; NEW YORK, NY; Owner: AMFM RADIO LICENSES, L.L.C.)
- WCBS-FM (101.1 FM; NEW YORK, NY; Owner: INFINITY BROADCASTING OPERATIONS, INC.)
- WKCR-FM (89.9 FM; NEW YORK, NY; Owner: TRUSTEES OF COLUMBIA UNIVERSITY IN NEW YORK)
- WKJY (98.3 FM; HEMPSTEAD, NY; Owner: LONG ISLAND BROADCASTING, INC.)
- WLIR-FM (92.7 FM; GARDEN CITY, NY; Owner: JARAD BROADCASTING COMPANY INC.)
- WNEW (102.7 FM; NEW YORK, NY; Owner: INFINITY BROADCASTING OPERATIONS, INC.)
TV broadcast stations around Long Beach:
- WNYW (Channel 5; NEW YORK, NY; Owner: FOX TELEVISION STATIONS, INC.)
- WCBS-TV (Channel 2; NEW YORK, NY; Owner: CBS BROADCASTING INC.)
- WABC-TV (Channel 7; NEW YORK, NY; Owner: AMERICAN BROADCASTING COMPANIES, INC)
- WPIX (Channel 11; NEW YORK, NY; Owner: WPIX, INC.)
- WWOR-TV (Channel 9; SECAUCUS, NJ; Owner: FOX TELEVISION STATIONS, INC.)
- WXNY-LP (Channel 32; NEW YORK, NY; Owner: ISLAND BROADCASTING COMPANY)
- WPXN-TV (Channel 31; NEW YORK, NY; Owner: PAXSON COMMUNICATIONS LICENSE COMPANY, LLC)
- WNJU (Channel 47; LINDEN, NJ; Owner: WNJU LICENSE CORPORATION)
- WNBC (Channel 4; NEW YORK, NY; Owner: NATIONAL BROADCASTING COMPANY, INC.)
- WNET (Channel 13; NEWARK, NJ; Owner: EDUCATIONAL BROADCASTING CORPORATION)
- WXTV (Channel 41; PATERSON, NJ; Owner: WXTV LICENSE PARTNERSHIP, G.P.)
- WFUT (Channel 68; NEWARK, NJ; Owner: UNIVISION NEW YORK LLC)
- WNYE-TV (Channel 25; NEW YORK, NY; Owner: NEW YORK CITY BOARD OF EDUCATION)
- WKOB-LP (Channel 53; NEW YORK, NY; Owner: WKOB COMMUNICATIONS, INC.)
- WEBR-CA (Channel 17; MANHATTAN, NY; Owner: K LICENSEE INC.)
- WRNN-LP (Channel 57; NYACK, NY; Owner: LP NYACK LIMITED PARTNERSHIP)
- W60AI (Channel 60; NEW YORK, NY; Owner: VENTANA TELEVISION, INC.)
- WNYX-LP (Channel 35; NEW YORK, NY; Owner: ISLAND BROADCASTING COMPANY)
- W33BS (Channel 33; DARIEN, CT; Owner: CT&T BROADCASTING, INC.)
- WNYN-LP (Channel 39; NEW YORK, NY; Owner: ISLAND BROADCASTING COMPANY)
- WNXY-LP (Channel 26; NEW YORK, NY; Owner: ISLAND BROADCASTING COMPANY)
- WPXO-LP (Channel 34; EAST ORANGE, NJ; Owner: PAXSON COMMUNICATIONS LPTV, INC.)
- WLIG-LP (Channel 54; MINEOLA, NY; Owner: WLNY-TV, INC.)
- WPXU-LP (Channel 38; AMITYVILLE, NY; Owner: PAXSON COMMUNICATIONS LPTV, INC.)
- W68DN (Channel 68; CHERRY HILL, ETC., NJ; Owner: MARCIA COHEN)
- National Bridge Inventory (NBI) Statistics
- 5Number of bridges
- 190ft / 58.4mTotal length
- $121,022,000Total costs
- 14,001Total average daily traffic
- 343Total average daily truck traffic
- 17,244Total future (year 2040) average daily traffic
FCC Registered Cell Phone Towers:
1- 1039 West Park Avenue (51071) (Lat: 40.588694 Lon: -73.696972), Type: Pole, Structure height: 31.4 m, Call Sign: KNKA310
Assigned Frequencies: 869.040 MHz, 869.040 MHz, 869.040 MHz, 824.040 MHz, 824.040 MHz, 824.040 MHz, 890.010 MHz, 890.010 MHz, 890.010 MHz, 845.010 MHz, 845.010 MHz, 845.010 MHzGrant Date: 10/14/2015, Expiration Date: 10/01/2025, Certifier: David C JatlowRegistrant: At&t Services, Inc., 208 S Akard St, 20f, Dallas, TX 75202, Phone: (855) 699-7073, Fax: (214) 746-6410, Email:
FCC Registered Antenna Towers:
5- Jim O'Dowd, 1103 West Beech St (Lat: 40.586167 Lon: -73.700861), Type: 18.2, Structure height: 36059 m, Overall height: 18.2 m, Registrant: New York Smsa Limited Partnership, Network.Regulatory@verizonwireless.Com, Suite 150 - Gasa5reg, Alpha-retta, Phone: (770) 797-1070
- Jim O'Dowd, 1103 West Beech St (Lat: 40.586167 Lon: -73.700861), Type: 18.2, Structure height: 36059 m, Overall height: 18.2 m, Registrant: New York Smsa Limited Partnership, Network.Regulatory@verizonwireless.Com, Suite 150 - Gasa5reg, Alpha-retta, Phone: (770) 797-1070
- cicily wallace, 1103 West Beech St (Lat: 40.586167 Lon: -73.700861), Type: 18.2, Structure height: 36059 m, Overall height: 18.2 m, Registrant: New York Smsa Limited Partnership, Network.Regulatory@verizonwireless.Com, Suite 150 - Gasa5reg, Alpha-retta, Phone: (770) 797-1070
- Mikhail Raznobriadsev, 1103 West Beech St (Lat: 40.586167 Lon: -73.700861), Type: 18.2, Structure height: 36059 m, Overall height: 18.2 m, Registrant: New York Smsa Limited Partnership, Network.Regulatory@verizonwireless.Com, Suite 150 - Gasa5reg, Alpha-retta, Phone: (770) 797-1070
- Steve Regitz, 1103 West Beech St (Lat: 40.586167 Lon: -73.700861), Type: 18.2, Structure height: 36059 m, Overall height: 18.2 m, Registrant: New York Smsa Limited Partnership, Network.Regulatory@verizonwireless.Com, Suite 150 - Gasa5reg, Alpha-retta, Phone: (770) 797-1070
FCC Registered Broadcast Land Mobile Towers:
8 (See the full list of FCC Registered Broadcast Land Mobile Towers in Long Beach, NY)FCC Registered Microwave Towers:
2- 310 RIVERSIDE BLVD., 310 Riverside Boulevard (Lat: 40.588250 Lon: -73.660889), Type: Building, Structure height: 28 m, Overall height: 36.6 m, Call Sign: WQKK464,
Assigned Frequencies: 10735.0 MHz, Grant Date: 06/23/2009, Expiration Date: 02/01/2019, Cancellation Date: 08/03/2010, Certifier: James J.R. Talbot, Registrant: At&t Corp., 2315 Salem Road, First Floor, H9, Conyers, GA 30013, Phone: (770) 602-2065, Fax: (770) 929-4454, Email:
- 700 SHORE ROAD, 700 Shore Road (Lat: 40.583889 Lon: -73.643472), Type: Building, Structure height: 29 m, Call Sign: WQKK465,
Assigned Frequencies: 10775.0 MHz, Grant Date: 06/23/2009, Expiration Date: 02/01/2019, Cancellation Date: 08/03/2010, Certifier: James J.R. Talbot, Registrant: At&t Corp., 2315 Salem Road, First Floor, H9, Conyers, GA 30013, Phone: (770) 602-2065, Fax: (770) 929-4454, Email:
FCC Registered Maritime Coast & Aviation Ground Towers:
1- Long Beach Bridge Long Beach Rd (Lat: 40.591778 Lon: -73.657917), Type: Building, Overall height: 8 m, Call Sign: WHD787,
Assigned Frequencies: 156.450 MHz, 156.650 MHz, 156.800 MHz, Grant Date: 12/08/2021, Expiration Date: 12/17/2031, Registrant: Nassau County Police Department, 1194 Prospect Avenue, Westbury, NY 11563, Phone: (516) 573-8640, Email:
FCC Registered Amateur Radio Licenses:
73 (See the full list of FCC Registered Amateur Radio Licenses in Long Beach)FAA Registered Aircraft Manufacturers and Dealers:
1- HARAHUSH EDWARD M, 10 Franklin Blvd Apt 307, Long Beach, NY 11561
Certificate: D002090 (Individual), Certificate Issue Date: 02/27/2006, Expiration Date: 02/26/2007
FAA Registered Aircraft:
5- Aircraft: CESSNA 172N (Category: Land, Seats: 4, Weight: Up to 12,499 Pounds, Speed: 105 mph), Engine: Reciprocating
N-Number: 55QB, N55QB, N-55QB, Serial Number: 17269080, Airworthiness Date: 05/06/1977, Certificate Issue Date: 08/29/2017
Registrant (Individual): Raymond C Sainthill, 552 E Bay Dr, Long Beach, NY 11561 - Aircraft: MARK WALSH BD-4C (Category: Land, Seats: 4, Weight: Up to 12,499 Pounds), Engine: LYCOMING IO-360-A1A (200 HP) (Reciprocating)
N-Number: 68PJ, N68PJ, N-68PJ, Serial Number: BD4C021, Year manufactured: 2019, Airworthiness Date: 09/22/2019, Certificate Issue Date: 06/24/2019
Registrant (Individual): Mark W Walsh, 82 Trenton Ave, Long Beach, NY 11561 - Aircraft: CESSNA 150M (Category: Land, Seats: 2, Weight: Up to 12,499 Pounds, Speed: 81 mph), Engine: CONT MOTOR 0-200 SERIES (100 HP) (4 Cycle)
N-Number: 704FQ, N704FQ, N-704FQ, Serial Number: 15078579, Airworthiness Date: 08/06/1976, Certificate Issue Date: 03/30/2019
Registrant (Individual): Marc P Lapinel, 307 Magnolia Blvd, Long Beach, NY 11561
Deregistered: Cancel Date: 03/02/2018 - Aircraft: BEECH A35 (Category: Land, Seats: 4, Weight: Up to 12,499 Pounds, Speed: 120 mph), Engine: CONT MOTOR E185 SERIES (205 HP) (Reciprocating)
N-Number: 8518A, N8518A, N-8518A, Serial Number: D-2018, Airworthiness Date: 05/24/1993, Certificate Issue Date: 03/30/2019
Registrant (Individual): Marc P Lapinel, 307 Magnolia Blvd, Long Beach, NY 11561
Deregistered: Cancel Date: 03/07/2018 - Aircraft: MOONEY M20J (Category: Land, Seats: 4, Weight: Up to 12,499 Pounds, Speed: 126 mph), Engine: LYCOMING I0360 SER (180 HP) (Reciprocating)
N-Number: 9154K, N9154K, N-9154K, Serial Number: 24-3372, Year manufactured: 1995, Airworthiness Date: 11/03/1995, Certificate Issue Date: 08/02/2011
Registrant (Corporation): Sheridan Air LLC, 15 Tennessee Ave, Long Beach, NY 11561
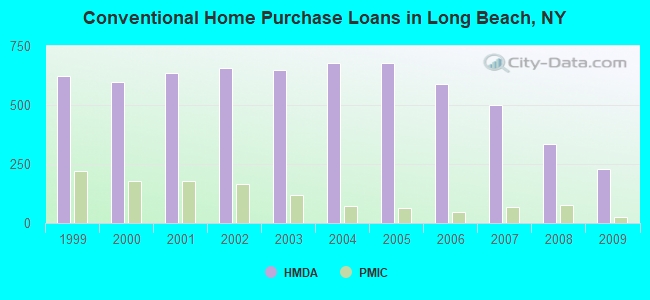
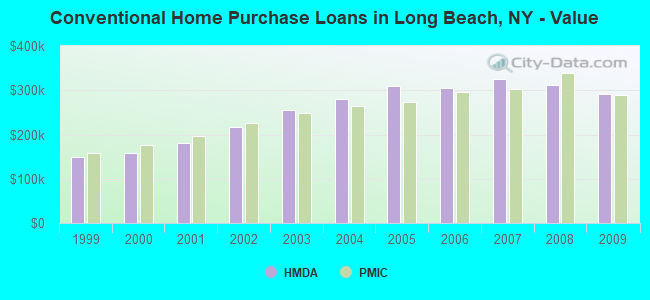
| Home Mortgage Disclosure Act Aggregated Statistics For Year 2009 (Based on 6 full tracts) | ||||||||||||||
| A) FHA, FSA/RHS & VA Home Purchase Loans | B) Conventional Home Purchase Loans | C) Refinancings | D) Home Improvement Loans | E) Loans on Dwellings For 5+ Families | F) Non-occupant Loans on < 5 Family Dwellings (A B C & D) | G) Loans On Manufactured Home Dwelling (A B C & D) | ||||||||
|---|---|---|---|---|---|---|---|---|---|---|---|---|---|---|
| Number | Average Value | Number | Average Value | Number | Average Value | Number | Average Value | Number | Average Value | Number | Average Value | Number | Average Value | |
| LOANS ORIGINATED | 40 | $439,950 | 230 | $291,913 | 450 | $276,584 | 24 | $195,625 | 3 | $749,667 | 75 | $256,360 | 1 | $434,000 |
| APPLICATIONS APPROVED, NOT ACCEPTED | 3 | $487,333 | 17 | $298,000 | 67 | $298,731 | 4 | $263,750 | 0 | $0 | 10 | $364,500 | 0 | $0 |
| APPLICATIONS DENIED | 14 | $428,071 | 61 | $361,377 | 246 | $337,374 | 27 | $86,407 | 2 | $100,000 | 29 | $296,552 | 1 | $10,000 |
| APPLICATIONS WITHDRAWN | 8 | $391,125 | 36 | $296,778 | 153 | $331,046 | 7 | $282,429 | 0 | $0 | 26 | $290,000 | 0 | $0 |
| FILES CLOSED FOR INCOMPLETENESS | 1 | $491,000 | 4 | $237,500 | 43 | $336,930 | 0 | $0 | 0 | $0 | 7 | $281,286 | 0 | $0 |
Detailed HMDA statistics for the following Tracts: 4164.00 , 4165.00, 4166.00, 4167.01, 4167.02, 4168.00
| Private Mortgage Insurance Companies Aggregated Statistics For Year 2009 (Based on 6 full tracts) | ||||
| A) Conventional Home Purchase Loans | B) Refinancings | |||
|---|---|---|---|---|
| Number | Average Value | Number | Average Value | |
| LOANS ORIGINATED | 25 | $289,240 | 7 | $352,143 |
| APPLICATIONS APPROVED, NOT ACCEPTED | 5 | $354,000 | 4 | $383,250 |
| APPLICATIONS DENIED | 11 | $349,091 | 3 | $434,667 |
| APPLICATIONS WITHDRAWN | 13 | $252,385 | 0 | $0 |
| FILES CLOSED FOR INCOMPLETENESS | 4 | $335,250 | 0 | $0 |
Detailed PMIC statistics for the following Tracts: 4164.00 , 4165.00, 4166.00, 4167.01, 4167.02, 4168.00
2003 - 2018 National Fire Incident Reporting System (NFIRS) incidents
- Fire incident types reported to NFIRS in Long Beach, NY
- 53851.5%Structure Fires
- 30128.8%Outside Fires
- 13713.1%Other
- 696.6%Mobile Property/Vehicle Fires
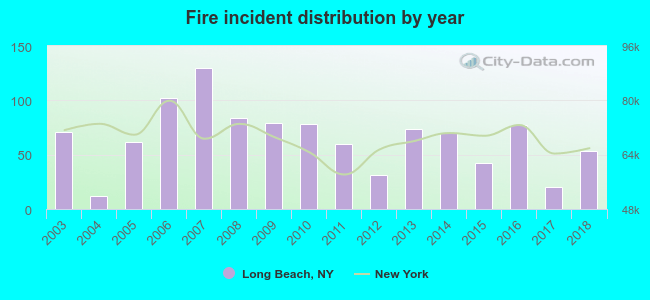 Based on the data from the years 2003 - 2018 the average number of fire incidents per year is 65. The highest number of fire incidents - 130 took place in 2007, and the least - 12 in 2004. The data has a declining trend.
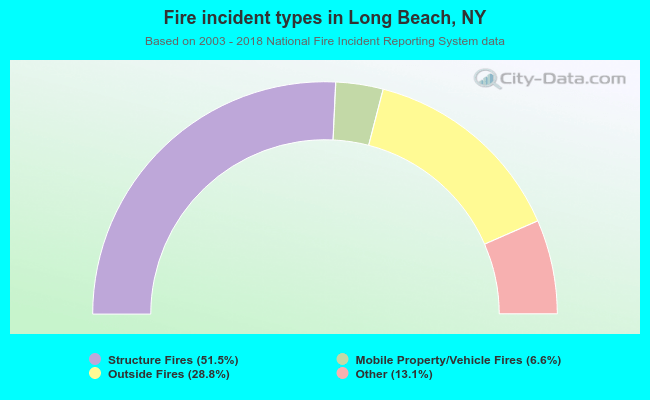 When looking into fire subcategories, the most reports belonged to: Structure Fires (51.5%), and Outside Fires (28.8%).
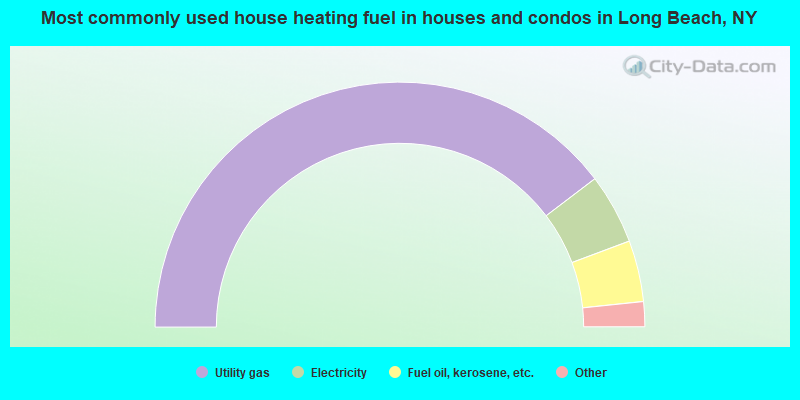
- 79.3%Utility gas
- 9.3%Electricity
- 8.1%Fuel oil, kerosene, etc.
- 2.4%Bottled, tank, or LP gas
- 0.6%Solar energy
- 0.1%Wood
- 0.1%Other fuel
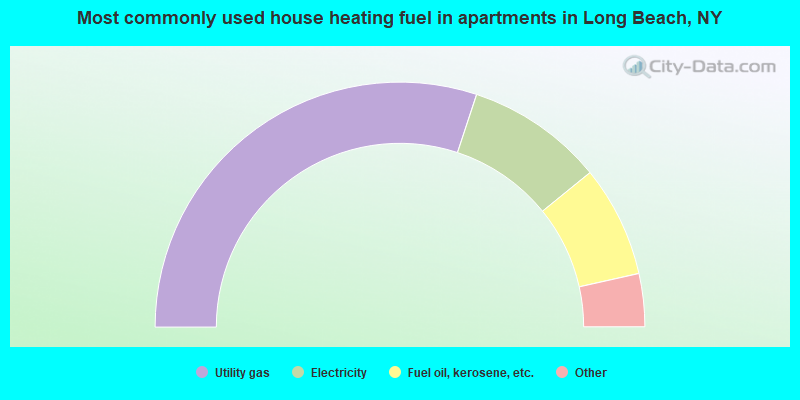
- 60.1%Utility gas
- 18.1%Electricity
- 14.7%Fuel oil, kerosene, etc.
- 3.9%Bottled, tank, or LP gas
- 2.6%No fuel used
- 0.5%Other fuel
Long Beach compared to New York state average:
- Median household income above state average.
- Median house value above state average.
- Unemployed percentage below state average.
- Black race population percentage below state average.
- Foreign-born population percentage below state average.
- Length of stay since moving in significantly above state average.
- Institutionalized population percentage above state average.
- Percentage of population with a bachelor's degree or higher above state average.
Long Beach on our top lists:
- #23 on the list of "Top 101 cities with the highest housing density (population 2,000+)"
- #38 on the list of "Top 101 cities with the largest percentage of people in homes for the physically handicapped (population 1,000+)"
- #72 on the list of "Top 101 cities with the most residents born in Europe, n.e.c. (population 500+)"
- #89 on the list of "Top 101 cities with the largest percentage of people in homes for abused, dependent, and neglected children (population 1,000+)"
- #8 on the list of "Top 101 counties with the most Orthodox adherents"
- #9 on the list of "Top 101 counties with the most Catholic adherents"
- #11 on the list of "Top 101 counties with the lowest percentage of residents that keep firearms around their homes"
- #13 on the list of "Top 101 counties with the highest ground withdrawal of fresh water for public supply"
- #13 on the list of "Top 101 counties with the most Orthodox congregations"

|
|
Total of 138 patent applications in 2008-2024.