Merritt Island, Florida Submit your own pictures of this place and show them to the world
OSM Map
General Map
Google Map
MSN Map
OSM Map
General Map
Google Map
MSN Map
OSM Map
General Map
Google Map
MSN Map
OSM Map
General Map
Google Map
MSN Map
Please wait while loading the map...
Population in 2010: 34,743. Population change since 2000: -3.7%Males: 17,472 Females: 17,271
March 2022 cost of living index in Merritt Island: 90.6 (less than average, U.S. average is 100) Percentage of residents living in poverty in 2022: 6.5%for White Non-Hispanic residents , 21.2% for Black residents , 4.9% for Hispanic or Latino residents , 3.7% for other race residents , 3.7% for two or more races residents )
Profiles of local businesses
Business Search - 14 Million verified businesses
Data:
Median household income ($)
Median household income (% change since 2000)
Household income diversity
Ratio of average income to average house value (%)
Ratio of average income to average rent
Median household income ($) - White
Median household income ($) - Black or African American
Median household income ($) - Asian
Median household income ($) - Hispanic or Latino
Median household income ($) - American Indian and Alaska Native
Median household income ($) - Multirace
Median household income ($) - Other Race
Median household income for houses/condos with a mortgage ($)
Median household income for apartments without a mortgage ($)
Races - White alone (%)
Races - White alone (% change since 2000)
Races - Black alone (%)
Races - Black alone (% change since 2000)
Races - American Indian alone (%)
Races - American Indian alone (% change since 2000)
Races - Asian alone (%)
Races - Asian alone (% change since 2000)
Races - Hispanic (%)
Races - Hispanic (% change since 2000)
Races - Native Hawaiian and Other Pacific Islander alone (%)
Races - Native Hawaiian and Other Pacific Islander alone (% change since 2000)
Races - Two or more races (%)
Races - Two or more races (% change since 2000)
Races - Other race alone (%)
Races - Other race alone (% change since 2000)
Racial diversity
Unemployment (%)
Unemployment (% change since 2000)
Unemployment (%) - White
Unemployment (%) - Black or African American
Unemployment (%) - Asian
Unemployment (%) - Hispanic or Latino
Unemployment (%) - American Indian and Alaska Native
Unemployment (%) - Multirace
Unemployment (%) - Other Race
Population density (people per square mile)
Population - Males (%)
Population - Females (%)
Population - Males (%) - White
Population - Males (%) - Black or African American
Population - Males (%) - Asian
Population - Males (%) - Hispanic or Latino
Population - Males (%) - American Indian and Alaska Native
Population - Males (%) - Multirace
Population - Males (%) - Other Race
Population - Females (%) - White
Population - Females (%) - Black or African American
Population - Females (%) - Asian
Population - Females (%) - Hispanic or Latino
Population - Females (%) - American Indian and Alaska Native
Population - Females (%) - Multirace
Population - Females (%) - Other Race
Coronavirus confirmed cases (Jun 10, 2024)
Deaths caused by coronavirus (Jun 10, 2024)
Coronavirus confirmed cases (per 100k population) (Jun 10, 2024)
Deaths caused by coronavirus (per 100k population) (Jun 10, 2024)
Daily increase in number of cases (Jun 10, 2024)
Weekly increase in number of cases (Jun 10, 2024)
Cases doubled (in days) (Jun 10, 2024)
Hospitalized patients (Apr 18, 2022)
Negative test results (Apr 18, 2022)
Total test results (Apr 18, 2022)
COVID Vaccine doses distributed (per 100k population) (Sep 19, 2023)
COVID Vaccine doses administered (per 100k population) (Sep 19, 2023)
COVID Vaccine doses distributed (Sep 19, 2023)
COVID Vaccine doses administered (Sep 19, 2023)
Likely homosexual households (%)
Likely homosexual households (% change since 2000)
Likely homosexual households - Lesbian couples (%)
Likely homosexual households - Lesbian couples (% change since 2000)
Likely homosexual households - Gay men (%)
Likely homosexual households - Gay men (% change since 2000)
Cost of living index
Median gross rent ($)
Median contract rent ($)
Median monthly housing costs ($)
Median house or condo value ($)
Median house or condo value ($ change since 2000)
Mean house or condo value by units in structure - 1, detached ($)
Mean house or condo value by units in structure - 1, attached ($)
Mean house or condo value by units in structure - 2 ($)
Mean house or condo value by units in structure by units in structure - 3 or 4 ($)
Mean house or condo value by units in structure - 5 or more ($)
Mean house or condo value by units in structure - Boat, RV, van, etc. ($)
Mean house or condo value by units in structure - Mobile home ($)
Median house or condo value ($) - White
Median house or condo value ($) - Black or African American
Median house or condo value ($) - Asian
Median house or condo value ($) - Hispanic or Latino
Median house or condo value ($) - American Indian and Alaska Native
Median house or condo value ($) - Multirace
Median house or condo value ($) - Other Race
Median resident age
Resident age diversity
Median resident age - Males
Median resident age - Females
Median resident age - White
Median resident age - Black or African American
Median resident age - Asian
Median resident age - Hispanic or Latino
Median resident age - American Indian and Alaska Native
Median resident age - Multirace
Median resident age - Other Race
Median resident age - Males - White
Median resident age - Males - Black or African American
Median resident age - Males - Asian
Median resident age - Males - Hispanic or Latino
Median resident age - Males - American Indian and Alaska Native
Median resident age - Males - Multirace
Median resident age - Males - Other Race
Median resident age - Females - White
Median resident age - Females - Black or African American
Median resident age - Females - Asian
Median resident age - Females - Hispanic or Latino
Median resident age - Females - American Indian and Alaska Native
Median resident age - Females - Multirace
Median resident age - Females - Other Race
Commute - mean travel time to work (minutes)
Travel time to work - Less than 5 minutes (%)
Travel time to work - Less than 5 minutes (% change since 2000)
Travel time to work - 5 to 9 minutes (%)
Travel time to work - 5 to 9 minutes (% change since 2000)
Travel time to work - 10 to 19 minutes (%)
Travel time to work - 10 to 19 minutes (% change since 2000)
Travel time to work - 20 to 29 minutes (%)
Travel time to work - 20 to 29 minutes (% change since 2000)
Travel time to work - 30 to 39 minutes (%)
Travel time to work - 30 to 39 minutes (% change since 2000)
Travel time to work - 40 to 59 minutes (%)
Travel time to work - 40 to 59 minutes (% change since 2000)
Travel time to work - 60 to 89 minutes (%)
Travel time to work - 60 to 89 minutes (% change since 2000)
Travel time to work - 90 or more minutes (%)
Travel time to work - 90 or more minutes (% change since 2000)
Marital status - Never married (%)
Marital status - Now married (%)
Marital status - Separated (%)
Marital status - Widowed (%)
Marital status - Divorced (%)
Median family income ($)
Median family income (% change since 2000)
Median non-family income ($)
Median non-family income (% change since 2000)
Median per capita income ($)
Median per capita income (% change since 2000)
Median family income ($) - White
Median family income ($) - Black or African American
Median family income ($) - Asian
Median family income ($) - Hispanic or Latino
Median family income ($) - American Indian and Alaska Native
Median family income ($) - Multirace
Median family income ($) - Other Race
Median year house/condo built
Median year apartment built
Year house built - Built 2005 or later (%)
Year house built - Built 2000 to 2004 (%)
Year house built - Built 1990 to 1999 (%)
Year house built - Built 1980 to 1989 (%)
Year house built - Built 1970 to 1979 (%)
Year house built - Built 1960 to 1969 (%)
Year house built - Built 1950 to 1959 (%)
Year house built - Built 1940 to 1949 (%)
Year house built - Built 1939 or earlier (%)
Average household size
Household density (households per square mile)
Average household size - White
Average household size - Black or African American
Average household size - Asian
Average household size - Hispanic or Latino
Average household size - American Indian and Alaska Native
Average household size - Multirace
Average household size - Other Race
Occupied housing units (%)
Vacant housing units (%)
Owner occupied housing units (%)
Renter occupied housing units (%)
Vacancy status - For rent (%)
Vacancy status - For sale only (%)
Vacancy status - Rented or sold, not occupied (%)
Vacancy status - For seasonal, recreational, or occasional use (%)
Vacancy status - For migrant workers (%)
Vacancy status - Other vacant (%)
Residents with income below the poverty level (%)
Residents with income below 50% of the poverty level (%)
Children below poverty level (%)
Poor families by family type - Married-couple family (%)
Poor families by family type - Male, no wife present (%)
Poor families by family type - Female, no husband present (%)
Poverty status for native-born residents (%)
Poverty status for foreign-born residents (%)
Poverty among high school graduates not in families (%)
Poverty among people who did not graduate high school not in families (%)
Residents with income below the poverty level (%) - White
Residents with income below the poverty level (%) - Black or African American
Residents with income below the poverty level (%) - Asian
Residents with income below the poverty level (%) - Hispanic or Latino
Residents with income below the poverty level (%) - American Indian and Alaska Native
Residents with income below the poverty level (%) - Multirace
Residents with income below the poverty level (%) - Other Race
Air pollution - Air Quality Index (AQI)
Air pollution - CO
Air pollution - NO2
Air pollution - SO2
Air pollution - Ozone
Air pollution - PM10
Air pollution - PM25
Air pollution - Pb
Crime - Murders per 100,000 population
Crime - Rapes per 100,000 population
Crime - Robberies per 100,000 population
Crime - Assaults per 100,000 population
Crime - Burglaries per 100,000 population
Crime - Thefts per 100,000 population
Crime - Auto thefts per 100,000 population
Crime - Arson per 100,000 population
Crime - City-data.com crime index
Crime - Violent crime index
Crime - Property crime index
Crime - Murders per 100,000 population (5 year average)
Crime - Rapes per 100,000 population (5 year average)
Crime - Robberies per 100,000 population (5 year average)
Crime - Assaults per 100,000 population (5 year average)
Crime - Burglaries per 100,000 population (5 year average)
Crime - Thefts per 100,000 population (5 year average)
Crime - Auto thefts per 100,000 population (5 year average)
Crime - Arson per 100,000 population (5 year average)
Crime - City-data.com crime index (5 year average)
Crime - Violent crime index (5 year average)
Crime - Property crime index (5 year average)
1996 Presidential Elections Results (%) - Democratic Party (Clinton)
1996 Presidential Elections Results (%) - Republican Party (Dole)
1996 Presidential Elections Results (%) - Other
2000 Presidential Elections Results (%) - Democratic Party (Gore)
2000 Presidential Elections Results (%) - Republican Party (Bush)
2000 Presidential Elections Results (%) - Other
2004 Presidential Elections Results (%) - Democratic Party (Kerry)
2004 Presidential Elections Results (%) - Republican Party (Bush)
2004 Presidential Elections Results (%) - Other
2008 Presidential Elections Results (%) - Democratic Party (Obama)
2008 Presidential Elections Results (%) - Republican Party (McCain)
2008 Presidential Elections Results (%) - Other
2012 Presidential Elections Results (%) - Democratic Party (Obama)
2012 Presidential Elections Results (%) - Republican Party (Romney)
2012 Presidential Elections Results (%) - Other
2016 Presidential Elections Results (%) - Democratic Party (Clinton)
2016 Presidential Elections Results (%) - Republican Party (Trump)
2016 Presidential Elections Results (%) - Other
2020 Presidential Elections Results (%) - Democratic Party (Biden)
2020 Presidential Elections Results (%) - Republican Party (Trump)
2020 Presidential Elections Results (%) - Other
Ancestries Reported - Arab (%)
Ancestries Reported - Czech (%)
Ancestries Reported - Danish (%)
Ancestries Reported - Dutch (%)
Ancestries Reported - English (%)
Ancestries Reported - French (%)
Ancestries Reported - French Canadian (%)
Ancestries Reported - German (%)
Ancestries Reported - Greek (%)
Ancestries Reported - Hungarian (%)
Ancestries Reported - Irish (%)
Ancestries Reported - Italian (%)
Ancestries Reported - Lithuanian (%)
Ancestries Reported - Norwegian (%)
Ancestries Reported - Polish (%)
Ancestries Reported - Portuguese (%)
Ancestries Reported - Russian (%)
Ancestries Reported - Scotch-Irish (%)
Ancestries Reported - Scottish (%)
Ancestries Reported - Slovak (%)
Ancestries Reported - Subsaharan African (%)
Ancestries Reported - Swedish (%)
Ancestries Reported - Swiss (%)
Ancestries Reported - Ukrainian (%)
Ancestries Reported - United States (%)
Ancestries Reported - Welsh (%)
Ancestries Reported - West Indian (%)
Ancestries Reported - Other (%)
Educational Attainment - No schooling completed (%)
Educational Attainment - Less than high school (%)
Educational Attainment - High school or equivalent (%)
Educational Attainment - Less than 1 year of college (%)
Educational Attainment - 1 or more years of college (%)
Educational Attainment - Associate degree (%)
Educational Attainment - Bachelor's degree (%)
Educational Attainment - Master's degree (%)
Educational Attainment - Professional school degree (%)
Educational Attainment - Doctorate degree (%)
School Enrollment - Nursery, preschool (%)
School Enrollment - Kindergarten (%)
School Enrollment - Grade 1 to 4 (%)
School Enrollment - Grade 5 to 8 (%)
School Enrollment - Grade 9 to 12 (%)
School Enrollment - College undergrad (%)
School Enrollment - Graduate or professional (%)
School Enrollment - Not enrolled in school (%)
School enrollment - Public schools (%)
School enrollment - Private schools (%)
School enrollment - Not enrolled (%)
Median number of rooms in houses and condos
Median number of rooms in apartments
Housing units lacking complete plumbing facilities (%)
Housing units lacking complete kitchen facilities (%)
Density of houses
Urban houses (%)
Rural houses (%)
Households with people 60 years and over (%)
Households with people 65 years and over (%)
Households with people 75 years and over (%)
Households with one or more nonrelatives (%)
Households with no nonrelatives (%)
Population in households (%)
Family households (%)
Nonfamily households (%)
Population in families (%)
Family households with own children (%)
Median number of bedrooms in owner occupied houses
Mean number of bedrooms in owner occupied houses
Median number of bedrooms in renter occupied houses
Mean number of bedrooms in renter occupied houses
Median number of vehichles in owner occupied houses
Mean number of vehichles in owner occupied houses
Median number of vehichles in renter occupied houses
Mean number of vehichles in renter occupied houses
Mortgage status - with mortgage (%)
Mortgage status - with second mortgage (%)
Mortgage status - with home equity loan (%)
Mortgage status - with both second mortgage and home equity loan (%)
Mortgage status - without a mortgage (%)
Average family size
Average family size - White
Average family size - Black or African American
Average family size - Asian
Average family size - Hispanic or Latino
Average family size - American Indian and Alaska Native
Average family size - Multirace
Average family size - Other Race
Geographical mobility - Same house 1 year ago (%)
Geographical mobility - Moved within same county (%)
Geographical mobility - Moved from different county within same state (%)
Geographical mobility - Moved from different state (%)
Geographical mobility - Moved from abroad (%)
Place of birth - Born in state of residence (%)
Place of birth - Born in other state (%)
Place of birth - Native, outside of US (%)
Place of birth - Foreign born (%)
Housing units in structures - 1, detached (%)
Housing units in structures - 1, attached (%)
Housing units in structures - 2 (%)
Housing units in structures - 3 or 4 (%)
Housing units in structures - 5 to 9 (%)
Housing units in structures - 10 to 19 (%)
Housing units in structures - 20 to 49 (%)
Housing units in structures - 50 or more (%)
Housing units in structures - Mobile home (%)
Housing units in structures - Boat, RV, van, etc. (%)
House/condo owner moved in on average (years ago)
Renter moved in on average (years ago)
Year householder moved into unit - Moved in 1999 to March 2000 (%)
Year householder moved into unit - Moved in 1995 to 1998 (%)
Year householder moved into unit - Moved in 1990 to 1994 (%)
Year householder moved into unit - Moved in 1980 to 1989 (%)
Year householder moved into unit - Moved in 1970 to 1979 (%)
Year householder moved into unit - Moved in 1969 or earlier (%)
Means of transportation to work - Drove car alone (%)
Means of transportation to work - Carpooled (%)
Means of transportation to work - Public transportation (%)
Means of transportation to work - Bus or trolley bus (%)
Means of transportation to work - Streetcar or trolley car (%)
Means of transportation to work - Subway or elevated (%)
Means of transportation to work - Railroad (%)
Means of transportation to work - Ferryboat (%)
Means of transportation to work - Taxicab (%)
Means of transportation to work - Motorcycle (%)
Means of transportation to work - Bicycle (%)
Means of transportation to work - Walked (%)
Means of transportation to work - Other means (%)
Working at home (%)
Industry diversity
Most Common Industries - Agriculture, forestry, fishing and hunting, and mining (%)
Most Common Industries - Agriculture, forestry, fishing and hunting (%)
Most Common Industries - Mining, quarrying, and oil and gas extraction (%)
Most Common Industries - Construction (%)
Most Common Industries - Manufacturing (%)
Most Common Industries - Wholesale trade (%)
Most Common Industries - Retail trade (%)
Most Common Industries - Transportation and warehousing, and utilities (%)
Most Common Industries - Transportation and warehousing (%)
Most Common Industries - Utilities (%)
Most Common Industries - Information (%)
Most Common Industries - Finance and insurance, and real estate and rental and leasing (%)
Most Common Industries - Finance and insurance (%)
Most Common Industries - Real estate and rental and leasing (%)
Most Common Industries - Professional, scientific, and management, and administrative and waste management services (%)
Most Common Industries - Professional, scientific, and technical services (%)
Most Common Industries - Management of companies and enterprises (%)
Most Common Industries - Administrative and support and waste management services (%)
Most Common Industries - Educational services, and health care and social assistance (%)
Most Common Industries - Educational services (%)
Most Common Industries - Health care and social assistance (%)
Most Common Industries - Arts, entertainment, and recreation, and accommodation and food services (%)
Most Common Industries - Arts, entertainment, and recreation (%)
Most Common Industries - Accommodation and food services (%)
Most Common Industries - Other services, except public administration (%)
Most Common Industries - Public administration (%)
Occupation diversity
Most Common Occupations - Management, business, science, and arts occupations (%)
Most Common Occupations - Management, business, and financial occupations (%)
Most Common Occupations - Management occupations (%)
Most Common Occupations - Business and financial operations occupations (%)
Most Common Occupations - Computer, engineering, and science occupations (%)
Most Common Occupations - Computer and mathematical occupations (%)
Most Common Occupations - Architecture and engineering occupations (%)
Most Common Occupations - Life, physical, and social science occupations (%)
Most Common Occupations - Education, legal, community service, arts, and media occupations (%)
Most Common Occupations - Community and social service occupations (%)
Most Common Occupations - Legal occupations (%)
Most Common Occupations - Education, training, and library occupations (%)
Most Common Occupations - Arts, design, entertainment, sports, and media occupations (%)
Most Common Occupations - Healthcare practitioners and technical occupations (%)
Most Common Occupations - Health diagnosing and treating practitioners and other technical occupations (%)
Most Common Occupations - Health technologists and technicians (%)
Most Common Occupations - Service occupations (%)
Most Common Occupations - Healthcare support occupations (%)
Most Common Occupations - Protective service occupations (%)
Most Common Occupations - Fire fighting and prevention, and other protective service workers including supervisors (%)
Most Common Occupations - Law enforcement workers including supervisors (%)
Most Common Occupations - Food preparation and serving related occupations (%)
Most Common Occupations - Building and grounds cleaning and maintenance occupations (%)
Most Common Occupations - Personal care and service occupations (%)
Most Common Occupations - Sales and office occupations (%)
Most Common Occupations - Sales and related occupations (%)
Most Common Occupations - Office and administrative support occupations (%)
Most Common Occupations - Natural resources, construction, and maintenance occupations (%)
Most Common Occupations - Farming, fishing, and forestry occupations (%)
Most Common Occupations - Construction and extraction occupations (%)
Most Common Occupations - Installation, maintenance, and repair occupations (%)
Most Common Occupations - Production, transportation, and material moving occupations (%)
Most Common Occupations - Production occupations (%)
Most Common Occupations - Transportation occupations (%)
Most Common Occupations - Material moving occupations (%)
People in Group quarters - Institutionalized population (%)
People in Group quarters - Correctional institutions (%)
People in Group quarters - Federal prisons and detention centers (%)
People in Group quarters - Halfway houses (%)
People in Group quarters - Local jails and other confinement facilities (including police lockups) (%)
People in Group quarters - Military disciplinary barracks (%)
People in Group quarters - State prisons (%)
People in Group quarters - Other types of correctional institutions (%)
People in Group quarters - Nursing homes (%)
People in Group quarters - Hospitals/wards, hospices, and schools for the handicapped (%)
People in Group quarters - Hospitals/wards and hospices for chronically ill (%)
People in Group quarters - Hospices or homes for chronically ill (%)
People in Group quarters - Military hospitals or wards for chronically ill (%)
People in Group quarters - Other hospitals or wards for chronically ill (%)
People in Group quarters - Hospitals or wards for drug/alcohol abuse (%)
People in Group quarters - Mental (Psychiatric) hospitals or wards (%)
People in Group quarters - Schools, hospitals, or wards for the mentally retarded (%)
People in Group quarters - Schools, hospitals, or wards for the physically handicapped (%)
People in Group quarters - Institutions for the deaf (%)
People in Group quarters - Institutions for the blind (%)
People in Group quarters - Orthopedic wards and institutions for the physically handicapped (%)
People in Group quarters - Wards in general hospitals for patients who have no usual home elsewhere (%)
People in Group quarters - Wards in military hospitals for patients who have no usual home elsewhere (%)
People in Group quarters - Juvenile institutions (%)
People in Group quarters - Long-term care (%)
People in Group quarters - Homes for abused, dependent, and neglected children (%)
People in Group quarters - Residential treatment centers for emotionally disturbed children (%)
People in Group quarters - Training schools for juvenile delinquents (%)
People in Group quarters - Short-term care, detention or diagnostic centers for delinquent children (%)
People in Group quarters - Type of juvenile institution unknown (%)
People in Group quarters - Noninstitutionalized population (%)
People in Group quarters - College dormitories (includes college quarters off campus) (%)
People in Group quarters - Military quarters (%)
People in Group quarters - On base (%)
People in Group quarters - Barracks, unaccompanied personnel housing (UPH), (Enlisted/Officer), ;and similar group living quarters for military personnel (%)
People in Group quarters - Transient quarters for temporary residents (%)
People in Group quarters - Military ships (%)
People in Group quarters - Group homes (%)
People in Group quarters - Homes or halfway houses for drug/alcohol abuse (%)
People in Group quarters - Homes for the mentally ill (%)
People in Group quarters - Homes for the mentally retarded (%)
People in Group quarters - Homes for the physically handicapped (%)
People in Group quarters - Other group homes (%)
People in Group quarters - Religious group quarters (%)
People in Group quarters - Dormitories (%)
People in Group quarters - Agriculture workers' dormitories on farms (%)
People in Group quarters - Job Corps and vocational training facilities (%)
People in Group quarters - Other workers' dormitories (%)
People in Group quarters - Crews of maritime vessels (%)
People in Group quarters - Other nonhousehold living situations (%)
People in Group quarters - Other noninstitutional group quarters (%)
Residents speaking English at home (%)
Residents speaking English at home - Born in the United States (%)
Residents speaking English at home - Native, born elsewhere (%)
Residents speaking English at home - Foreign born (%)
Residents speaking Spanish at home (%)
Residents speaking Spanish at home - Born in the United States (%)
Residents speaking Spanish at home - Native, born elsewhere (%)
Residents speaking Spanish at home - Foreign born (%)
Residents speaking other language at home (%)
Residents speaking other language at home - Born in the United States (%)
Residents speaking other language at home - Native, born elsewhere (%)
Residents speaking other language at home - Foreign born (%)
Class of Workers - Employee of private company (%)
Class of Workers - Self-employed in own incorporated business (%)
Class of Workers - Private not-for-profit wage and salary workers (%)
Class of Workers - Local government workers (%)
Class of Workers - State government workers (%)
Class of Workers - Federal government workers (%)
Class of Workers - Self-employed workers in own not incorporated business and Unpaid family workers (%)
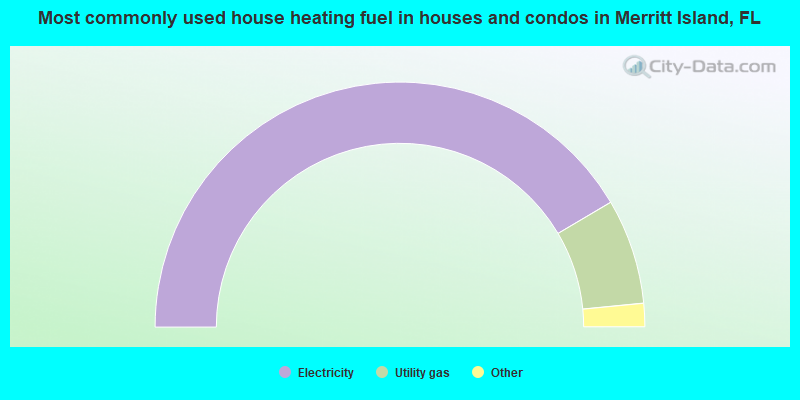
House heating fuel used in houses and condos - Utility gas (%)
House heating fuel used in houses and condos - Bottled, tank, or LP gas (%)
House heating fuel used in houses and condos - Electricity (%)
House heating fuel used in houses and condos - Fuel oil, kerosene, etc. (%)
House heating fuel used in houses and condos - Coal or coke (%)
House heating fuel used in houses and condos - Wood (%)
House heating fuel used in houses and condos - Solar energy (%)
House heating fuel used in houses and condos - Other fuel (%)
House heating fuel used in houses and condos - No fuel used (%)
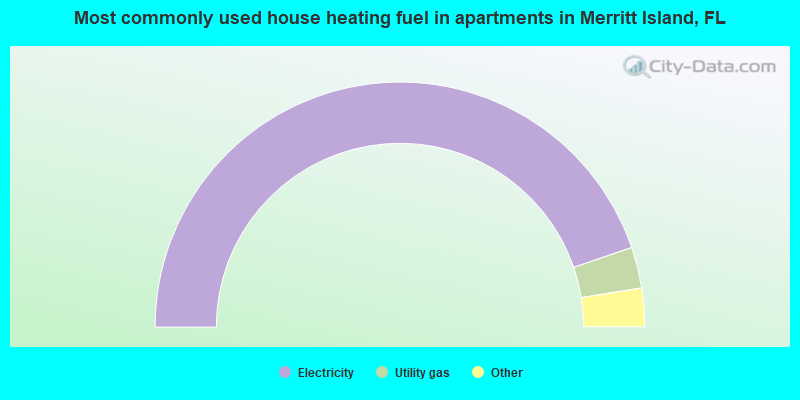
House heating fuel used in apartments - Utility gas (%)
House heating fuel used in apartments - Bottled, tank, or LP gas (%)
House heating fuel used in apartments - Electricity (%)
House heating fuel used in apartments - Fuel oil, kerosene, etc. (%)
House heating fuel used in apartments - Coal or coke (%)
House heating fuel used in apartments - Wood (%)
House heating fuel used in apartments - Solar energy (%)
House heating fuel used in apartments - Other fuel (%)
House heating fuel used in apartments - No fuel used (%)
Armed forces status - In Armed Forces (%)
Armed forces status - Civilian (%)
Armed forces status - Civilian - Veteran (%)
Armed forces status - Civilian - Nonveteran (%)
Fatal accidents locations in years 2005-2021
Fatal accidents locations in 2005
Fatal accidents locations in 2006
Fatal accidents locations in 2007
Fatal accidents locations in 2008
Fatal accidents locations in 2009
Fatal accidents locations in 2010
Fatal accidents locations in 2011
Fatal accidents locations in 2012
Fatal accidents locations in 2013
Fatal accidents locations in 2014
Fatal accidents locations in 2015
Fatal accidents locations in 2016
Fatal accidents locations in 2017
Fatal accidents locations in 2018
Fatal accidents locations in 2019
Fatal accidents locations in 2020
Fatal accidents locations in 2021
Alcohol use - People drinking some alcohol every month (%)
Alcohol use - People not drinking at all (%)
Alcohol use - Average days/month drinking alcohol
Alcohol use - Average drinks/week
Alcohol use - Average days/year people drink much
Audiometry - Average condition of hearing (%)
Audiometry - People that can hear a whisper from across a quiet room (%)
Audiometry - People that can hear normal voice from across a quiet room (%)
Audiometry - Ears ringing, roaring, buzzing (%)
Audiometry - Had a job exposure to loud noise (%)
Audiometry - Had off-work exposure to loud noise (%)
Blood Pressure & Cholesterol - Has high blood pressure (%)
Blood Pressure & Cholesterol - Checking blood pressure at home (%)
Blood Pressure & Cholesterol - Frequently checking blood cholesterol (%)
Blood Pressure & Cholesterol - Has high cholesterol level (%)
Consumer Behavior - Money monthly spent on food at supermarket/grocery store
Consumer Behavior - Money monthly spent on food at other stores
Consumer Behavior - Money monthly spent on eating out
Consumer Behavior - Money monthly spent on carryout/delivered foods
Consumer Behavior - Income spent on food at supermarket/grocery store (%)
Consumer Behavior - Income spent on food at other stores (%)
Consumer Behavior - Income spent on eating out (%)
Consumer Behavior - Income spent on carryout/delivered foods (%)
Current Health Status - General health condition (%)
Current Health Status - Blood donors (%)
Current Health Status - Has blood ever tested for HIV virus (%)
Current Health Status - Left-handed people (%)
Dermatology - People using sunscreen (%)
Diabetes - Diabetics (%)
Diabetes - Had a blood test for high blood sugar (%)
Diabetes - People taking insulin (%)
Diet Behavior & Nutrition - Diet health (%)
Diet Behavior & Nutrition - Milk product consumption (# of products/month)
Diet Behavior & Nutrition - Meals not home prepared (#/week)
Diet Behavior & Nutrition - Meals from fast food or pizza place (#/week)
Diet Behavior & Nutrition - Ready-to-eat foods (#/month)
Diet Behavior & Nutrition - Frozen meals/pizza (#/month)
Drug Use - People that ever used marijuana or hashish (%)
Drug Use - Ever used hard drugs (%)
Drug Use - Ever used any form of cocaine (%)
Drug Use - Ever used heroin (%)
Drug Use - Ever used methamphetamine (%)
Health Insurance - People covered by health insurance (%)
Kidney Conditions-Urology - Avg. # of times urinating at night
Medical Conditions - People with asthma (%)
Medical Conditions - People with anemia (%)
Medical Conditions - People with psoriasis (%)
Medical Conditions - People with overweight (%)
Medical Conditions - Elderly people having difficulties in thinking or remembering (%)
Medical Conditions - People who ever received blood transfusion (%)
Medical Conditions - People having trouble seeing even with glass/contacts (%)
Medical Conditions - People with arthritis (%)
Medical Conditions - People with gout (%)
Medical Conditions - People with congestive heart failure (%)
Medical Conditions - People with coronary heart disease (%)
Medical Conditions - People with angina pectoris (%)
Medical Conditions - People who ever had heart attack (%)
Medical Conditions - People who ever had stroke (%)
Medical Conditions - People with emphysema (%)
Medical Conditions - People with thyroid problem (%)
Medical Conditions - People with chronic bronchitis (%)
Medical Conditions - People with any liver condition (%)
Medical Conditions - People who ever had cancer or malignancy (%)
Mental Health - People who have little interest in doing things (%)
Mental Health - People feeling down, depressed, or hopeless (%)
Mental Health - People who have trouble sleeping or sleeping too much (%)
Mental Health - People feeling tired or having little energy (%)
Mental Health - People with poor appetite or overeating (%)
Mental Health - People feeling bad about themself (%)
Mental Health - People who have trouble concentrating on things (%)
Mental Health - People moving or speaking slowly or too fast (%)
Mental Health - People having thoughts they would be better off dead (%)
Oral Health - Average years since last visit a dentist
Oral Health - People embarrassed because of mouth (%)
Oral Health - People with gum disease (%)
Oral Health - General health of teeth and gums (%)
Oral Health - Average days a week using dental floss/device
Oral Health - Average days a week using mouthwash for dental problem
Oral Health - Average number of teeth
Pesticide Use - Households using pesticides to control insects (%)
Pesticide Use - Households using pesticides to kill weeds (%)
Physical Activity - People doing vigorous-intensity work activities (%)
Physical Activity - People doing moderate-intensity work activities (%)
Physical Activity - People walking or bicycling (%)
Physical Activity - People doing vigorous-intensity recreational activities (%)
Physical Activity - People doing moderate-intensity recreational activities (%)
Physical Activity - Average hours a day doing sedentary activities
Physical Activity - Average hours a day watching TV or videos
Physical Activity - Average hours a day using computer
Physical Functioning - People having limitations keeping them from working (%)
Physical Functioning - People limited in amount of work they can do (%)
Physical Functioning - People that need special equipment to walk (%)
Physical Functioning - People experiencing confusion/memory problems (%)
Physical Functioning - People requiring special healthcare equipment (%)
Prescription Medications - Average number of prescription medicines taking
Preventive Aspirin Use - Adults 40+ taking low-dose aspirin (%)
Reproductive Health - Vaginal deliveries (%)
Reproductive Health - Cesarean deliveries (%)
Reproductive Health - Deliveries resulted in a live birth (%)
Reproductive Health - Pregnancies resulted in a delivery (%)
Reproductive Health - Women breastfeeding newborns (%)
Reproductive Health - Women that had a hysterectomy (%)
Reproductive Health - Women that had both ovaries removed (%)
Reproductive Health - Women that have ever taken birth control pills (%)
Reproductive Health - Women taking birth control pills (%)
Reproductive Health - Women that have ever used Depo-Provera or injectables (%)
Reproductive Health - Women that have ever used female hormones (%)
Sexual Behavior - People 18+ that ever had sex (vaginal, anal, or oral) (%)
Sexual Behavior - Males 18+ that ever had vaginal sex with a woman (%)
Sexual Behavior - Males 18+ that ever performed oral sex on a woman (%)
Sexual Behavior - Males 18+ that ever had anal sex with a woman (%)
Sexual Behavior - Males 18+ that ever had any sex with a man (%)
Sexual Behavior - Females 18+ that ever had vaginal sex with a man (%)
Sexual Behavior - Females 18+ that ever performed oral sex on a man (%)
Sexual Behavior - Females 18+ that ever had anal sex with a man (%)
Sexual Behavior - Females 18+ that ever had any kind of sex with a woman (%)
Sexual Behavior - Average age people first had sex
Sexual Behavior - Average number of female sex partners in lifetime (males 18+)
Sexual Behavior - Average number of female vaginal sex partners in lifetime (males 18+)
Sexual Behavior - Average age people first performed oral sex on a woman (18+)
Sexual Behavior - Average number of woman performed oral sex on in lifetime (18+)
Sexual Behavior - Average number of male sex partners in lifetime (males 18+)
Sexual Behavior - Average number of male anal sex partners in lifetime (males 18+)
Sexual Behavior - Average age people first performed oral sex on a man (18+)
Sexual Behavior - Average number of male oral sex partners in lifetime (18+)
Sexual Behavior - People using protection when performing oral sex (%)
Sexual Behavior - Average number of times people have vaginal or anal sex a year
Sexual Behavior - People having sex without condom (%)
Sexual Behavior - Average number of male sex partners in lifetime (females 18+)
Sexual Behavior - Average number of male vaginal sex partners in lifetime (females 18+)
Sexual Behavior - Average number of female sex partners in lifetime (females 18+)
Sexual Behavior - Circumcised males 18+ (%)
Sleep Disorders - Average hours sleeping at night
Sleep Disorders - People that has trouble sleeping (%)
Smoking-Cigarette Use - People smoking cigarettes (%)
Taste & Smell - People 40+ having problems with smell (%)
Taste & Smell - People 40+ having problems with taste (%)
Taste & Smell - People 40+ that ever had wisdom teeth removed (%)
Taste & Smell - People 40+ that ever had tonsils teeth removed (%)
Taste & Smell - People 40+ that ever had a loss of consciousness because of a head injury (%)
Taste & Smell - People 40+ that ever had a broken nose or other serious injury to face or skull (%)
Taste & Smell - People 40+ that ever had two or more sinus infections (%)
Weight - Average height (inches)
Weight - Average weight (pounds)
Weight - Average BMI
Weight - People that are obese (%)
Weight - People that ever were obese (%)
Weight - People trying to lose weight (%)
Latest news from Merritt Island, FL collected exclusively by city-data.com from local newspapers, TV, and radio stations
Ancestries: English (14.7%), German (11.6%), Irish (10.7%), American (9.2%), Italian (7.0%), European (3.9%).
Current Local Time:
Land area: 17.7 square miles.
Population density: 1,968 people per square mile (low).
2,572 residents are foreign born (2.7% Asia , 2.2% Latin America , 1.7% Europe ).
This place:
7.3%Florida:
21.1%
Median real estate property taxes paid for housing units with mortgages in 2022: $2,838 (0.6%)Median real estate property taxes paid for housing units with no mortgage in 2022: $2,340 (0.6%)
Nearest city with pop. 50,000+: Melbourne, FL
Nearest city with pop. 200,000+: Tampa, FL
Nearest city with pop. 1,000,000+: Philadelphia, PA
Nearest cities:
Latitude: 28.36 N, Longitude: 80.68 W
Daytime population change due to commuting: -1,490 (-4.2%)Workers who live and work in this place: 5,860 (35.5%)
Area code commonly used in this area: 321
Property values in Merritt Island, FL
Merritt Island tourist attractions:
Unemployment in December 2023:
Most common occupations in Merritt Island, FL (%)
Both Males Females
Engineers (5.5%)
Other management occupations, except farmers and farm managers (5.2%)
Other sales and related occupations, including supervisors (4.2%)
Retail sales workers, except cashiers (3.4%)
Preschool, kindergarten, elementary, and middle school teachers (3.3%)
Other office and administrative support workers, including supervisors (3.3%)
Computer specialists (3.2%)
Engineers (8.9%)
Other management occupations, except farmers and farm managers (6.1%)
Computer specialists (4.7%)
Other sales and related occupations, including supervisors (4.1%)
Other production occupations, including supervisors (3.7%)
Electrical equipment mechanics and other installation, maintenance, and repair workers, including supervisors (3.4%)
Sales representatives, services, wholesale and manufacturing (3.4%)
Preschool, kindergarten, elementary, and middle school teachers (6.1%)
Other office and administrative support workers, including supervisors (5.5%)
Secretaries and administrative assistants (5.3%)
Retail sales workers, except cashiers (4.9%)
Other sales and related occupations, including supervisors (4.3%)
Information and record clerks, except customer service representatives (4.2%)
Other management occupations, except farmers and farm managers (4.1%)
Tornado activity:
Merritt Island-area historical tornado activity is near Florida state average. It is 0% greater than the overall U.S. average.
On 4/4/1966, a category F4 (max. wind speeds 207-260 mph) tornado 5.1 miles away from the Merritt Island place center killed 11 people and injured 530 people and caused between $5,000,000 and $50,000,000 in damages.
On 6/19/1972, a category F3 (max. wind speeds 158-206 mph) tornado 1.2 miles away from the place center caused between $500,000 and $5,000,000 in damages.
Earthquake activity:
Merritt Island-area historical earthquake activity is significantly above Florida state average. It is 90% smaller than the overall U.S. average. On 9/10/2006 at 14:56:08, a magnitude 5.9 (5.9 MB, 5.5 MS, 5.8 MW, Class: Moderate, Intensity: VI - VII) earthquake occurred 393.3 miles away from the city center On 6/23/2016 at 17:20:29, a magnitude 3.8 (3.8 ML, Class: Light, Intensity: II - III) earthquake occurred 135.6 miles away from Merritt Island center On 9/21/2016 at 16:30:52, a magnitude 3.8 (3.8 ML) earthquake occurred 138.5 miles away from Merritt Island center On 9/4/2016 at 18:29:29, a magnitude 3.8 (3.8 ML) earthquake occurred 138.6 miles away from the city center On 7/16/2016 at 20:00:10, a magnitude 3.7 (3.7 MB) earthquake occurred 123.2 miles away from Merritt Island center On 6/10/2016 at 17:10:48, a magnitude 3.7 (3.7 MB) earthquake occurred 131.9 miles away from the city center Magnitude types: body-wave magnitude (MB), local magnitude (ML), surface-wave magnitude (MS), moment magnitude (MW) Natural disasters: The number of natural disasters in Brevard County (27) is a lot greater than the US average (15).Major Disasters (Presidential) Declared: 14Emergencies Declared: 6Hurricanes: 15, Fires: 6, Tropical Storms: 5, Tornadoes: 2, Flood: 1, Heavy Rain: 1, Other: 1 (Note: some incidents may be assigned to more than one category). Main business address for: iWorld Projects & Systems, Inc. [9995] ).
Hospitals and medical centers in Merritt Island: COURTENAY SPRINGS VILLAGE (1100 S COURTENAY PARKWAY)
HEALTH CENTER OF MERRITT ISLAND, THE (500 CROCKETT BLVD)
ISLAND HEALTH AND REHABILITATION CENTER (125 ALMA BLVD)
RAI-S COURTENAY-MERRITT ISLAND (245 S COURTENAY PKWY BLDG A)
HEALTH FIRST HOME CARE (200 S COURTENAY PKWY)
NHC HOMECARE (2395 N COURTENAY PKWY SUITE 101)
TENDER TOUCH HEALTH CARE (1365 N COURTENAY PKWY STE B)
College/University in Merritt Island: Academy of Cosmetology Full-time enrollment: 335; Location: 2088 N. Courtenay Parkway; Private, for-profit; Website: FLORIDACOSMETOLOGYSCHOOLS.COM)
Colleges/universities with over 2000 students nearest to Merritt Island:
Eastern Florida State College (about 5 miles; Cocoa, FL ; Full-time enrollment: 12,053)
Florida Institute of Technology (about 21 miles; Melbourne, FL ; FT enrollment: 4,452)
Florida Institute of Technology-Online (about 21 miles; Melbourne, FL ; FT enrollment: 3,046)
Florida Technical College (about 35 miles; Orlando, FL ; FT enrollment: 4,907)
University of Central Florida (about 36 miles; Orlando, FL ; FT enrollment: 51,457)
Full Sail University (about 41 miles; Winter Park, FL ; FT enrollment: 31,435)
Rollins College (about 44 miles; Winter Park, FL ; FT enrollment: 3,085)
Public high schools in Merritt Island: MERRITT ISLAND HIGH SCHOOL Location: 100 MUSTANG WAY, Grades: PK-12)
EDGEWOOD JR/SR HIGH SCHOOL Location: 180 E MERRITT AVE, Grades: 7-12)
Private high schools in Merritt Island: MERRITT ISLAND CHRISTIAN SCHOOL Students: 475, Location: 140 MAGNOLIA AVE, Grades: PK-12)
EDUCATORS INC PRIVATE CHRISTIAN SCHOOL Students: 325, Location: 777 E MERRITT ISLAND CSWY, Grades: KG-12)
EDUCATERS INC PRIVATE CHRISTIAN SCHOOL Students: 205, Location: 55 MCLEOD ST, Grades: UG-12)
BREVARD PRIVATE ACADEMY Students: 89, Location: 508 S PLUMOSA ST STE C, Grades: 8-12)
KLD LEARNING CENTER Students: 77, Location: 85 RICHLAND AVE, Grades: KG-12)
LIGHTHOUSE CHRISTIAN ACADEMY Students: 39, Location: 1250 NORTH BANANA RIVER DRIVE, Grades: 2-12)
FLORIDA LEARNING ACADEMY PRIVATE SCHOOL Students: 25, Location: 460 ROBBIN HOOD DR, Grades: 5-12)
CHRISTIAN PREPARATORY LEARNING CENTER Students: 13, Location: 230 E MERRITT ISLAND CAUSEWAY SUITE 106, Grades: 4-12)
Public elementary/middle schools in Merritt Island: MILA ELEMENTARY SCHOOL Location: 288 W MERRITT AVE, Grades: PK-6)
TROPICAL ELEMENTARY SCHOOL Location: 885 S COURTENAY PKWY, Grades: PK-6)
AUDUBON ELEMENTARY SCHOOL Location: 1201 N BANANA RIVER DR, Grades: PK-6)
THOMAS JEFFERSON MIDDLE SCHOOL Location: 1275 S COURTENAY PKWY, Grades: 7-8)
LEWIS CARROLL ELEMENTARY SCHOOL Location: 1 SKYLINE BLVD, Grades: PK-6)
ROBERT L. STEVENSON ELEMENTARY Location: 1450 MARTIN BLVD, Grades: KG-6)
Private elementary/middle schools in Merritt Island: DIVINE MERCY CATHOLIC ACADEMY Students: 195, Location: 1940 N COURTENAY PKWY, Grades: PK-8)
CALVARY CHAPEL CHRISTIAN SCHOOL Students: 39, Location: 3500 N COURTENAY PKWY, Grades: PK-1)
ALPHA ACADEMY Students: 22, Location: 3700 N COURTENAY PKWY STE 102, Grades: UG-3)
Notable locations in Merritt Island: (A) , Newfound Harbor Plaza (B) , Merritt Island Public Library (C) , Merritt Island Volunteer Fire Department (D) , Brevard County Fire Rescue Station 42 (E) , Brevard County Fire Rescue Station 43 (F) , Brevard County Fire Rescue Station 41 (G) . Display/hide their locations on the map
Shopping Centers: (1) , Merritt Square Mall (2) . Display/hide their locations on the map
Churches in Merritt Island include: (A) , Mount Zion Church (B) , Mount Tabor Church (C) , Universal Healing Center and Chapel (D) , Redeemer Lutheran Church (E) , Merritt Island Wesleyan Church (F) , Merritt Island Presbyterian Church (G) , Merritt Island Church of Christ (H) , Lighthouse Christian Church (I) . Display/hide their locations on the map
Lake: (A) . Display/hide its location on the map
Creek: (A) . Display/hide its location on the map
Park in Merritt Island: (1) . Display/hide its location on the map
Tourist attractions: (1) , Combat Zone (Amusement & Theme Parks; 785 North Courtenay Parkway) (2) . Display/hide their approximate locations on the map
Hotels: (1) , Clarion Hotel Merritt Island (260 East Merritt Island Causeway) (2) , Clarion Hotel Kennedy Space Center Area (260 East Merritt Island Causeway) (3) . Display/hide their approximate locations on the map
Birthplace of: Eric Rudolph - Far-right radical, Scott Gump - PGA Tour Golf player (born : 12/17/65), Scott Turner - Busch series NASCAR driver (born : Merritt Island, FL), Travis Kittleson - Busch series NASCAR driver (born : Dec 21, 1979), De'Audra Dix - Player of and football, Derrick Ham - Football player, Keith Notary - Sailor.
Brevard County has a predicted average indoor radon screening level less than 2 pCi/L (pico curies per liter) - Low Potential Average household size: This place:
2.3 peopleFlorida:
2.5 people
Percentage of family households: This place:
65.7%Whole state:
65.2%
Percentage of households with unmarried partners: This place:
6.5%Whole state:
7.3%
Likely homosexual households (counted as self-reported same-sex unmarried-partner households)
Lesbian couples: 0.3% of all households Gay men: 0.3% of all households
People in group quarters in Merritt Island in 2010:
351 people in nursing facilities/skilled-nursing facilities
11 people in group homes intended for adults
4 people in workers' group living quarters and job corps centers
People in group quarters in Merritt Island in 2000:
382 people in nursing homes
277 people in other noninstitutional group quarters
68 people in hospitals/wards and hospices for chronically ill
68 people in other hospitals or wards for chronically ill
8 people in orthopedic wards and institutions for the physically handicapped
6 people in homes for the mentally retarded
4 people in religious group quarters
Banks with most branches in Merritt Island (2011 data):
Wells Fargo Bank, National Association: Merritt Island Branch at 100 S Sykes Creek Parkway, branch established on 1978/02/11; 1350 North Courtenay Parkway Branch at 1350 North Courtenay Parkway, branch established on 1970/09/25. Info updated 2011/04/05: Bank assets: $1,161,490.0 mil, Deposits: $905,653.0 mil, headquarters in Sioux Falls, SD, positive income , 6395 total offices , Holding Company: Wells Fargo & Company
Bank of America, National Association: Merritt Island Branch at 15 East Merritt Island Causeway, branch established on 1963/06/07. Info updated 2009/11/18: Bank assets: $1,451,969.3 mil, Deposits: $1,077,176.8 mil, headquarters in Charlotte, NC, positive income , 5782 total offices , Holding Company: Bank Of America Corporation
Community Bank of the South: Community Bank Of The South at 277 North Sykes Creek Parkway, branch established on 1999/11/29. Info updated 2006/11/03: Bank assets: $122.9 mil, Deposits: $99.4 mil, local headquarters , positive income , Commercial Lending Specialization, 3 total offices , Holding Company: Cbos Bankshares, Inc.
PNC Bank, National Association: Merritt Island Branch at 1840 North Courtenay Parkway, branch established on 2004/06/21. Info updated 2012/03/20: Bank assets: $263,309.6 mil, Deposits: $197,343.0 mil, headquarters in Wilmington, DE, positive income , Commercial Lending Specialization, 3085 total offices , Holding Company: Pnc Financial Services Group, Inc., The
JPMorgan Chase Bank, National Association: 760 E Merritt Isl Cswy Branch at 760 East Merritt Island Causeway, branch established on 1934/07/01. Info updated 2011/11/10: Bank assets: $1,811,678.0 mil, Deposits: $1,190,738.0 mil, headquarters in Columbus, OH, positive income , International Specialization, 5577 total offices , Holding Company: Jpmorgan Chase & Co.
TD Bank, National Association: Merritt Island Branch at 250 Merritt Island Causeway, branch established on 1998/12/28. Info updated 2010/10/04: Bank assets: $188,912.6 mil, Deposits: $153,149.8 mil, headquarters in Wilmington, DE, positive income , 1314 total offices , Holding Company: Toronto-Dominion Bank, The
Regions Bank: Merritt Island Branch at 324 Merritt Island Causeway East, branch established on 2006/10/30. Info updated 2011/02/24: Bank assets: $123,368.2 mil, Deposits: $98,301.3 mil, headquarters in Birmingham, AL, positive income , Commercial Lending Specialization, 1778 total offices , Holding Company: Regions Financial Corporation
SunTrust Bank: Merritt Island Branch at 775 East Merritt Square Island Causeway, branch established on 1988/08/01. Info updated 2010/05/27: Bank assets: $171,291.7 mil, Deposits: $129,833.2 mil, headquarters in Atlanta, GA, positive income , Commercial Lending Specialization, 1716 total offices , Holding Company: Suntrust Banks, Inc.
Florida Bank of Commerce: Merritt Island Branch at 291 North Courtenay Parkway, branch established on 2007/05/14. Info updated 2010/06/04: Bank assets: $228.2 mil, Deposits: $201.3 mil, headquarters in Orlando, FL, positive income , Commercial Lending Specialization, 6 total offices , Holding Company: Fbc Bancorp, Inc.
2 other banks with 2 local branches
For population 15 years and over in Merritt Island:
Never married: 23.8%Now married: 54.8%Separated: 1.0%Widowed: 7.1%Divorced: 13.4% For population 25 years and over in Merritt Island:
High school or higher: 96.0%Bachelor's degree or higher: 41.5%Graduate or professional degree: 16.5%Unemployed: 5.0%Mean travel time to work (commute): 20.5 minutes
Education Gini index (Inequality in education) Here:
9.9Florida average:
12.2
Religion statistics for Merritt Island, FL (based on Brevard County data)
Religion Adherents Congregations Evangelical Protestant 75,893 265 Catholic 64,831 14 Mainline Protestant 30,877 64 Other 11,113 41 Black Protestant 5,449 25 Orthodox 1,267 5 None 353,946 -
Source: Clifford Grammich, Kirk Hadaway, Richard Houseal, Dale E.Jones, Alexei Krindatch, Richie Stanley and Richard H.Taylor. 2012. 2010 U.S.Religion Census: Religious Congregations & Membership Study. Association of Statisticians of American Religious Bodies. Jones, Dale E., et al. 2002. Congregations and Membership in the United States 2000. Nashville, TN: Glenmary Research Center. Graphs represent county-level data
Food Environment Statistics: Number of grocery stores : 81Brevard County :
1.51 / 10,000 pop.Florida :
2.04 / 10,000 pop.
Number of supercenters and club stores : 9Brevard County :
0.17 / 10,000 pop.Florida :
0.11 / 10,000 pop.
Number of convenience stores (no gas) : 75Brevard County :
1.40 / 10,000 pop.State :
1.28 / 10,000 pop.
Number of convenience stores (with gas) : 186Brevard County :
3.48 / 10,000 pop.Florida :
3.04 / 10,000 pop.
Number of full-service restaurants : 407Brevard County :
7.61 / 10,000 pop.Florida :
7.45 / 10,000 pop.
Adult diabetes rate : Brevard County :
10.3%Florida :
9.2%
Adult obesity rate : Brevard County :
23.3%Florida :
23.7%
Low-income preschool obesity rate : Brevard County :
9.0%Florida :
14.0%
Health and Nutrition: Healthy diet rate : Merritt Island:
54.3%Florida:
51.4%
Average overall health of teeth and gums : People feeling badly about themselves : Merritt Island:
19.9%State:
19.5%
People not drinking alcohol at all : Average hours sleeping at night : Merritt Island:
6.9Florida:
6.9
Overweight people : Merritt Island:
35.8%State:
34.7%
General health condition : Merritt Island:
59.4%Florida:
57.0%
Average condition of hearing : Merritt Island:
78.5%State:
79.2%
More about Health and Nutrition of Merritt Island, FL Residents
7.86% of this county's 2021 resident taxpayers lived in other counties in 2020 ($76,050 average adjusted gross income )
Here:
7.86%Florida average:
8.80%
0.06% of residents moved from foreign countries ($493 average AGI )Brevard County:
0.06%Florida average:
0.05%
Top counties from which taxpayers relocated into this county between 2020 and 2021:
5.62% of this county's 2020 resident taxpayers moved to other counties in 2021 ($62,226 average adjusted gross income )
Here:
5.62%Florida average:
7.45%
0.05% of residents moved to foreign countries ($434 average AGI )Brevard County:
0.05%Florida average:
0.04%
Top counties to which taxpayers relocated from this county between 2020 and 2021:
Businesses in Merritt Island, FL
Name Count Name Count
7-Eleven 4 McDonald's 1 ALDI 1 Motherhood Maternity 1 AT&T 2 Nike 4 Ace Hardware 1 Nissan 1 Advance Auto Parts 1 Office Depot 1 Aeropostale 1 Olive Garden 1 Applebee's 1 Outback 1 Arby's 1 Outback Steakhouse 1 AutoZone 1 Pac Sun 1 Barnes & Noble 1 Papa John's Pizza 1 Bath & Body Works 1 Payless 1 Burger King 2 Pier 1 Imports 1 CVS 2 Pizza Hut 1 Chick-Fil-A 1 Popeyes 1 Circle K 2 Publix Super Markets 2 Clarion 1 RadioShack 1 Cold Stone Creamery 1 Red Lobster 1 Curves 1 Ruby Tuesday 1 Dairy Queen 1 Rue21 1 Dennys 1 Spencer Gifts 1 Domino's Pizza 1 Sprint Nextel 2 Dunkin Donuts 1 Starbucks 1 Fashion Bug 1 Steak 'n Shake 1 FedEx 6 T-Mobile 1 Finish Line 1 T.G.I. Driday's 1 Firestone Complete Auto Care 1 T.J.Maxx 1 Foot Locker 1 Taco Bell 1 GNC 1 Target 1 GameStop 1 Tire Kingdom 1 H&R Block 3 Toyota 1 Home Depot 1 Toys"R"Us 2 Hot Topic 1 U-Haul 2 JCPenney 1 UPS 11 Jones New York 4 Vans 3 Journeys 1 Verizon Wireless 3 LensCrafters 1 Victoria's Secret 1 Long John Silver's 1 Walgreens 2 Macy's 1 Walmart 1 MasterBrand Cabinets 2 Wendy's 1
Strongest AM radio stations in Merritt Island:
WTIR (1300 AM; 5 kW; COCOA BEACH, FL; Owner: RAMA COMMUNICATIONS, INC.)
WIXC (1060 AM; 50 kW; TITUSVILLE, FL; Owner: GENESIS COMMUNICATIONS I, INC.)
WMMV (1350 AM; 1 kW; COCOA, FL)
WONQ (1030 AM; 45 kW; OVIEDO, FL; Owner: FLORIDA BROADCASTERS)
WMEL (920 AM; 5 kW; MELBOURNE, FL; Owner: TWIN TOWERS BROADCASTING INC.)
WWBC (1510 AM; daytime; 1 kW; COCOA, FL; Owner: ASTRO ENTERPRISES, INC.)
WHOO (1080 AM; daytime; 35 kW; KISSIMMEE, FL; Owner: GENESIS COMMUNICATIONS I, INC.)
WDYZ (990 AM; 50 kW; ORLANDO, FL; Owner: ABC, INC.)
WFLF (540 AM; 50 kW; PINE HILLS, FL; Owner: CLEAR CHANNEL BROADCASTING LICENSES, INC.)
WQTM (740 AM; 50 kW; ORLANDO, FL; Owner: CLEAR CHANNEL BROADCASTING LICENSES, INC.)
WINT (1560 AM; daytime; 5 kW; MELBOURNE, FL; Owner: CUMULUS LICENSING CORP.)
WTLN (950 AM; 12 kW; ORLANDO, FL; Owner: TM2, INC.)
WQYK (1010 AM; 50 kW; SEFFNER, FL; Owner: INFINITY BROADCASTING CORPORATION OF TAMPA)
Strongest FM radio stations in Merritt Island:
WHKR (102.7 FM; ROCKLEDGE, FL; Owner: CUMULUS LICENSING CORP.)
WLRQ-FM (99.3 FM; COCOA, FL; Owner: CAPSTAR TX LIMITED PARTNERSHIP)
WAOA-FM (107.1 FM; MELBOURNE, FL; Owner: CUMULUS LICENSING CORP.)
WHTQ (96.5 FM; ORLANDO, FL; Owner: COX RADIO, INC.)
WWKA (92.3 FM; ORLANDO, FL; Owner: COX RADIO, INC.)
WJRR (101.1 FM; COCOA BEACH, FL; Owner: CLEAR CHANNEL BROADCASTING LICENSES, INC.)
WSHE (100.3 FM; ORLANDO, FL; Owner: CLEAR CHANNEL BROADCASTING LICENSES, INC.)
WTKS-FM (104.1 FM; COCOA BEACH, FL; Owner: CLEAR CHANNEL BROADCASTING LICENSES, INC.)
WOMX-FM (105.1 FM; ORLANDO, FL; Owner: INFINITY RADIO OPERATIONS INC.)
WMIE-FM (91.5 FM; COCOA, FL; Owner: NATIONAL CHRISTIAN NETWORK)
WPOZ (88.3 FM; UNION PARK, FL; Owner: CENTRAL FLORIDA EDUCATIONAL FOUNDATION, INC.)
WCIF (106.3 FM; MELBOURNE, FL; Owner: FIRST BAPTIST CHURCH, INC.)
W253AG (98.5 FM; COCOA, FL; Owner: CENTRAL EDUCATIONAL BROADCASTING, INC.)
WMFE-FM (90.7 FM; ORLANDO, FL; Owner: COMMUNITY COMMUNICATIONS, INC.)
WMGF (107.7 FM; MOUNT DORA, FL; Owner: CLEAR CHANNEL BROADCASTING LICENSES, INC.)
WOCL (105.9 FM; DELAND, FL; Owner: INFINITY RADIO OPERATIONS INC.)
WPIO (89.3 FM; TITUSVILLE, FL; Owner: FLORIDA PUBLIC RADIO, INC.)
WEJF (90.3 FM; PALM BAY, FL; Owner: FLORIDA PUBLIC RADIO, INC.)
WBVD (95.1 FM; MELBOURNE, FL; Owner: CAPSTAR TX LIMITED PARTNERSHIP)
W230AL (93.9 FM; COCOA, FL; Owner: BLACK MEDIA WORKS, INC.)
TV broadcast stations around Merritt Island:
WTGL-TV (Channel 52; COCOA, FL; Owner: GOOD LIFE BROADCASTING, INC.)
WBCC (Channel 68; COCOA, FL; Owner: BREVARD COMMUNITY COLLEGE)
WRDQ (Channel 27; ORLANDO, FL; Owner: WFTV-TV HOLDINGS, INC.)
W04CN (Channel 4; COCOA, ETC., FL; Owner: EMMIS TELEVISION LICENSE CORPORATION)
WOTF (Channel 43; MELBOURNE, FL; Owner: TELEFUTURA ORLANDO, INC.)
WFTV (Channel 9; ORLANDO, FL; Owner: WFTV-TV HOLDINGS, INC.)
W46DB (Channel 46; MELBOURNE, FL; Owner: ENTRAVISION HOLDINGS, LLC)
WACX (Channel 55; LEESBURG, FL; Owner: ASSOCIATED CHRISTIAN TELEVISION SYSTEM, INC.)
WKCF (Channel 18; CLERMONT, FL; Owner: EMMIS TELEVISION LICENSE CORPORATION)
WLCB-TV (Channel 45; LEESBURG, FL; Owner: GOOD LIFE BROADCASTING, INC.)
WRBW (Channel 65; ORLANDO, FL; Owner: FOX TELEVISION STATIONS, INC.)
WKMG-TV (Channel 6; ORLANDO, FL; Owner: POST-NEWSWEEK STATIONS ORLANDO, INC.)
WOFL (Channel 35; ORLANDO, FL; Owner: FOX TELEVISION STATIONS, INC.)
WOPX (Channel 56; MELBOURNE, FL; Owner: PAXSON ORLANDO LICENSE, INC.)
WZXZ-CA (Channel 11; ORLANDO, ETC., FL; Owner: THE BOX WORLDWIDE LLC)
WMFE-TV (Channel 24; ORLANDO, FL; Owner: COMMUNITY COMMUNICATIONS, INC.)
WMVJ-LP (Channel 29; MELBOURNE, FL; Owner: TIGER EYE BROADCASTING CORPORATION)
W26BN (Channel 26; MELBOURNE, FL; Owner: WIRELESS BROADBAND SERVICES/AMERICA)
W59CX (Channel 59; MELBOURNE, FL; Owner: THREE ANGELS BROADCASTING NETWORK, INC.)
WESH (Channel 2; DAYTONA BEACH, FL; Owner: ORLANDO HEARST-ARGYLE TELEVISION, INC.)
WXXU-LP (Channel 12; ALTAMONTE SPRINGS, FL; Owner: RAMA COMMUNICATIONS)
WSCF-LP (Channel 31; MELBOURNE, FL; Owner: JAMES J. CHLADEK)
Home Mortgage Disclosure Act Aggregated Statistics For Year 2009(Based on 10 full tracts) A) FHA, FSA/RHS & VA B) Conventional C) Refinancings D) Home Improvement Loans F) Non-occupant Loans on G) Loans On Manufactured Number Average Value Number Average Value Number Average Value Number Average Value Number Average Value Number Average Value
LOANS ORIGINATED 141 $174,025 180 $213,576 450 $197,366 22 $212,154 74 $173,001 1 $81,000 APPLICATIONS APPROVED, NOT ACCEPTED 12 $182,574 19 $200,688 41 $185,939 4 $12,378 7 $144,857 1 $79,000 APPLICATIONS DENIED 20 $152,686 38 $197,348 220 $251,069 22 $104,727 37 $186,317 3 $42,000 APPLICATIONS WITHDRAWN 10 $171,306 32 $225,774 134 $190,390 9 $117,100 17 $164,748 0 $0 FILES CLOSED FOR INCOMPLETENESS 4 $135,060 7 $321,710 32 $240,687 2 $212,195 0 $0 0 $0
Aggregated Statistics For Year 2008(Based on 10 full tracts) A) FHA, FSA/RHS & VA B) Conventional C) Refinancings D) Home Improvement Loans F) Non-occupant Loans on G) Loans On Manufactured Number Average Value Number Average Value Number Average Value Number Average Value Number Average Value Number Average Value
LOANS ORIGINATED 96 $176,730 263 $235,312 281 $185,230 32 $75,200 116 $171,304 0 $0 APPLICATIONS APPROVED, NOT ACCEPTED 6 $201,317 74 $196,784 66 $227,675 13 $64,865 52 $171,949 1 $30,000 APPLICATIONS DENIED 19 $171,858 73 $189,354 200 $217,061 48 $71,131 66 $182,089 4 $75,800 APPLICATIONS WITHDRAWN 10 $177,617 40 $266,716 87 $221,359 7 $82,714 27 $237,056 0 $0 FILES CLOSED FOR INCOMPLETENESS 3 $245,267 23 $173,605 33 $221,970 2 $57,290 15 $259,630 0 $0
Aggregated Statistics For Year 2007(Based on 10 full tracts) A) FHA, FSA/RHS & VA B) Conventional C) Refinancings D) Home Improvement Loans E) Loans on Dwellings For 5+ Families F) Non-occupant Loans on G) Loans On Manufactured Number Average Value Number Average Value Number Average Value Number Average Value Number Average Value Number Average Value Number Average Value
LOANS ORIGINATED 111 $189,164 555 $214,214 586 $214,191 90 $88,916 0 $0 269 $180,792 5 $86,618 APPLICATIONS APPROVED, NOT ACCEPTED 0 $0 106 $201,832 165 $191,530 27 $85,284 0 $0 64 $213,131 1 $26,150 APPLICATIONS DENIED 21 $169,902 260 $199,358 403 $245,785 87 $110,101 0 $0 194 $194,741 6 $31,637 APPLICATIONS WITHDRAWN 5 $155,910 75 $217,001 196 $240,846 20 $154,446 0 $0 44 $173,966 0 $0 FILES CLOSED FOR INCOMPLETENESS 0 $0 26 $237,937 76 $230,912 3 $92,253 1 $45,000 15 $211,509 0 $0
Aggregated Statistics For Year 2006(Based on 10 full tracts) A) FHA, FSA/RHS & VA B) Conventional C) Refinancings D) Home Improvement Loans E) Loans on Dwellings For 5+ Families F) Non-occupant Loans on G) Loans On Manufactured Number Average Value Number Average Value Number Average Value Number Average Value Number Average Value Number Average Value Number Average Value
LOANS ORIGINATED 18 $187,962 651 $238,028 1,035 $208,532 131 $114,383 1 $4,794,570 288 $210,784 3 $67,333 APPLICATIONS APPROVED, NOT ACCEPTED 1 $111,000 118 $245,781 203 $197,306 33 $75,261 0 $0 49 $195,745 4 $52,742 APPLICATIONS DENIED 3 $159,357 175 $232,322 395 $202,597 66 $112,858 0 $0 89 $192,890 8 $53,094 APPLICATIONS WITHDRAWN 2 $274,550 96 $236,764 396 $189,110 24 $106,164 2 $6,372,020 50 $186,263 0 $0 FILES CLOSED FOR INCOMPLETENESS 0 $0 12 $217,622 93 $176,776 9 $102,000 0 $0 12 $139,693 0 $0
Aggregated Statistics For Year 2005(Based on 10 full tracts) A) FHA, FSA/RHS & VA B) Conventional C) Refinancings D) Home Improvement Loans E) Loans on Dwellings For 5+ Families F) Non-occupant Loans on G) Loans On Manufactured Number Average Value Number Average Value Number Average Value Number Average Value Number Average Value Number Average Value Number Average Value
LOANS ORIGINATED 15 $197,234 1,149 $227,335 1,160 $187,978 128 $120,475 1 $2,973,000 498 $194,098 3 $108,667 APPLICATIONS APPROVED, NOT ACCEPTED 1 $169,000 106 $198,290 146 $168,897 26 $86,618 0 $0 46 $153,188 3 $39,667 APPLICATIONS DENIED 1 $102,000 185 $208,200 404 $182,883 89 $83,143 2 $172,500 82 $170,213 11 $50,182 APPLICATIONS WITHDRAWN 5 $157,126 136 $218,272 423 $172,074 52 $150,644 0 $0 54 $169,830 0 $0 FILES CLOSED FOR INCOMPLETENESS 0 $0 29 $376,244 84 $189,745 9 $77,346 0 $0 8 $193,431 0 $0
Aggregated Statistics For Year 2004(Based on 10 full tracts) A) FHA, FSA/RHS & VA B) Conventional C) Refinancings D) Home Improvement Loans E) Loans on Dwellings For 5+ Families F) Non-occupant Loans on G) Loans On Manufactured Number Average Value Number Average Value Number Average Value Number Average Value Number Average Value Number Average Value Number Average Value
LOANS ORIGINATED 37 $139,492 905 $207,928 1,048 $156,483 108 $110,910 6 $2,516,667 260 $170,309 8 $51,125 APPLICATIONS APPROVED, NOT ACCEPTED 3 $176,853 80 $226,512 173 $141,959 29 $103,914 0 $0 28 $153,518 5 $39,092 APPLICATIONS DENIED 1 $68,000 138 $211,246 426 $138,766 81 $67,131 0 $0 57 $153,062 4 $46,750 APPLICATIONS WITHDRAWN 7 $141,207 99 $238,650 461 $144,347 34 $67,546 0 $0 29 $234,434 0 $0 FILES CLOSED FOR INCOMPLETENESS 0 $0 26 $193,848 66 $149,563 9 $41,417 0 $0 6 $104,953 0 $0
Aggregated Statistics For Year 2003(Based on 10 full tracts) A) FHA, FSA/RHS & VA B) Conventional C) Refinancings D) Home Improvement Loans E) Loans on Dwellings For 5+ Families F) Non-occupant Loans on Number Average Value Number Average Value Number Average Value Number Average Value Number Average Value Number Average Value
LOANS ORIGINATED 72 $125,297 796 $172,307 2,290 $137,217 70 $57,704 1 $3,777,540 276 $125,163 APPLICATIONS APPROVED, NOT ACCEPTED 2 $163,500 85 $209,559 285 $138,623 20 $33,295 0 $0 28 $151,183 APPLICATIONS DENIED 8 $133,059 97 $158,876 511 $123,617 66 $38,132 1 $3,439,500 47 $115,510 APPLICATIONS WITHDRAWN 10 $140,909 79 $169,045 517 $131,748 4 $18,725 0 $0 38 $141,197 FILES CLOSED FOR INCOMPLETENESS 0 $0 24 $166,410 93 $128,751 10 $59,477 0 $0 12 $137,974
Aggregated Statistics For Year 2002(Based on 10 full tracts) A) FHA, FSA/RHS & VA B) Conventional C) Refinancings D) Home Improvement Loans E) Loans on Dwellings For 5+ Families F) Non-occupant Loans on Number Average Value Number Average Value Number Average Value Number Average Value Number Average Value Number Average Value
LOANS ORIGINATED 76 $116,433 785 $155,940 1,476 $130,781 52 $45,946 0 $0 220 $119,674 APPLICATIONS APPROVED, NOT ACCEPTED 4 $133,250 57 $181,949 206 $127,382 32 $35,464 0 $0 20 $186,580 APPLICATIONS DENIED 6 $74,500 70 $132,755 392 $114,027 56 $46,484 1 $500,000 24 $146,612 APPLICATIONS WITHDRAWN 5 $106,006 83 $168,167 394 $129,545 21 $45,221 0 $0 31 $130,629 FILES CLOSED FOR INCOMPLETENESS 1 $189,000 13 $153,532 80 $124,104 2 $99,675 0 $0 8 $118,809
Aggregated Statistics For Year 2001(Based on 10 full tracts) A) FHA, FSA/RHS & VA B) Conventional C) Refinancings D) Home Improvement Loans E) Loans on Dwellings For 5+ Families F) Non-occupant Loans on Number Average Value Number Average Value Number Average Value Number Average Value Number Average Value Number Average Value
LOANS ORIGINATED 131 $107,263 689 $146,681 1,005 $126,392 79 $27,457 3 $4,161,553 145 $104,613 APPLICATIONS APPROVED, NOT ACCEPTED 3 $82,333 39 $112,521 144 $100,375 28 $57,050 0 $0 16 $103,024 APPLICATIONS DENIED 4 $88,912 58 $116,447 433 $104,319 58 $21,651 2 $2,344,595 24 $100,258 APPLICATIONS WITHDRAWN 8 $94,090 59 $176,527 351 $116,054 23 $26,277 0 $0 15 $93,484 FILES CLOSED FOR INCOMPLETENESS 6 $97,233 19 $120,558 47 $99,132 5 $32,456 0 $0 5 $92,518
Aggregated Statistics For Year 2000(Based on 10 full tracts) A) FHA, FSA/RHS & VA B) Conventional C) Refinancings D) Home Improvement Loans F) Non-occupant Loans on Number Average Value Number Average Value Number Average Value Number Average Value Number Average Value
LOANS ORIGINATED 122 $93,871 652 $127,228 252 $93,923 101 $27,750 109 $92,963 APPLICATIONS APPROVED, NOT ACCEPTED 7 $84,783 61 $108,711 71 $86,799 43 $27,899 17 $87,628 APPLICATIONS DENIED 9 $87,689 91 $116,725 192 $78,646 62 $23,838 23 $83,773 APPLICATIONS WITHDRAWN 10 $86,900 66 $140,501 162 $81,858 14 $28,116 12 $126,805 FILES CLOSED FOR INCOMPLETENESS 3 $67,220 29 $114,203 50 $98,104 4 $39,175 5 $94,110
Aggregated Statistics For Year 1999(Based on 10 full tracts) A) FHA, FSA/RHS & VA B) Conventional C) Refinancings D) Home Improvement Loans E) Loans on Dwellings For 5+ Families F) Non-occupant Loans on Number Average Value Number Average Value Number Average Value Number Average Value Number Average Value Number Average Value
LOANS ORIGINATED 162 $95,567 573 $123,852 563 $89,168 103 $24,676 0 $0 96 $71,788 APPLICATIONS APPROVED, NOT ACCEPTED 6 $147,497 62 $93,103 125 $93,044 30 $31,052 0 $0 7 $44,934 APPLICATIONS DENIED 12 $74,297 103 $75,109 227 $81,684 86 $20,107 1 $10,000 16 $51,732 APPLICATIONS WITHDRAWN 7 $73,044 59 $119,031 247 $78,282 22 $59,354 0 $0 13 $69,089 FILES CLOSED FOR INCOMPLETENESS 1 $86,000 21 $109,453 57 $121,534 3 $45,947 0 $0 4 $54,072
Detailed mortgage data for all 10 tracts in Merritt Island, FL
Private Mortgage Insurance Companies Aggregated Statistics For Year 2009(Based on 7 full tracts) A) Conventional B) Refinancings C) Non-occupant Loans on Number Average Value Number Average Value Number Average Value
LOANS ORIGINATED 7 $223,017 5 $242,250 0 $0 APPLICATIONS APPROVED, NOT ACCEPTED 3 $243,660 3 $313,777 0 $0 APPLICATIONS DENIED 4 $296,525 4 $280,500 0 $0 APPLICATIONS WITHDRAWN 3 $165,667 0 $0 0 $0 FILES CLOSED FOR INCOMPLETENESS 2 $231,195 0 $0 1 $142,000
Aggregated Statistics For Year 2008(Based on 10 full tracts) A) Conventional B) Refinancings C) Non-occupant Loans on Number Average Value Number Average Value Number Average Value
LOANS ORIGINATED 82 $208,953 19 $202,329 36 $195,948 APPLICATIONS APPROVED, NOT ACCEPTED 61 $219,330 19 $210,420 48 $203,380 APPLICATIONS DENIED 7 $252,211 8 $198,328 6 $196,845 APPLICATIONS WITHDRAWN 4 $300,460 3 $191,667 2 $187,000 FILES CLOSED FOR INCOMPLETENESS 3 $152,333 1 $140,000 3 $154,000
Aggregated Statistics For Year 2007(Based on 10 full tracts) A) Conventional B) Refinancings C) Non-occupant Loans on D) Loans On Manufactured Number Average Value Number Average Value Number Average Value Number Average Value
LOANS ORIGINATED 195 $213,967 37 $233,415 87 $204,038 1 $99,000 APPLICATIONS APPROVED, NOT ACCEPTED 19 $209,569 11 $259,302 10 $244,400 1 $99,000 APPLICATIONS DENIED 10 $200,300 3 $311,503 7 $199,286 0 $0 APPLICATIONS WITHDRAWN 13 $223,122 3 $171,333 7 $215,286 0 $0 FILES CLOSED FOR INCOMPLETENESS 4 $262,942 0 $0 2 $288,500 0 $0
Aggregated Statistics For Year 2006(Based on 10 full tracts) A) Conventional B) Refinancings C) Non-occupant Loans on Number Average Value Number Average Value Number Average Value
LOANS ORIGINATED 97 $266,429 21 $231,923 36 $234,500 APPLICATIONS APPROVED, NOT ACCEPTED 18 $256,166 8 $240,788 8 $197,376 APPLICATIONS DENIED 2 $188,800 1 $135,000 2 $135,300 APPLICATIONS WITHDRAWN 7 $294,689 3 $180,240 1 $135,600 FILES CLOSED FOR INCOMPLETENESS 0 $0 0 $0 0 $0
Aggregated Statistics For Year 2005(Based on 10 full tracts) A) Conventional B) Refinancings C) Non-occupant Loans on D) Loans On Manufactured Number Average Value Number Average Value Number Average Value Number Average Value
LOANS ORIGINATED 145 $214,936 25 $226,218 57 $217,127 0 $0 APPLICATIONS APPROVED, NOT ACCEPTED 16 $176,759 14 $147,099 5 $236,048 1 $31,000 APPLICATIONS DENIED 1 $101,700 3 $139,333 3 $139,333 0 $0 APPLICATIONS WITHDRAWN 10 $261,536 1 $65,000 3 $269,927 0 $0 FILES CLOSED FOR INCOMPLETENESS 0 $0 0 $0 0 $0 0 $0
Aggregated Statistics For Year 2004(Based on 10 full tracts) A) Conventional B) Refinancings C) Non-occupant Loans on Number Average Value Number Average Value Number Average Value
LOANS ORIGINATED 169 $178,483 42 $152,532 42 $180,591 APPLICATIONS APPROVED, NOT ACCEPTED 23 $192,703 15 $160,431 8 $130,400 APPLICATIONS DENIED 0 $0 0 $0 0 $0 APPLICATIONS WITHDRAWN 10 $211,676 3 $226,683 1 $196,000 FILES CLOSED FOR INCOMPLETENESS 2 $442,030 8 $115,750 2 $70,000
Aggregated Statistics For Year 2003(Based on 10 full tracts) A) Conventional B) Refinancings C) Non-occupant Loans on Number Average Value Number Average Value Number Average Value
LOANS ORIGINATED 205 $161,745 100 $145,834 44 $140,251 APPLICATIONS APPROVED, NOT ACCEPTED 35 $161,909 28 $111,970 6 $190,627 APPLICATIONS DENIED 4 $328,520 1 $102,670 0 $0 APPLICATIONS WITHDRAWN 14 $211,944 6 $122,167 3 $82,000 FILES CLOSED FOR INCOMPLETENESS 0 $0 3 $225,290 0 $0
Aggregated Statistics For Year 2002(Based on 10 full tracts) A) Conventional B) Refinancings C) Non-occupant Loans on Number Average Value Number Average Value Number Average Value
LOANS ORIGINATED 229 $142,908 105 $129,581 45 $104,589 APPLICATIONS APPROVED, NOT ACCEPTED 33 $182,590 53 $129,429 1 $381,080 APPLICATIONS DENIED 4 $168,605 0 $0 1 $94,000 APPLICATIONS WITHDRAWN 5 $144,864 11 $152,363 1 $66,000 FILES CLOSED FOR INCOMPLETENESS 1 $345,260 0 $0 0 $0
Aggregated Statistics For Year 2001(Based on 10 full tracts) A) Conventional B) Refinancings C) Non-occupant Loans on Number Average Value Number Average Value Number Average Value
LOANS ORIGINATED 175 $133,361 95 $132,170 20 $87,038 APPLICATIONS APPROVED, NOT ACCEPTED 26 $168,940 18 $118,781 3 $98,000 APPLICATIONS DENIED 8 $213,504 4 $126,775 1 $174,130 APPLICATIONS WITHDRAWN 4 $247,818 4 $135,752 0 $0 FILES CLOSED FOR INCOMPLETENESS 2 $88,360 2 $57,000 2 $45,360
Aggregated Statistics For Year 2000(Based on 10 full tracts) A) Conventional B) Refinancings C) Non-occupant Loans on Number Average Value Number Average Value Number Average Value
LOANS ORIGINATED 189 $119,067 22 $112,012 24 $83,004 APPLICATIONS APPROVED, NOT ACCEPTED 18 $130,081 1 $98,000 0 $0 APPLICATIONS DENIED 12 $174,959 0 $0 1 $31,840 APPLICATIONS WITHDRAWN 8 $94,512 2 $64,450 3 $90,300 FILES CLOSED FOR INCOMPLETENESS 0 $0 0 $0 0 $0
Aggregated Statistics For Year 1999(Based on 10 full tracts) A) Conventional B) Refinancings C) Non-occupant Loans on Number Average Value Number Average Value Number Average Value
LOANS ORIGINATED 181 $125,651 52 $119,098 17 $104,173 APPLICATIONS APPROVED, NOT ACCEPTED 11 $150,593 8 $130,887 2 $110,000 APPLICATIONS DENIED 7 $116,600 4 $123,070 0 $0 APPLICATIONS WITHDRAWN 8 $58,566 0 $0 5 $37,438 FILES CLOSED FOR INCOMPLETENESS 6 $133,533 1 $95,880 0 $0
Fire-safe hotels and motels in Merritt Island, Florida:
Aladdin Motel, 430 W Merritt Is Cswy, Merritt Island, Florida 32952
Clarion Hotel Kennedy Space Center Area, 260 E Merritt Island Cswy, Merritt Island, Florida 32952 Phone: (321) 452-7711, Fax: (321) 452-9462
All 2 fire-safe hotels and motels in Merritt Island, Florida
Most common first names in Merritt Island, FL among deceased individuals Name Count Lived (average)
John 316 73.5 years William 285 74.1 years Robert 270 71.0 years Mary 260 78.9 years James 230 70.9 years Charles 200 74.6 years George 153 74.9 years Helen 135 81.8 years Margaret 134 79.3 years Joseph 124 76.0 years
Most common last names in Merritt Island, FL among deceased individuals Last name Count Lived (average)
Smith 134 76.1 years Williams 70 73.7 years Jones 67 74.1 years Brown 61 77.5 years Johnson 59 74.1 years Anderson 49 75.0 years Miller 43 76.8 years Wilson 36 74.6 years Thomas 34 74.4 years Martin 32 75.2 years
Merritt Island compared to Florida state average:
Unemployed percentage below state average. Black race population percentage significantly below state average. Hispanic race population percentage significantly below state average. Median age above state average. Foreign-born population percentage significantly below state average. Length of stay since moving in significantly above state average. Percentage of population with a bachelor's degree or higher above state average.
Top Patent Applicants
John C. Pederson (27)
Michael J. Lynch (16)
G. Patrick Martin (11)
George Rodney Nelson, Jr. (11)
Thomas E. Gorsuch (11)
Pedro J. Medelius (9)
Christopher Brown (8)
Pedro Medelius (8)
Victor Hernandez (8)
Jacob D. Zurasky (5)
Total of 292 patent applications in 2008-2024.


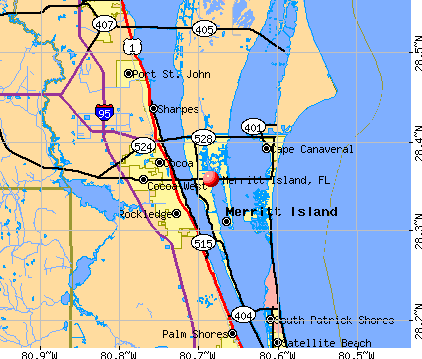


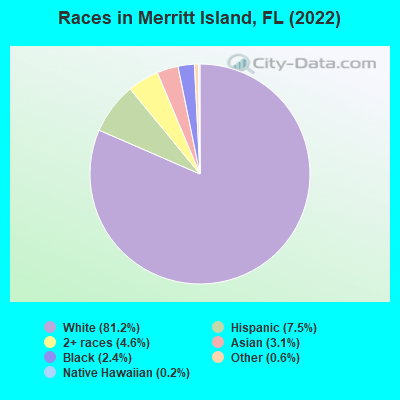
 Recent articles from our blog. Our writers, many of them Ph.D. graduates or candidates, create easy-to-read articles on a wide variety of topics.

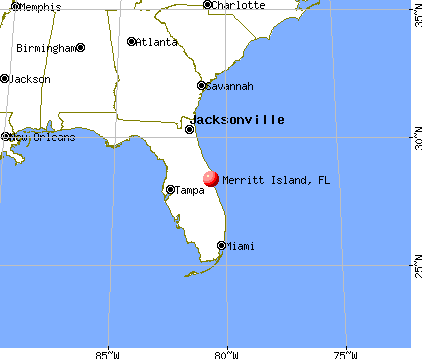
 (17.1 miles
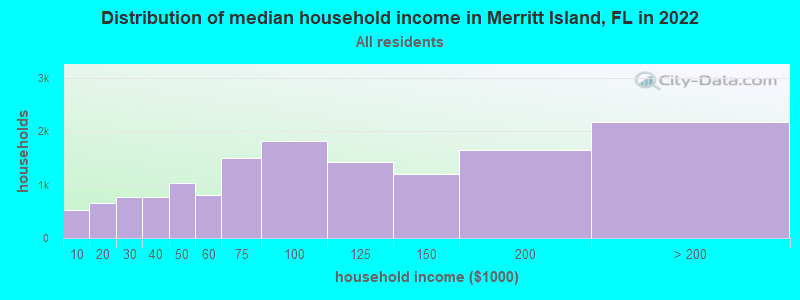
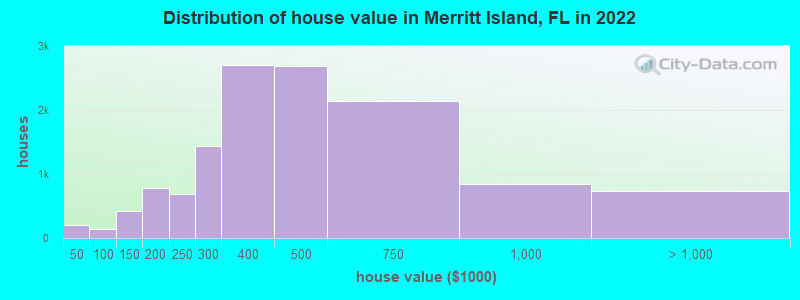

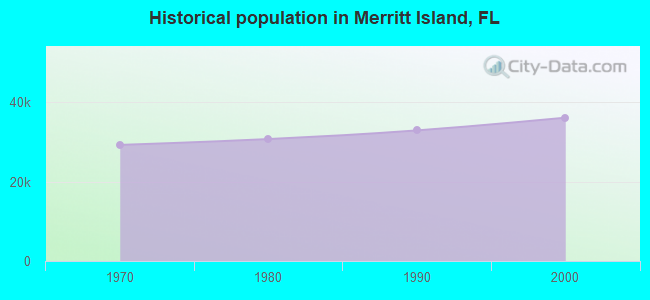
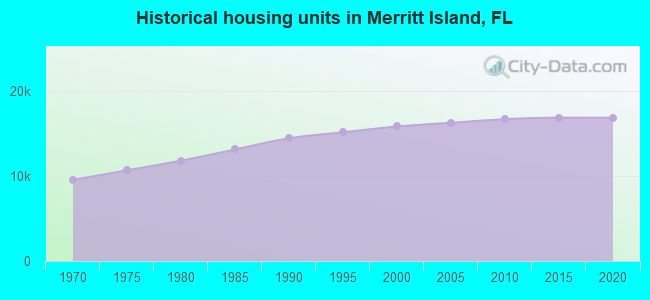
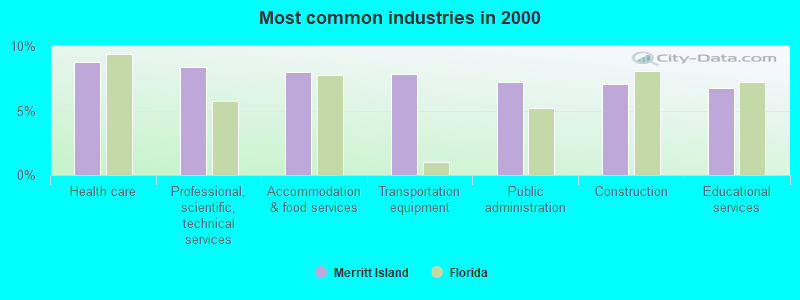
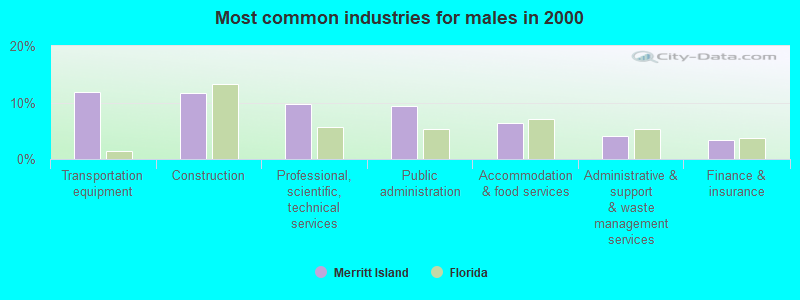
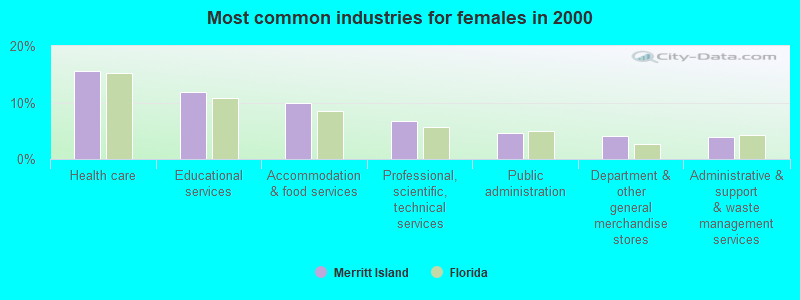
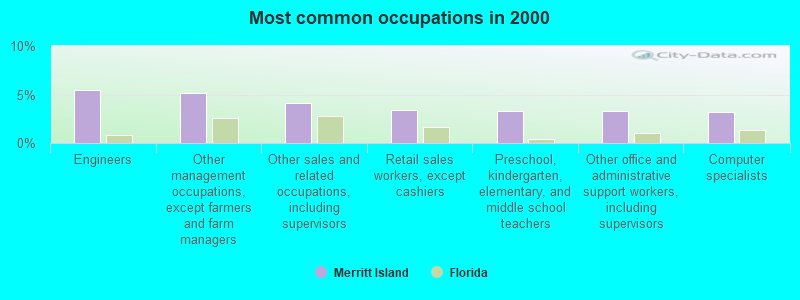
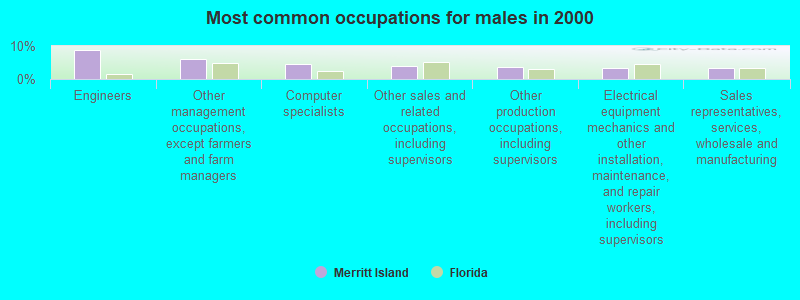
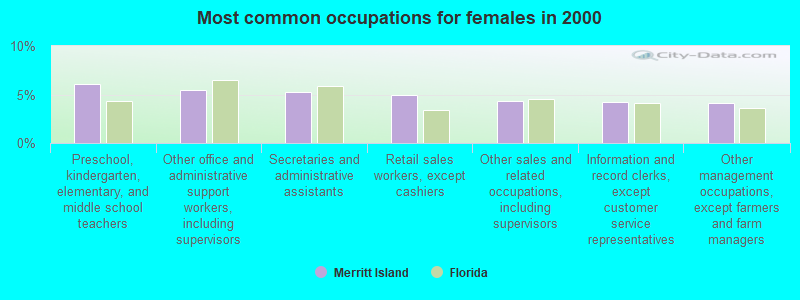
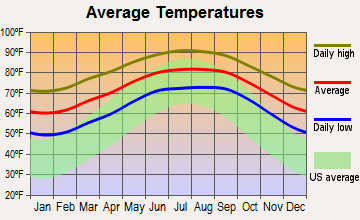


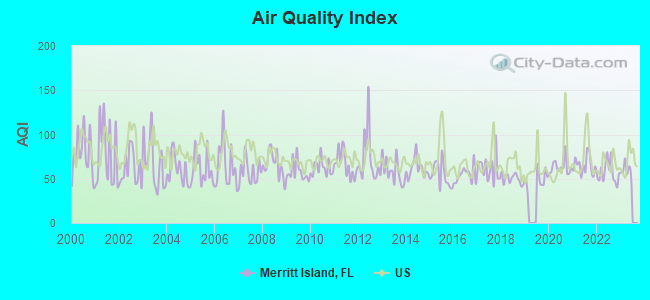
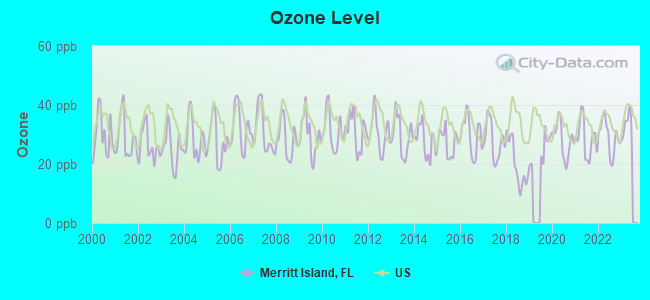
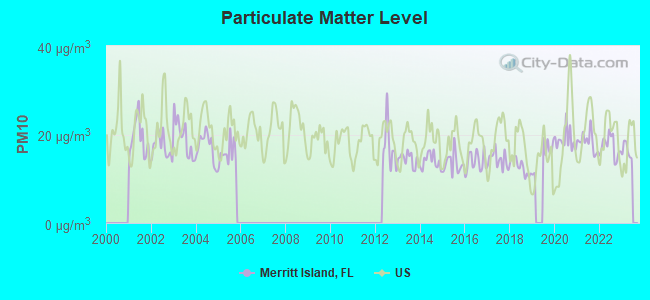
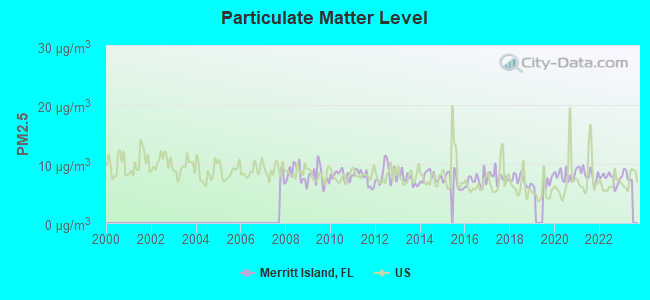

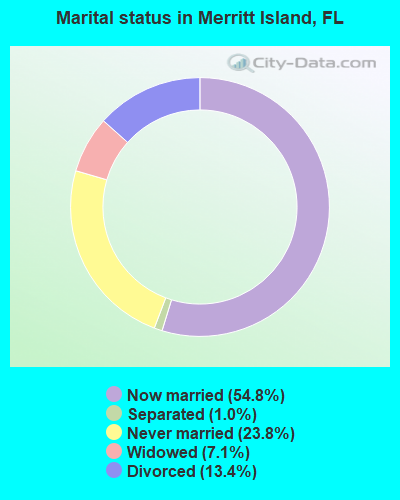
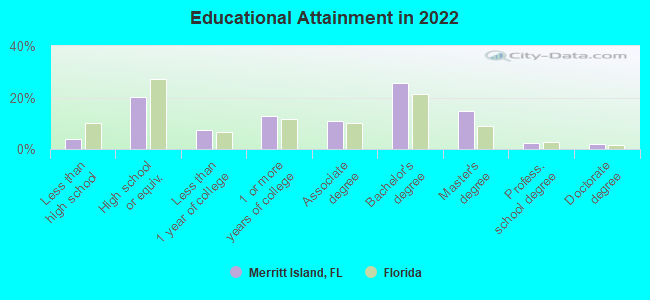

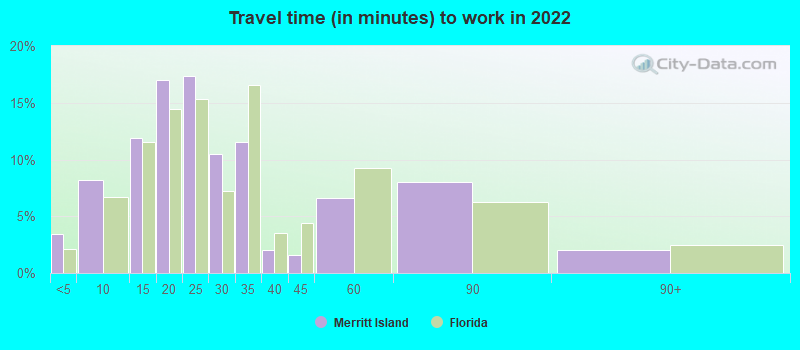
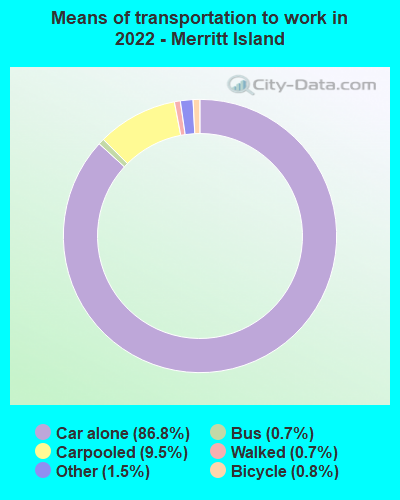
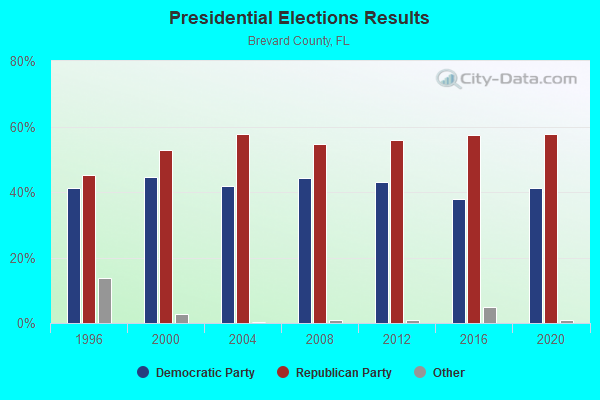
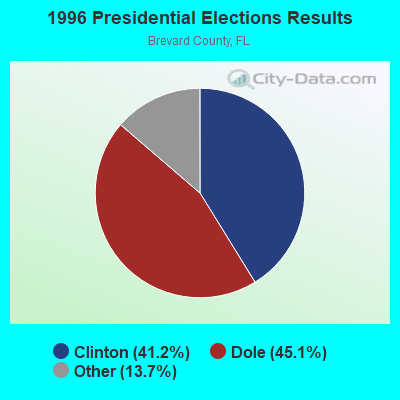
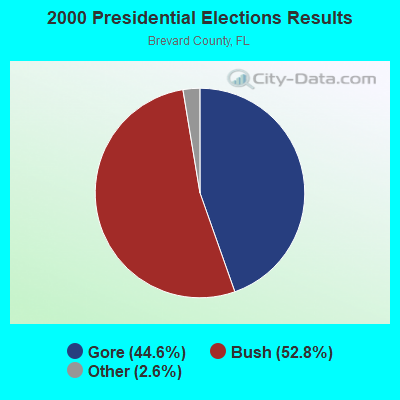
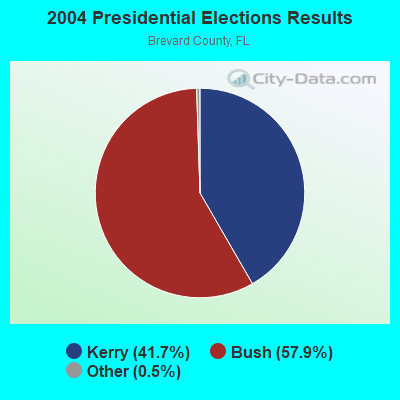
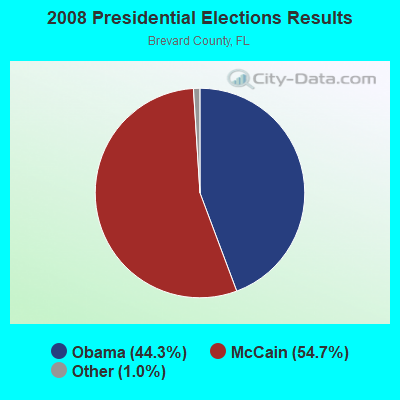
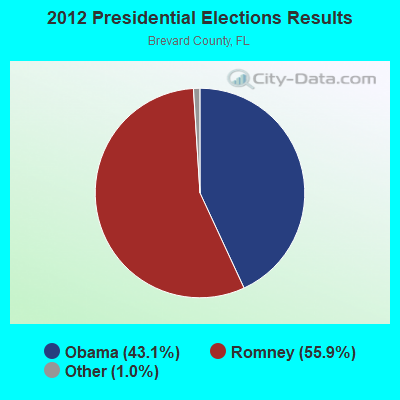
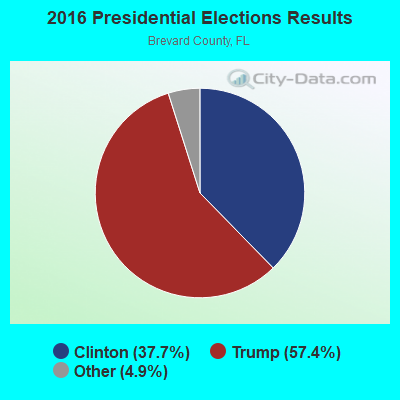
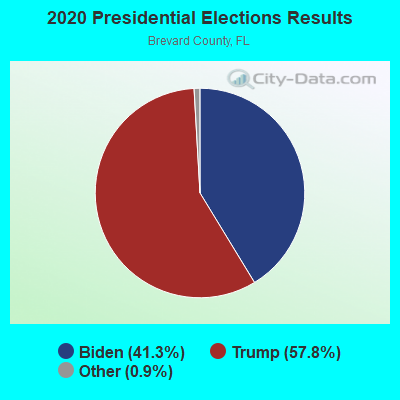
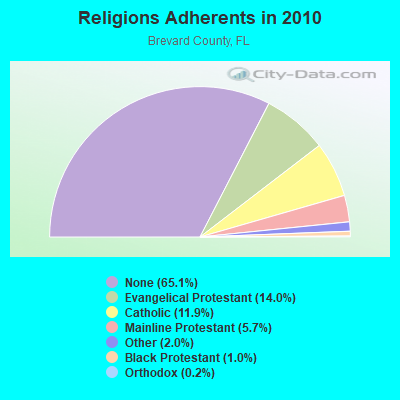
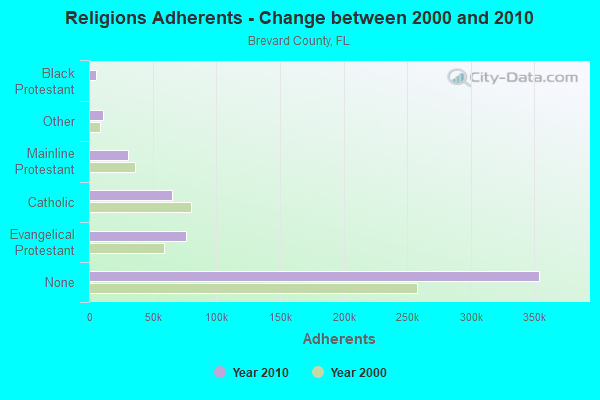
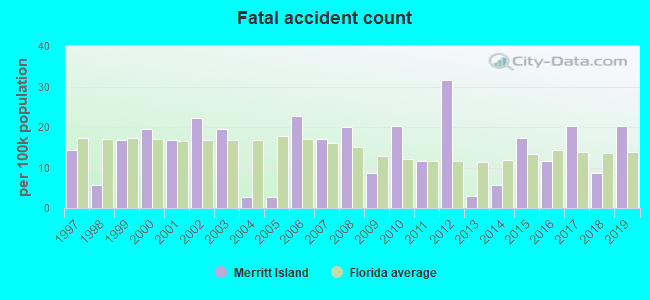
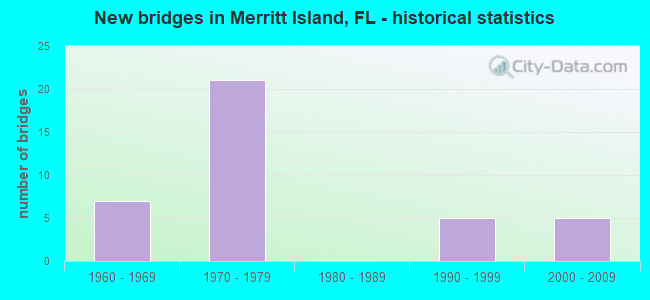
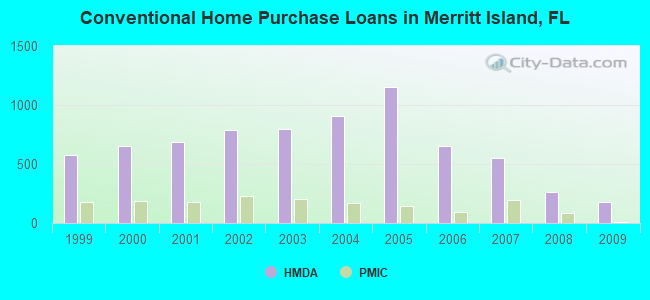
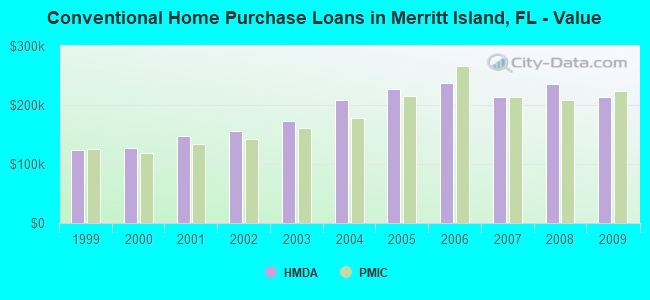
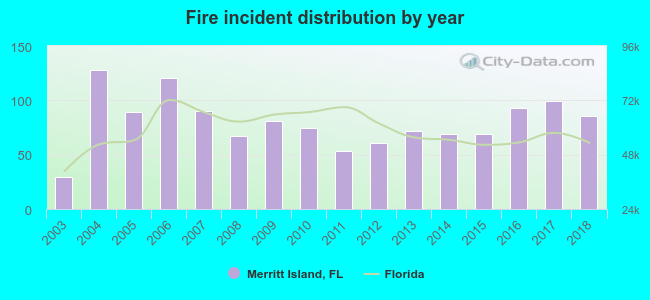 According to the data from the years 2003 - 2018 the average number of fires per year is 80. The highest number of fires - 128 took place in 2004, and the least - 29 in 2003. The data has a rising trend.
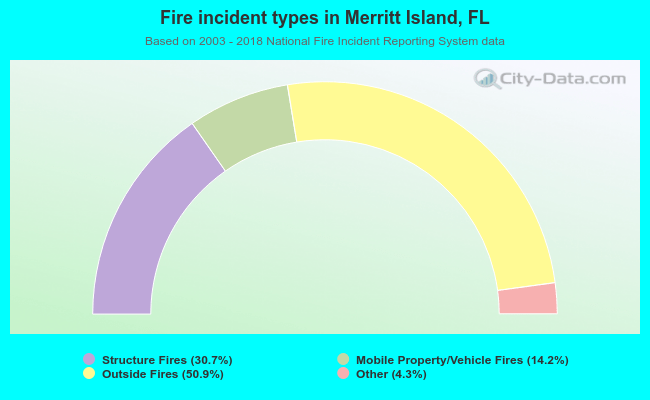 When looking into fire subcategories, the most reports belonged to: Outside Fires (50.9%), and Structure Fires (30.7%).