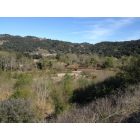
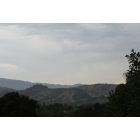
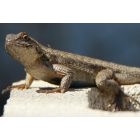
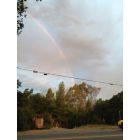
Oak View, California Submit your own pictures of this place and show them to the world
OSM Map
General Map
Google Map
MSN Map
OSM Map
General Map
Google Map
MSN Map
OSM Map
General Map
Google Map
MSN Map
OSM Map
General Map
Google Map
MSN Map
Please wait while loading the map...
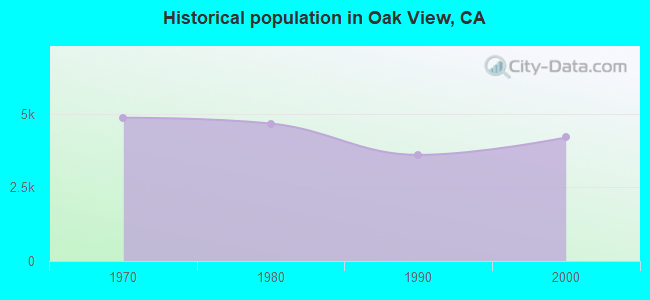
Population in 2010: 4,066. Population change since 2000: -3.2%Males: 2,115 Females: 1,951
March 2022 cost of living index in Oak View: 94.3 (less than average, U.S. average is 100) Percentage of residents living in poverty in 2022: 7.6%for White Non-Hispanic residents , 33.3% for Black residents , 4.5% for Hispanic or Latino residents , 6.1% for other race residents , 4.0% for two or more races residents )Business Search - 14 Million verified businesses
Data:
Median household income ($)
Median household income (% change since 2000)
Household income diversity
Ratio of average income to average house value (%)
Ratio of average income to average rent
Median household income ($) - White
Median household income ($) - Black or African American
Median household income ($) - Asian
Median household income ($) - Hispanic or Latino
Median household income ($) - American Indian and Alaska Native
Median household income ($) - Multirace
Median household income ($) - Other Race
Median household income for houses/condos with a mortgage ($)
Median household income for apartments without a mortgage ($)
Races - White alone (%)
Races - White alone (% change since 2000)
Races - Black alone (%)
Races - Black alone (% change since 2000)
Races - American Indian alone (%)
Races - American Indian alone (% change since 2000)
Races - Asian alone (%)
Races - Asian alone (% change since 2000)
Races - Hispanic (%)
Races - Hispanic (% change since 2000)
Races - Native Hawaiian and Other Pacific Islander alone (%)
Races - Native Hawaiian and Other Pacific Islander alone (% change since 2000)
Races - Two or more races (%)
Races - Two or more races (% change since 2000)
Races - Other race alone (%)
Races - Other race alone (% change since 2000)
Racial diversity
Unemployment (%)
Unemployment (% change since 2000)
Unemployment (%) - White
Unemployment (%) - Black or African American
Unemployment (%) - Asian
Unemployment (%) - Hispanic or Latino
Unemployment (%) - American Indian and Alaska Native
Unemployment (%) - Multirace
Unemployment (%) - Other Race
Population density (people per square mile)
Population - Males (%)
Population - Females (%)
Population - Males (%) - White
Population - Males (%) - Black or African American
Population - Males (%) - Asian
Population - Males (%) - Hispanic or Latino
Population - Males (%) - American Indian and Alaska Native
Population - Males (%) - Multirace
Population - Males (%) - Other Race
Population - Females (%) - White
Population - Females (%) - Black or African American
Population - Females (%) - Asian
Population - Females (%) - Hispanic or Latino
Population - Females (%) - American Indian and Alaska Native
Population - Females (%) - Multirace
Population - Females (%) - Other Race
Coronavirus confirmed cases (Jun 10, 2024)
Deaths caused by coronavirus (Jun 10, 2024)
Coronavirus confirmed cases (per 100k population) (Jun 10, 2024)
Deaths caused by coronavirus (per 100k population) (Jun 10, 2024)
Daily increase in number of cases (Jun 10, 2024)
Weekly increase in number of cases (Jun 10, 2024)
Cases doubled (in days) (Jun 10, 2024)
Hospitalized patients (Apr 18, 2022)
Negative test results (Apr 18, 2022)
Total test results (Apr 18, 2022)
COVID Vaccine doses distributed (per 100k population) (Sep 19, 2023)
COVID Vaccine doses administered (per 100k population) (Sep 19, 2023)
COVID Vaccine doses distributed (Sep 19, 2023)
COVID Vaccine doses administered (Sep 19, 2023)
Likely homosexual households (%)
Likely homosexual households (% change since 2000)
Likely homosexual households - Lesbian couples (%)
Likely homosexual households - Lesbian couples (% change since 2000)
Likely homosexual households - Gay men (%)
Likely homosexual households - Gay men (% change since 2000)
Cost of living index
Median gross rent ($)
Median contract rent ($)
Median monthly housing costs ($)
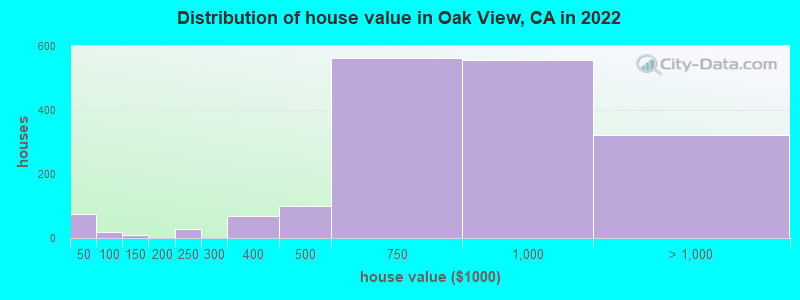
Median house or condo value ($)
Median house or condo value ($ change since 2000)
Mean house or condo value by units in structure - 1, detached ($)
Mean house or condo value by units in structure - 1, attached ($)
Mean house or condo value by units in structure - 2 ($)
Mean house or condo value by units in structure by units in structure - 3 or 4 ($)
Mean house or condo value by units in structure - 5 or more ($)
Mean house or condo value by units in structure - Boat, RV, van, etc. ($)
Mean house or condo value by units in structure - Mobile home ($)
Median house or condo value ($) - White
Median house or condo value ($) - Black or African American
Median house or condo value ($) - Asian
Median house or condo value ($) - Hispanic or Latino
Median house or condo value ($) - American Indian and Alaska Native
Median house or condo value ($) - Multirace
Median house or condo value ($) - Other Race
Median resident age
Resident age diversity
Median resident age - Males
Median resident age - Females
Median resident age - White
Median resident age - Black or African American
Median resident age - Asian
Median resident age - Hispanic or Latino
Median resident age - American Indian and Alaska Native
Median resident age - Multirace
Median resident age - Other Race
Median resident age - Males - White
Median resident age - Males - Black or African American
Median resident age - Males - Asian
Median resident age - Males - Hispanic or Latino
Median resident age - Males - American Indian and Alaska Native
Median resident age - Males - Multirace
Median resident age - Males - Other Race
Median resident age - Females - White
Median resident age - Females - Black or African American
Median resident age - Females - Asian
Median resident age - Females - Hispanic or Latino
Median resident age - Females - American Indian and Alaska Native
Median resident age - Females - Multirace
Median resident age - Females - Other Race
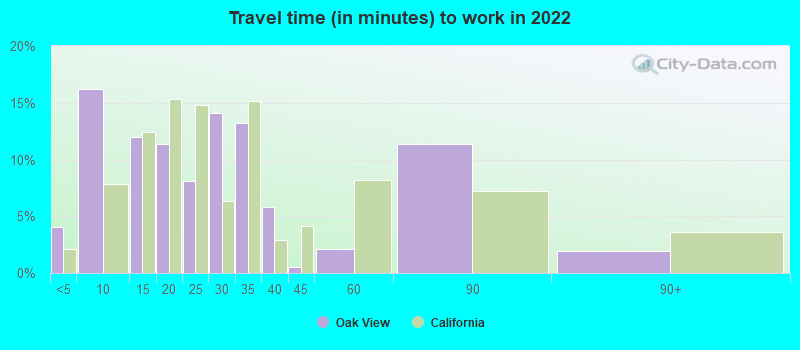
Commute - mean travel time to work (minutes)
Travel time to work - Less than 5 minutes (%)
Travel time to work - Less than 5 minutes (% change since 2000)
Travel time to work - 5 to 9 minutes (%)
Travel time to work - 5 to 9 minutes (% change since 2000)
Travel time to work - 10 to 19 minutes (%)
Travel time to work - 10 to 19 minutes (% change since 2000)
Travel time to work - 20 to 29 minutes (%)
Travel time to work - 20 to 29 minutes (% change since 2000)
Travel time to work - 30 to 39 minutes (%)
Travel time to work - 30 to 39 minutes (% change since 2000)
Travel time to work - 40 to 59 minutes (%)
Travel time to work - 40 to 59 minutes (% change since 2000)
Travel time to work - 60 to 89 minutes (%)
Travel time to work - 60 to 89 minutes (% change since 2000)
Travel time to work - 90 or more minutes (%)
Travel time to work - 90 or more minutes (% change since 2000)
Marital status - Never married (%)
Marital status - Now married (%)
Marital status - Separated (%)
Marital status - Widowed (%)
Marital status - Divorced (%)
Median family income ($)
Median family income (% change since 2000)
Median non-family income ($)
Median non-family income (% change since 2000)
Median per capita income ($)
Median per capita income (% change since 2000)
Median family income ($) - White
Median family income ($) - Black or African American
Median family income ($) - Asian
Median family income ($) - Hispanic or Latino
Median family income ($) - American Indian and Alaska Native
Median family income ($) - Multirace
Median family income ($) - Other Race
Median year house/condo built
Median year apartment built
Year house built - Built 2005 or later (%)
Year house built - Built 2000 to 2004 (%)
Year house built - Built 1990 to 1999 (%)
Year house built - Built 1980 to 1989 (%)
Year house built - Built 1970 to 1979 (%)
Year house built - Built 1960 to 1969 (%)
Year house built - Built 1950 to 1959 (%)
Year house built - Built 1940 to 1949 (%)
Year house built - Built 1939 or earlier (%)
Average household size
Household density (households per square mile)
Average household size - White
Average household size - Black or African American
Average household size - Asian
Average household size - Hispanic or Latino
Average household size - American Indian and Alaska Native
Average household size - Multirace
Average household size - Other Race
Occupied housing units (%)
Vacant housing units (%)
Owner occupied housing units (%)
Renter occupied housing units (%)
Vacancy status - For rent (%)
Vacancy status - For sale only (%)
Vacancy status - Rented or sold, not occupied (%)
Vacancy status - For seasonal, recreational, or occasional use (%)
Vacancy status - For migrant workers (%)
Vacancy status - Other vacant (%)
Residents with income below the poverty level (%)
Residents with income below 50% of the poverty level (%)
Children below poverty level (%)
Poor families by family type - Married-couple family (%)
Poor families by family type - Male, no wife present (%)
Poor families by family type - Female, no husband present (%)
Poverty status for native-born residents (%)
Poverty status for foreign-born residents (%)
Poverty among high school graduates not in families (%)
Poverty among people who did not graduate high school not in families (%)
Residents with income below the poverty level (%) - White
Residents with income below the poverty level (%) - Black or African American
Residents with income below the poverty level (%) - Asian
Residents with income below the poverty level (%) - Hispanic or Latino
Residents with income below the poverty level (%) - American Indian and Alaska Native
Residents with income below the poverty level (%) - Multirace
Residents with income below the poverty level (%) - Other Race
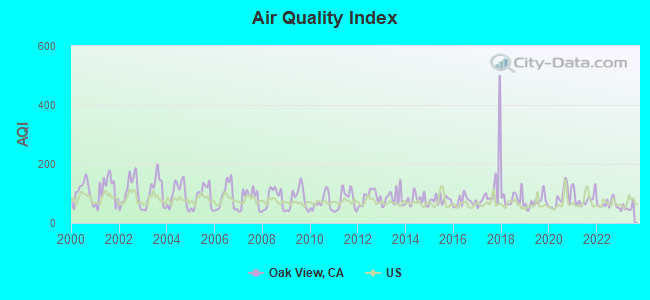
Air pollution - Air Quality Index (AQI)
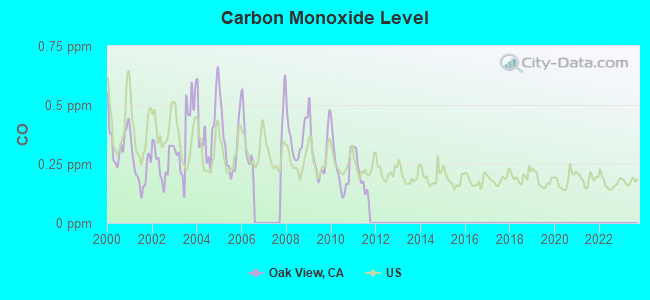
Air pollution - CO
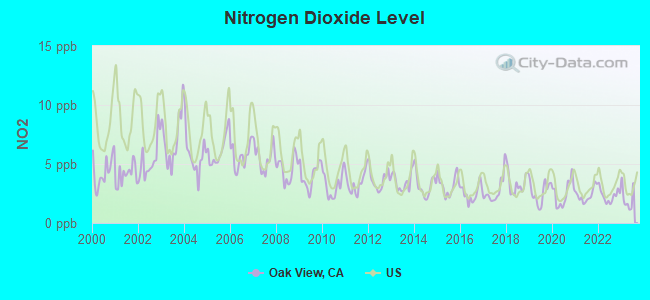
Air pollution - NO2
Air pollution - SO2
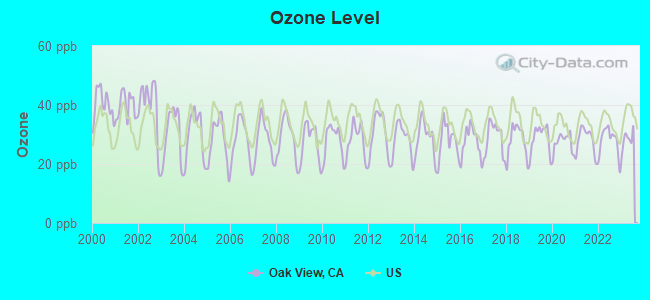
Air pollution - Ozone
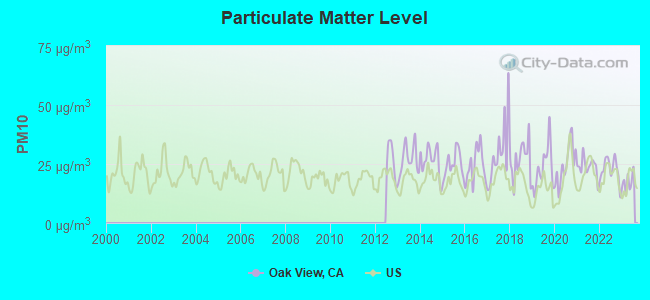
Air pollution - PM10
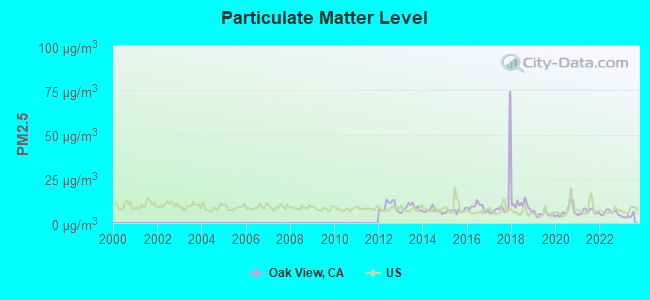
Air pollution - PM25
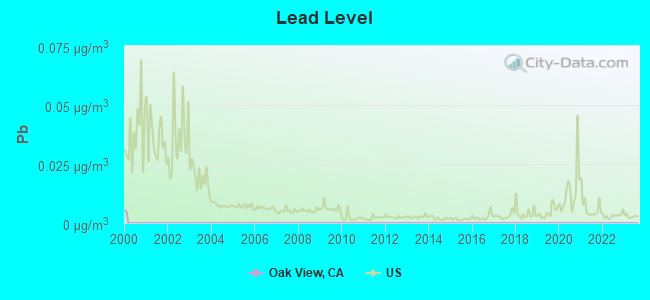
Air pollution - Pb
Crime - Murders per 100,000 population
Crime - Rapes per 100,000 population
Crime - Robberies per 100,000 population
Crime - Assaults per 100,000 population
Crime - Burglaries per 100,000 population
Crime - Thefts per 100,000 population
Crime - Auto thefts per 100,000 population
Crime - Arson per 100,000 population
Crime - City-data.com crime index
Crime - Violent crime index
Crime - Property crime index
Crime - Murders per 100,000 population (5 year average)
Crime - Rapes per 100,000 population (5 year average)
Crime - Robberies per 100,000 population (5 year average)
Crime - Assaults per 100,000 population (5 year average)
Crime - Burglaries per 100,000 population (5 year average)
Crime - Thefts per 100,000 population (5 year average)
Crime - Auto thefts per 100,000 population (5 year average)
Crime - Arson per 100,000 population (5 year average)
Crime - City-data.com crime index (5 year average)
Crime - Violent crime index (5 year average)
Crime - Property crime index (5 year average)
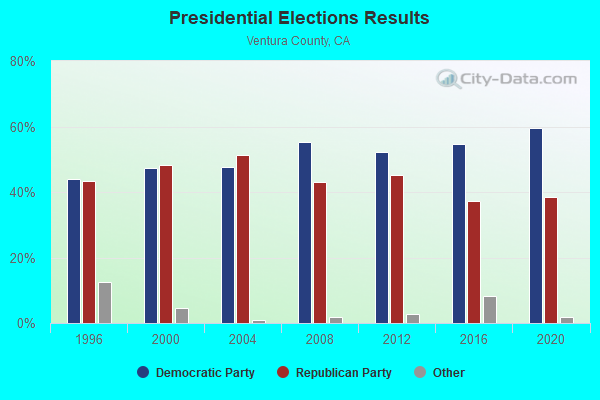
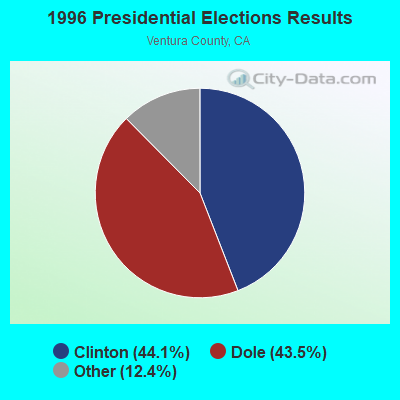
1996 Presidential Elections Results (%) - Democratic Party (Clinton)
1996 Presidential Elections Results (%) - Republican Party (Dole)
1996 Presidential Elections Results (%) - Other
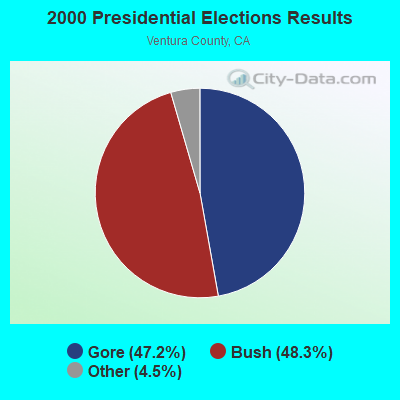
2000 Presidential Elections Results (%) - Democratic Party (Gore)
2000 Presidential Elections Results (%) - Republican Party (Bush)
2000 Presidential Elections Results (%) - Other
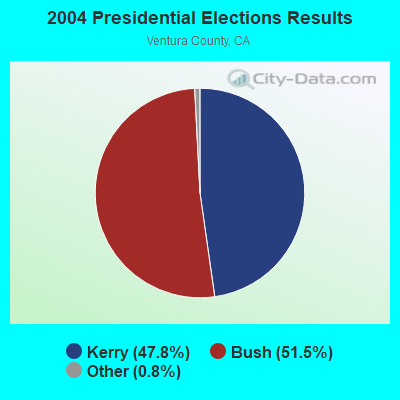
2004 Presidential Elections Results (%) - Democratic Party (Kerry)
2004 Presidential Elections Results (%) - Republican Party (Bush)
2004 Presidential Elections Results (%) - Other
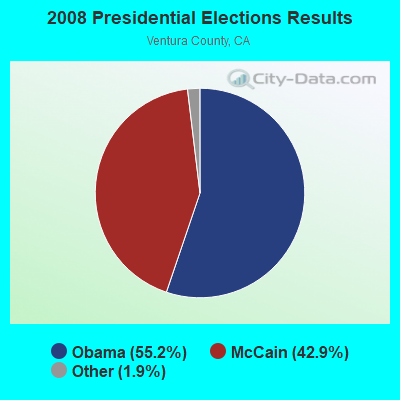
2008 Presidential Elections Results (%) - Democratic Party (Obama)
2008 Presidential Elections Results (%) - Republican Party (McCain)
2008 Presidential Elections Results (%) - Other
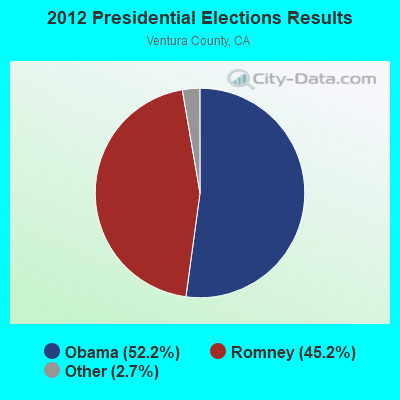
2012 Presidential Elections Results (%) - Democratic Party (Obama)
2012 Presidential Elections Results (%) - Republican Party (Romney)
2012 Presidential Elections Results (%) - Other
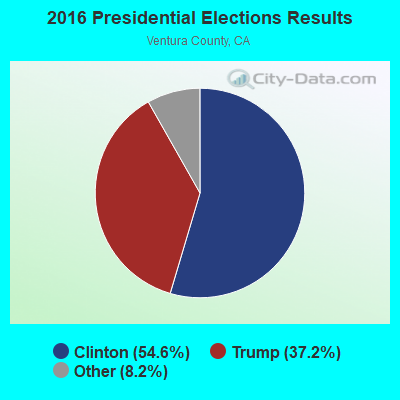
2016 Presidential Elections Results (%) - Democratic Party (Clinton)
2016 Presidential Elections Results (%) - Republican Party (Trump)
2016 Presidential Elections Results (%) - Other
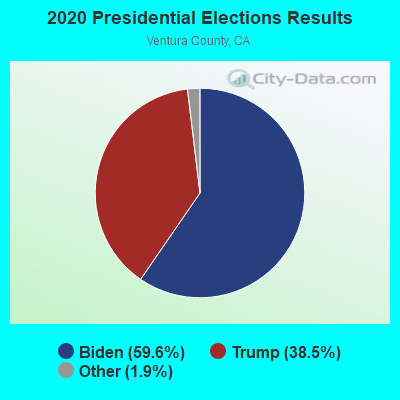
2020 Presidential Elections Results (%) - Democratic Party (Biden)
2020 Presidential Elections Results (%) - Republican Party (Trump)
2020 Presidential Elections Results (%) - Other
Ancestries Reported - Arab (%)
Ancestries Reported - Czech (%)
Ancestries Reported - Danish (%)
Ancestries Reported - Dutch (%)
Ancestries Reported - English (%)
Ancestries Reported - French (%)
Ancestries Reported - French Canadian (%)
Ancestries Reported - German (%)
Ancestries Reported - Greek (%)
Ancestries Reported - Hungarian (%)
Ancestries Reported - Irish (%)
Ancestries Reported - Italian (%)
Ancestries Reported - Lithuanian (%)
Ancestries Reported - Norwegian (%)
Ancestries Reported - Polish (%)
Ancestries Reported - Portuguese (%)
Ancestries Reported - Russian (%)
Ancestries Reported - Scotch-Irish (%)
Ancestries Reported - Scottish (%)
Ancestries Reported - Slovak (%)
Ancestries Reported - Subsaharan African (%)
Ancestries Reported - Swedish (%)
Ancestries Reported - Swiss (%)
Ancestries Reported - Ukrainian (%)
Ancestries Reported - United States (%)
Ancestries Reported - Welsh (%)
Ancestries Reported - West Indian (%)
Ancestries Reported - Other (%)
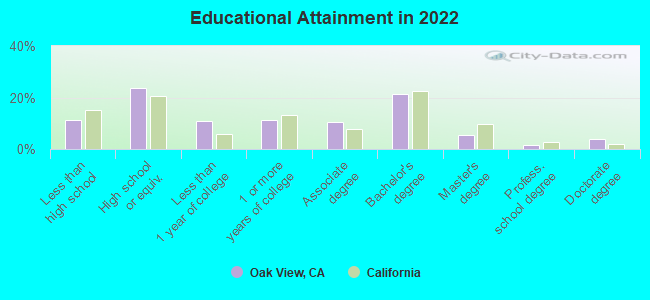
Educational Attainment - No schooling completed (%)
Educational Attainment - Less than high school (%)
Educational Attainment - High school or equivalent (%)
Educational Attainment - Less than 1 year of college (%)
Educational Attainment - 1 or more years of college (%)
Educational Attainment - Associate degree (%)
Educational Attainment - Bachelor's degree (%)
Educational Attainment - Master's degree (%)
Educational Attainment - Professional school degree (%)
Educational Attainment - Doctorate degree (%)
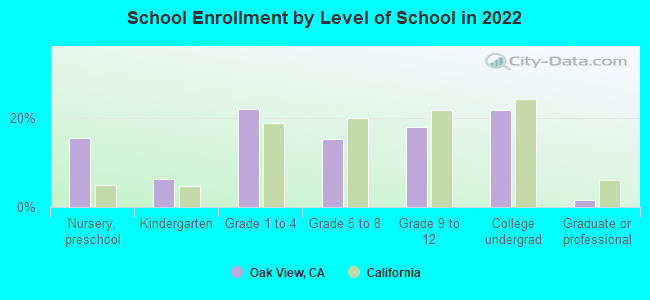
School Enrollment - Nursery, preschool (%)
School Enrollment - Kindergarten (%)
School Enrollment - Grade 1 to 4 (%)
School Enrollment - Grade 5 to 8 (%)
School Enrollment - Grade 9 to 12 (%)
School Enrollment - College undergrad (%)
School Enrollment - Graduate or professional (%)
School Enrollment - Not enrolled in school (%)
School enrollment - Public schools (%)
School enrollment - Private schools (%)
School enrollment - Not enrolled (%)
Median number of rooms in houses and condos
Median number of rooms in apartments
Housing units lacking complete plumbing facilities (%)
Housing units lacking complete kitchen facilities (%)
Density of houses
Urban houses (%)
Rural houses (%)
Households with people 60 years and over (%)
Households with people 65 years and over (%)
Households with people 75 years and over (%)
Households with one or more nonrelatives (%)
Households with no nonrelatives (%)
Population in households (%)
Family households (%)
Nonfamily households (%)
Population in families (%)
Family households with own children (%)
Median number of bedrooms in owner occupied houses
Mean number of bedrooms in owner occupied houses
Median number of bedrooms in renter occupied houses
Mean number of bedrooms in renter occupied houses
Median number of vehichles in owner occupied houses
Mean number of vehichles in owner occupied houses
Median number of vehichles in renter occupied houses
Mean number of vehichles in renter occupied houses
Mortgage status - with mortgage (%)
Mortgage status - with second mortgage (%)
Mortgage status - with home equity loan (%)
Mortgage status - with both second mortgage and home equity loan (%)
Mortgage status - without a mortgage (%)
Average family size
Average family size - White
Average family size - Black or African American
Average family size - Asian
Average family size - Hispanic or Latino
Average family size - American Indian and Alaska Native
Average family size - Multirace
Average family size - Other Race
Geographical mobility - Same house 1 year ago (%)
Geographical mobility - Moved within same county (%)
Geographical mobility - Moved from different county within same state (%)
Geographical mobility - Moved from different state (%)
Geographical mobility - Moved from abroad (%)
Place of birth - Born in state of residence (%)
Place of birth - Born in other state (%)
Place of birth - Native, outside of US (%)
Place of birth - Foreign born (%)
Housing units in structures - 1, detached (%)
Housing units in structures - 1, attached (%)
Housing units in structures - 2 (%)
Housing units in structures - 3 or 4 (%)
Housing units in structures - 5 to 9 (%)
Housing units in structures - 10 to 19 (%)
Housing units in structures - 20 to 49 (%)
Housing units in structures - 50 or more (%)
Housing units in structures - Mobile home (%)
Housing units in structures - Boat, RV, van, etc. (%)
House/condo owner moved in on average (years ago)
Renter moved in on average (years ago)
Year householder moved into unit - Moved in 1999 to March 2000 (%)
Year householder moved into unit - Moved in 1995 to 1998 (%)
Year householder moved into unit - Moved in 1990 to 1994 (%)
Year householder moved into unit - Moved in 1980 to 1989 (%)
Year householder moved into unit - Moved in 1970 to 1979 (%)
Year householder moved into unit - Moved in 1969 or earlier (%)
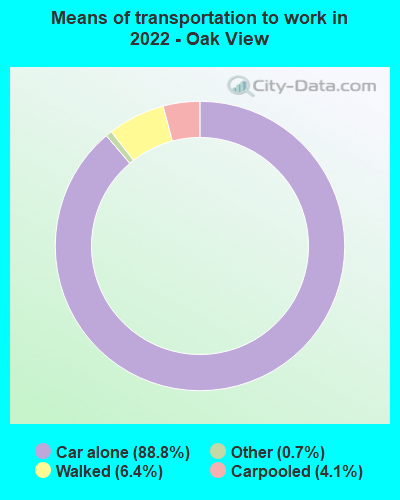
Means of transportation to work - Drove car alone (%)
Means of transportation to work - Carpooled (%)
Means of transportation to work - Public transportation (%)
Means of transportation to work - Bus or trolley bus (%)
Means of transportation to work - Streetcar or trolley car (%)
Means of transportation to work - Subway or elevated (%)
Means of transportation to work - Railroad (%)
Means of transportation to work - Ferryboat (%)
Means of transportation to work - Taxicab (%)
Means of transportation to work - Motorcycle (%)
Means of transportation to work - Bicycle (%)
Means of transportation to work - Walked (%)
Means of transportation to work - Other means (%)
Working at home (%)
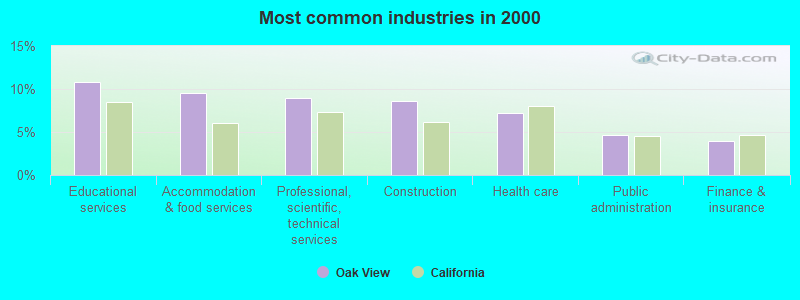
Industry diversity
Most Common Industries - Agriculture, forestry, fishing and hunting, and mining (%)
Most Common Industries - Agriculture, forestry, fishing and hunting (%)
Most Common Industries - Mining, quarrying, and oil and gas extraction (%)
Most Common Industries - Construction (%)
Most Common Industries - Manufacturing (%)
Most Common Industries - Wholesale trade (%)
Most Common Industries - Retail trade (%)
Most Common Industries - Transportation and warehousing, and utilities (%)
Most Common Industries - Transportation and warehousing (%)
Most Common Industries - Utilities (%)
Most Common Industries - Information (%)
Most Common Industries - Finance and insurance, and real estate and rental and leasing (%)
Most Common Industries - Finance and insurance (%)
Most Common Industries - Real estate and rental and leasing (%)
Most Common Industries - Professional, scientific, and management, and administrative and waste management services (%)
Most Common Industries - Professional, scientific, and technical services (%)
Most Common Industries - Management of companies and enterprises (%)
Most Common Industries - Administrative and support and waste management services (%)
Most Common Industries - Educational services, and health care and social assistance (%)
Most Common Industries - Educational services (%)
Most Common Industries - Health care and social assistance (%)
Most Common Industries - Arts, entertainment, and recreation, and accommodation and food services (%)
Most Common Industries - Arts, entertainment, and recreation (%)
Most Common Industries - Accommodation and food services (%)
Most Common Industries - Other services, except public administration (%)
Most Common Industries - Public administration (%)
Occupation diversity
Most Common Occupations - Management, business, science, and arts occupations (%)
Most Common Occupations - Management, business, and financial occupations (%)
Most Common Occupations - Management occupations (%)
Most Common Occupations - Business and financial operations occupations (%)
Most Common Occupations - Computer, engineering, and science occupations (%)
Most Common Occupations - Computer and mathematical occupations (%)
Most Common Occupations - Architecture and engineering occupations (%)
Most Common Occupations - Life, physical, and social science occupations (%)
Most Common Occupations - Education, legal, community service, arts, and media occupations (%)
Most Common Occupations - Community and social service occupations (%)
Most Common Occupations - Legal occupations (%)
Most Common Occupations - Education, training, and library occupations (%)
Most Common Occupations - Arts, design, entertainment, sports, and media occupations (%)
Most Common Occupations - Healthcare practitioners and technical occupations (%)
Most Common Occupations - Health diagnosing and treating practitioners and other technical occupations (%)
Most Common Occupations - Health technologists and technicians (%)
Most Common Occupations - Service occupations (%)
Most Common Occupations - Healthcare support occupations (%)
Most Common Occupations - Protective service occupations (%)
Most Common Occupations - Fire fighting and prevention, and other protective service workers including supervisors (%)
Most Common Occupations - Law enforcement workers including supervisors (%)
Most Common Occupations - Food preparation and serving related occupations (%)
Most Common Occupations - Building and grounds cleaning and maintenance occupations (%)
Most Common Occupations - Personal care and service occupations (%)
Most Common Occupations - Sales and office occupations (%)
Most Common Occupations - Sales and related occupations (%)
Most Common Occupations - Office and administrative support occupations (%)
Most Common Occupations - Natural resources, construction, and maintenance occupations (%)
Most Common Occupations - Farming, fishing, and forestry occupations (%)
Most Common Occupations - Construction and extraction occupations (%)
Most Common Occupations - Installation, maintenance, and repair occupations (%)
Most Common Occupations - Production, transportation, and material moving occupations (%)
Most Common Occupations - Production occupations (%)
Most Common Occupations - Transportation occupations (%)
Most Common Occupations - Material moving occupations (%)
People in Group quarters - Institutionalized population (%)
People in Group quarters - Correctional institutions (%)
People in Group quarters - Federal prisons and detention centers (%)
People in Group quarters - Halfway houses (%)
People in Group quarters - Local jails and other confinement facilities (including police lockups) (%)
People in Group quarters - Military disciplinary barracks (%)
People in Group quarters - State prisons (%)
People in Group quarters - Other types of correctional institutions (%)
People in Group quarters - Nursing homes (%)
People in Group quarters - Hospitals/wards, hospices, and schools for the handicapped (%)
People in Group quarters - Hospitals/wards and hospices for chronically ill (%)
People in Group quarters - Hospices or homes for chronically ill (%)
People in Group quarters - Military hospitals or wards for chronically ill (%)
People in Group quarters - Other hospitals or wards for chronically ill (%)
People in Group quarters - Hospitals or wards for drug/alcohol abuse (%)
People in Group quarters - Mental (Psychiatric) hospitals or wards (%)
People in Group quarters - Schools, hospitals, or wards for the mentally retarded (%)
People in Group quarters - Schools, hospitals, or wards for the physically handicapped (%)
People in Group quarters - Institutions for the deaf (%)
People in Group quarters - Institutions for the blind (%)
People in Group quarters - Orthopedic wards and institutions for the physically handicapped (%)
People in Group quarters - Wards in general hospitals for patients who have no usual home elsewhere (%)
People in Group quarters - Wards in military hospitals for patients who have no usual home elsewhere (%)
People in Group quarters - Juvenile institutions (%)
People in Group quarters - Long-term care (%)
People in Group quarters - Homes for abused, dependent, and neglected children (%)
People in Group quarters - Residential treatment centers for emotionally disturbed children (%)
People in Group quarters - Training schools for juvenile delinquents (%)
People in Group quarters - Short-term care, detention or diagnostic centers for delinquent children (%)
People in Group quarters - Type of juvenile institution unknown (%)
People in Group quarters - Noninstitutionalized population (%)
People in Group quarters - College dormitories (includes college quarters off campus) (%)
People in Group quarters - Military quarters (%)
People in Group quarters - On base (%)
People in Group quarters - Barracks, unaccompanied personnel housing (UPH), (Enlisted/Officer), ;and similar group living quarters for military personnel (%)
People in Group quarters - Transient quarters for temporary residents (%)
People in Group quarters - Military ships (%)
People in Group quarters - Group homes (%)
People in Group quarters - Homes or halfway houses for drug/alcohol abuse (%)
People in Group quarters - Homes for the mentally ill (%)
People in Group quarters - Homes for the mentally retarded (%)
People in Group quarters - Homes for the physically handicapped (%)
People in Group quarters - Other group homes (%)
People in Group quarters - Religious group quarters (%)
People in Group quarters - Dormitories (%)
People in Group quarters - Agriculture workers' dormitories on farms (%)
People in Group quarters - Job Corps and vocational training facilities (%)
People in Group quarters - Other workers' dormitories (%)
People in Group quarters - Crews of maritime vessels (%)
People in Group quarters - Other nonhousehold living situations (%)
People in Group quarters - Other noninstitutional group quarters (%)
Residents speaking English at home (%)
Residents speaking English at home - Born in the United States (%)
Residents speaking English at home - Native, born elsewhere (%)
Residents speaking English at home - Foreign born (%)
Residents speaking Spanish at home (%)
Residents speaking Spanish at home - Born in the United States (%)
Residents speaking Spanish at home - Native, born elsewhere (%)
Residents speaking Spanish at home - Foreign born (%)
Residents speaking other language at home (%)
Residents speaking other language at home - Born in the United States (%)
Residents speaking other language at home - Native, born elsewhere (%)
Residents speaking other language at home - Foreign born (%)
Class of Workers - Employee of private company (%)
Class of Workers - Self-employed in own incorporated business (%)
Class of Workers - Private not-for-profit wage and salary workers (%)
Class of Workers - Local government workers (%)
Class of Workers - State government workers (%)
Class of Workers - Federal government workers (%)
Class of Workers - Self-employed workers in own not incorporated business and Unpaid family workers (%)
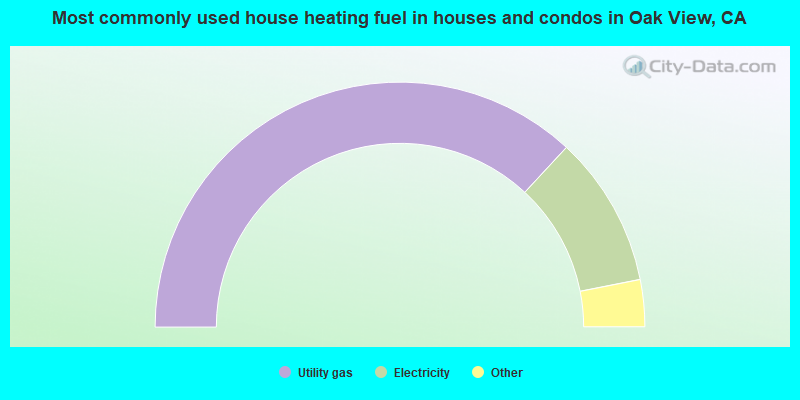
House heating fuel used in houses and condos - Utility gas (%)
House heating fuel used in houses and condos - Bottled, tank, or LP gas (%)
House heating fuel used in houses and condos - Electricity (%)
House heating fuel used in houses and condos - Fuel oil, kerosene, etc. (%)
House heating fuel used in houses and condos - Coal or coke (%)
House heating fuel used in houses and condos - Wood (%)
House heating fuel used in houses and condos - Solar energy (%)
House heating fuel used in houses and condos - Other fuel (%)
House heating fuel used in houses and condos - No fuel used (%)
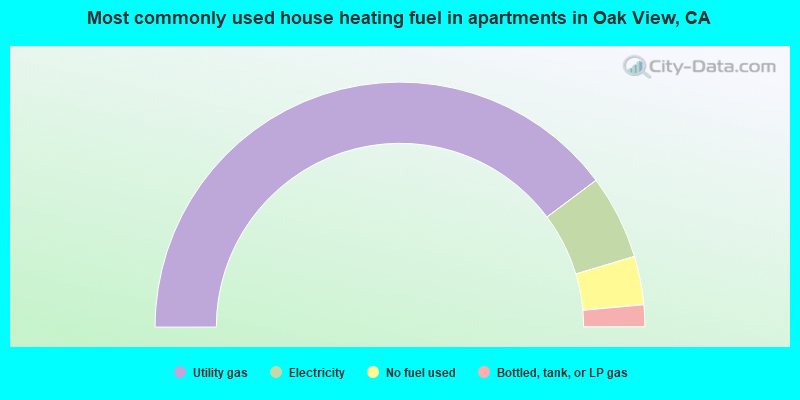
House heating fuel used in apartments - Utility gas (%)
House heating fuel used in apartments - Bottled, tank, or LP gas (%)
House heating fuel used in apartments - Electricity (%)
House heating fuel used in apartments - Fuel oil, kerosene, etc. (%)
House heating fuel used in apartments - Coal or coke (%)
House heating fuel used in apartments - Wood (%)
House heating fuel used in apartments - Solar energy (%)
House heating fuel used in apartments - Other fuel (%)
House heating fuel used in apartments - No fuel used (%)
Armed forces status - In Armed Forces (%)
Armed forces status - Civilian (%)
Armed forces status - Civilian - Veteran (%)
Armed forces status - Civilian - Nonveteran (%)
Fatal accidents locations in years 2005-2021
Fatal accidents locations in 2005
Fatal accidents locations in 2006
Fatal accidents locations in 2007
Fatal accidents locations in 2008
Fatal accidents locations in 2009
Fatal accidents locations in 2010
Fatal accidents locations in 2011
Fatal accidents locations in 2012
Fatal accidents locations in 2013
Fatal accidents locations in 2014
Fatal accidents locations in 2015
Fatal accidents locations in 2016
Fatal accidents locations in 2017
Fatal accidents locations in 2018
Fatal accidents locations in 2019
Fatal accidents locations in 2020
Fatal accidents locations in 2021
Alcohol use - People drinking some alcohol every month (%)
Alcohol use - People not drinking at all (%)
Alcohol use - Average days/month drinking alcohol
Alcohol use - Average drinks/week
Alcohol use - Average days/year people drink much
Audiometry - Average condition of hearing (%)
Audiometry - People that can hear a whisper from across a quiet room (%)
Audiometry - People that can hear normal voice from across a quiet room (%)
Audiometry - Ears ringing, roaring, buzzing (%)
Audiometry - Had a job exposure to loud noise (%)
Audiometry - Had off-work exposure to loud noise (%)
Blood Pressure & Cholesterol - Has high blood pressure (%)
Blood Pressure & Cholesterol - Checking blood pressure at home (%)
Blood Pressure & Cholesterol - Frequently checking blood cholesterol (%)
Blood Pressure & Cholesterol - Has high cholesterol level (%)
Consumer Behavior - Money monthly spent on food at supermarket/grocery store
Consumer Behavior - Money monthly spent on food at other stores
Consumer Behavior - Money monthly spent on eating out
Consumer Behavior - Money monthly spent on carryout/delivered foods
Consumer Behavior - Income spent on food at supermarket/grocery store (%)
Consumer Behavior - Income spent on food at other stores (%)
Consumer Behavior - Income spent on eating out (%)
Consumer Behavior - Income spent on carryout/delivered foods (%)
Current Health Status - General health condition (%)
Current Health Status - Blood donors (%)
Current Health Status - Has blood ever tested for HIV virus (%)
Current Health Status - Left-handed people (%)
Dermatology - People using sunscreen (%)
Diabetes - Diabetics (%)
Diabetes - Had a blood test for high blood sugar (%)
Diabetes - People taking insulin (%)
Diet Behavior & Nutrition - Diet health (%)
Diet Behavior & Nutrition - Milk product consumption (# of products/month)
Diet Behavior & Nutrition - Meals not home prepared (#/week)
Diet Behavior & Nutrition - Meals from fast food or pizza place (#/week)
Diet Behavior & Nutrition - Ready-to-eat foods (#/month)
Diet Behavior & Nutrition - Frozen meals/pizza (#/month)
Drug Use - People that ever used marijuana or hashish (%)
Drug Use - Ever used hard drugs (%)
Drug Use - Ever used any form of cocaine (%)
Drug Use - Ever used heroin (%)
Drug Use - Ever used methamphetamine (%)
Health Insurance - People covered by health insurance (%)
Kidney Conditions-Urology - Avg. # of times urinating at night
Medical Conditions - People with asthma (%)
Medical Conditions - People with anemia (%)
Medical Conditions - People with psoriasis (%)
Medical Conditions - People with overweight (%)
Medical Conditions - Elderly people having difficulties in thinking or remembering (%)
Medical Conditions - People who ever received blood transfusion (%)
Medical Conditions - People having trouble seeing even with glass/contacts (%)
Medical Conditions - People with arthritis (%)
Medical Conditions - People with gout (%)
Medical Conditions - People with congestive heart failure (%)
Medical Conditions - People with coronary heart disease (%)
Medical Conditions - People with angina pectoris (%)
Medical Conditions - People who ever had heart attack (%)
Medical Conditions - People who ever had stroke (%)
Medical Conditions - People with emphysema (%)
Medical Conditions - People with thyroid problem (%)
Medical Conditions - People with chronic bronchitis (%)
Medical Conditions - People with any liver condition (%)
Medical Conditions - People who ever had cancer or malignancy (%)
Mental Health - People who have little interest in doing things (%)
Mental Health - People feeling down, depressed, or hopeless (%)
Mental Health - People who have trouble sleeping or sleeping too much (%)
Mental Health - People feeling tired or having little energy (%)
Mental Health - People with poor appetite or overeating (%)
Mental Health - People feeling bad about themself (%)
Mental Health - People who have trouble concentrating on things (%)
Mental Health - People moving or speaking slowly or too fast (%)
Mental Health - People having thoughts they would be better off dead (%)
Oral Health - Average years since last visit a dentist
Oral Health - People embarrassed because of mouth (%)
Oral Health - People with gum disease (%)
Oral Health - General health of teeth and gums (%)
Oral Health - Average days a week using dental floss/device
Oral Health - Average days a week using mouthwash for dental problem
Oral Health - Average number of teeth
Pesticide Use - Households using pesticides to control insects (%)
Pesticide Use - Households using pesticides to kill weeds (%)
Physical Activity - People doing vigorous-intensity work activities (%)
Physical Activity - People doing moderate-intensity work activities (%)
Physical Activity - People walking or bicycling (%)
Physical Activity - People doing vigorous-intensity recreational activities (%)
Physical Activity - People doing moderate-intensity recreational activities (%)
Physical Activity - Average hours a day doing sedentary activities
Physical Activity - Average hours a day watching TV or videos
Physical Activity - Average hours a day using computer
Physical Functioning - People having limitations keeping them from working (%)
Physical Functioning - People limited in amount of work they can do (%)
Physical Functioning - People that need special equipment to walk (%)
Physical Functioning - People experiencing confusion/memory problems (%)
Physical Functioning - People requiring special healthcare equipment (%)
Prescription Medications - Average number of prescription medicines taking
Preventive Aspirin Use - Adults 40+ taking low-dose aspirin (%)
Reproductive Health - Vaginal deliveries (%)
Reproductive Health - Cesarean deliveries (%)
Reproductive Health - Deliveries resulted in a live birth (%)
Reproductive Health - Pregnancies resulted in a delivery (%)
Reproductive Health - Women breastfeeding newborns (%)
Reproductive Health - Women that had a hysterectomy (%)
Reproductive Health - Women that had both ovaries removed (%)
Reproductive Health - Women that have ever taken birth control pills (%)
Reproductive Health - Women taking birth control pills (%)
Reproductive Health - Women that have ever used Depo-Provera or injectables (%)
Reproductive Health - Women that have ever used female hormones (%)
Sexual Behavior - People 18+ that ever had sex (vaginal, anal, or oral) (%)
Sexual Behavior - Males 18+ that ever had vaginal sex with a woman (%)
Sexual Behavior - Males 18+ that ever performed oral sex on a woman (%)
Sexual Behavior - Males 18+ that ever had anal sex with a woman (%)
Sexual Behavior - Males 18+ that ever had any sex with a man (%)
Sexual Behavior - Females 18+ that ever had vaginal sex with a man (%)
Sexual Behavior - Females 18+ that ever performed oral sex on a man (%)
Sexual Behavior - Females 18+ that ever had anal sex with a man (%)
Sexual Behavior - Females 18+ that ever had any kind of sex with a woman (%)
Sexual Behavior - Average age people first had sex
Sexual Behavior - Average number of female sex partners in lifetime (males 18+)
Sexual Behavior - Average number of female vaginal sex partners in lifetime (males 18+)
Sexual Behavior - Average age people first performed oral sex on a woman (18+)
Sexual Behavior - Average number of woman performed oral sex on in lifetime (18+)
Sexual Behavior - Average number of male sex partners in lifetime (males 18+)
Sexual Behavior - Average number of male anal sex partners in lifetime (males 18+)
Sexual Behavior - Average age people first performed oral sex on a man (18+)
Sexual Behavior - Average number of male oral sex partners in lifetime (18+)
Sexual Behavior - People using protection when performing oral sex (%)
Sexual Behavior - Average number of times people have vaginal or anal sex a year
Sexual Behavior - People having sex without condom (%)
Sexual Behavior - Average number of male sex partners in lifetime (females 18+)
Sexual Behavior - Average number of male vaginal sex partners in lifetime (females 18+)
Sexual Behavior - Average number of female sex partners in lifetime (females 18+)
Sexual Behavior - Circumcised males 18+ (%)
Sleep Disorders - Average hours sleeping at night
Sleep Disorders - People that has trouble sleeping (%)
Smoking-Cigarette Use - People smoking cigarettes (%)
Taste & Smell - People 40+ having problems with smell (%)
Taste & Smell - People 40+ having problems with taste (%)
Taste & Smell - People 40+ that ever had wisdom teeth removed (%)
Taste & Smell - People 40+ that ever had tonsils teeth removed (%)
Taste & Smell - People 40+ that ever had a loss of consciousness because of a head injury (%)
Taste & Smell - People 40+ that ever had a broken nose or other serious injury to face or skull (%)
Taste & Smell - People 40+ that ever had two or more sinus infections (%)
Weight - Average height (inches)
Weight - Average weight (pounds)
Weight - Average BMI
Weight - People that are obese (%)
Weight - People that ever were obese (%)
Weight - People trying to lose weight (%)
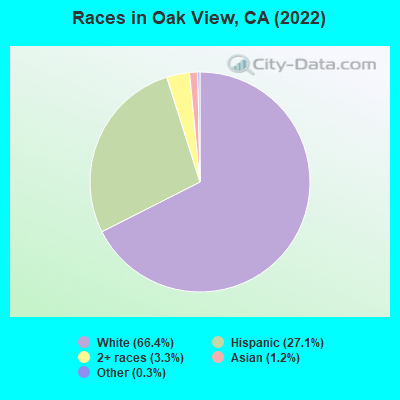
4,244 66.4% White alone 1,731 27.1% Hispanic 210 3.3% Two or more races 76 1.2% Asian alone 17 0.3% Other race alone 5 0.08% Black alone
Latest news from Oak View, CA collected exclusively by city-data.com from local newspapers, TV, and radio stations
Ancestries: English (11.7%), Irish (10.6%), American (9.3%), Scandinavian (5.0%), German (4.0%), Scottish (3.4%).
Current Local Time:
Land area: 1.95 square miles.
Population density: 2,085 people per square mile (low).
445 residents are foreign born (5.2% Latin America , 1.2% Europe ).
This place:
7.0%California:
26.5%
Median real estate property taxes paid for housing units with mortgages in 2022: $6,065 (0.8%)Median real estate property taxes paid for housing units with no mortgage in 2022: $4,219 (0.6%)
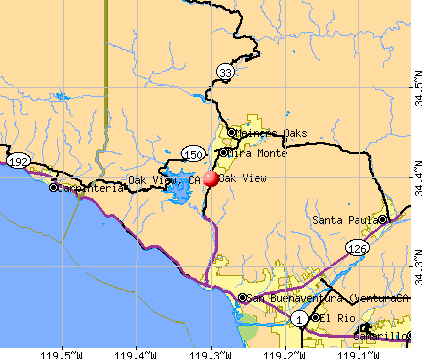
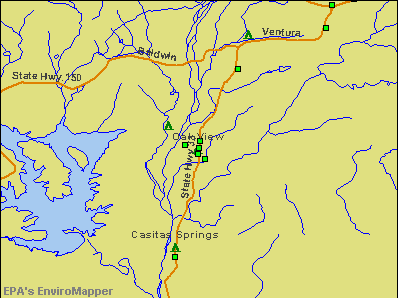
Nearest city with pop. 50,000+: Ventura, CA
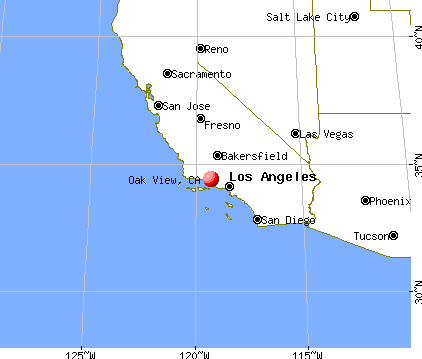
Nearest city with pop. 200,000+: Los Angeles, CA
Nearest cities:
Latitude: 34.40 N, Longitude: 119.30 W
Area code commonly used in this area: 805
Unemployment in December 2023:
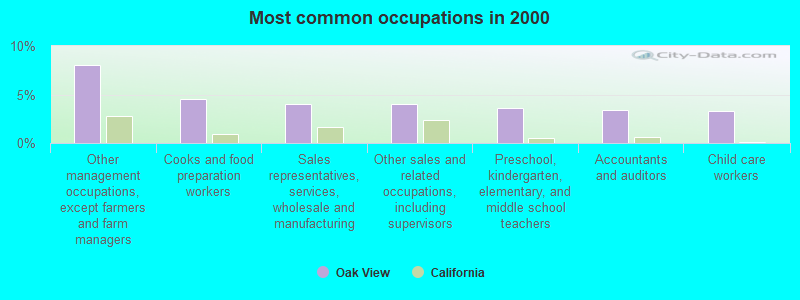
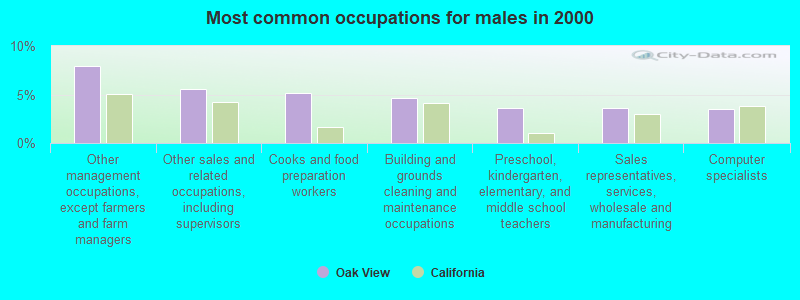
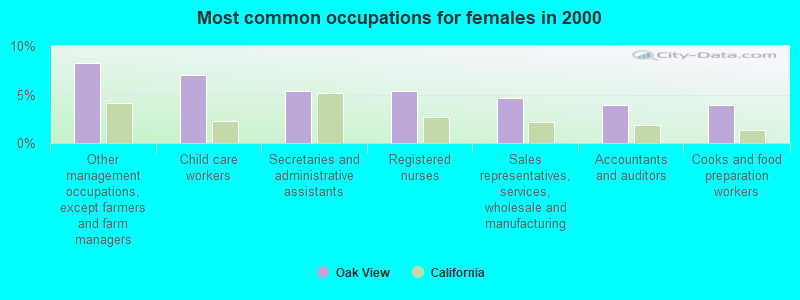
Most common occupations in Oak View, CA (%)
Both Males Females
Other management occupations, except farmers and farm managers (8.0%)
Cooks and food preparation workers (4.6%)
Sales representatives, services, wholesale and manufacturing (4.1%)
Other sales and related occupations, including supervisors (4.0%)
Preschool, kindergarten, elementary, and middle school teachers (3.6%)
Accountants and auditors (3.4%)
Child care workers (3.3%)
Other management occupations, except farmers and farm managers (7.9%)
Other sales and related occupations, including supervisors (5.6%)
Cooks and food preparation workers (5.2%)
Building and grounds cleaning and maintenance occupations (4.6%)
Preschool, kindergarten, elementary, and middle school teachers (3.6%)
Sales representatives, services, wholesale and manufacturing (3.6%)
Computer specialists (3.5%)
Other management occupations, except farmers and farm managers (8.2%)
Child care workers (7.0%)
Secretaries and administrative assistants (5.3%)
Registered nurses (5.3%)
Sales representatives, services, wholesale and manufacturing (4.6%)
Accountants and auditors (3.9%)
Cooks and food preparation workers (3.9%)
Earthquake activity:
Oak View-area historical earthquake activity is significantly above California state average. It is 6775% greater than the overall U.S. average. On 7/21/1952 at 11:52:14, a magnitude 7.7 (7.7 UK, Class: Major, Intensity: VIII - XII) earthquake occurred 45.0 miles away from Oak View center, causing $50,000,000 total damage On 11/4/1927 at 13:51:53, a magnitude 7.5 (7.5 UK) earthquake occurred 104.8 miles away from the city center On 6/28/1992 at 11:57:34, a magnitude 7.6 (6.2 MB, 7.6 MS, 7.3 MW, Depth: 0.7 mi) earthquake occurred 158.9 miles away from Oak View center, causing 3 deaths ( 1 shaking deaths, 2 other deaths) and 400 injuries, causing $100,000,000 total damage and $40,000,000 insured lossesOn 10/16/1999 at 09:46:44, a magnitude 7.4 (6.3 MB, 7.4 MS, 7.2 MW, 7.3 ML) earthquake occurred 163.6 miles away from Oak View center On 1/17/1994 at 12:30:55, a magnitude 6.8 (6.4 MB, 6.8 MS, 6.7 MW, Depth: 11.4 mi, Class: Strong, Intensity: VII - IX) earthquake occurred 44.7 miles away from the city center, causing 60 deaths ( 60 shaking deaths) and 7000 injuriesOn 4/18/1906 at 13:12:21, a magnitude 7.9 (7.9 UK) earthquake occurred 323.6 miles away from the city center, causing $524,000,000 total damage Magnitude types: body-wave magnitude (MB), local magnitude (ML), surface-wave magnitude (MS), moment magnitude (MW) Natural disasters: The number of natural disasters in Ventura County (36) is a lot greater than the US average (15).Major Disasters (Presidential) Declared: 24Emergencies Declared: 2Fires: 17, Floods: 16, Storms: 10, Landslides: 5, Mudslides: 4, Winter Storms: 4, Freezes: 2, Heavy Rains: 2, Earthquake: 1, Hurricane: 1, Snow: 1, Tornado: 1, Wind: 1, Other: 1 (Note: some incidents may be assigned to more than one category). Hospitals and medical centers near Oak View: OJAI VALLEY COMMUNITY HOSPITAL (about 4 miles away; OJAI, CA)
LOS ROBLES CARE CENTER (Nursing Home, about 6 miles away; OJAI, CA)
ST JOSEPHS HEALTH AND RETIREMENT CENTER (Nursing Home, about 7 miles away; OJAI, CA)
CPC VISTA DEL MAR HOSP (Nursing Home, about 7 miles away; VENTURA, CA)
DAVITA-DIALYSIS CENTER OF VENTURA (Dialysis Facility, about 9 miles away; VENTURA, CA)
VENTURA COUNTY MEDICAL CENTER (about 9 miles away; VENTURA, CA)
COMMUNITY MEMORIAL HOSPITAL SAN BUENAVENTURA (about 9 miles away; VENTURA, CA)
Amtrak stations near Oak View: 9 miles: VENTURA (HARBOR BLVD. & FIGUEROA ST.) Services: public payphones, call for taxi service.
13 miles: CARPINTERIA (5TH ST. & LINDEN AVE.) Services: fully wheelchair accessible, public payphones, full-service food facilities, free short-term parking, free long-term parking, call for taxi service.
14 miles: SANTA PAULA (245 S. PALM AVE.) - Bus Station Services: fully wheelchair accessible, public payphones, full-service food facilities, public transit connection.
Colleges/universities with over 2000 students nearest to Oak View:
Ventura College (about 10 miles; Ventura, CA ; Full-time enrollment: 8,460)
Oxnard College (about 19 miles; Oxnard, CA ; FT enrollment: 3,879)
California State University-Channel Islands (about 22 miles; Camarillo, CA ; FT enrollment: 4,163)
Santa Barbara City College (about 23 miles; Santa Barbara, CA ; FT enrollment: 12,568)
California Lutheran University (about 27 miles; Thousand Oaks, CA ; FT enrollment: 4,103)
Moorpark College (about 28 miles; Moorpark, CA ; FT enrollment: 9,338)
University of California-Santa Barbara (about 32 miles; Santa Barbara, CA ; FT enrollment: 22,806)
Public elementary/middle school in Oak View: SUNSET ELEMENTARY Location: 400 SUNSET AVE., Grades: KG-8)
Ventura County has a predicted average indoor radon screening level greater than 4 pCi/L (pico curies per liter) - Highest Potential Drinking water stations with addresses in Oak View and their reported violations in the past:
CASITAS MUTUAL WATER COMPANY (Population served: 229, Groundwater):
Past monitoring violations:
Monitoring, Repeat Major (TCR) - In DEC-2010, Contaminant: Coliform (TCR). Follow-up actions: St AO (w/o penalty) issued (FEB-07-2011)
One routine major monitoring violation
Average household size: This place:
2.9 peopleCalifornia:
2.9 people
Percentage of family households: This place:
72.9%Whole state:
68.7%
Percentage of households with unmarried partners: This place:
8.2%Whole state:
7.2%
Likely homosexual households (counted as self-reported same-sex unmarried-partner households)
Lesbian couples: 0.5% of all households Gay men: 0.4% of all households
Banks with branches in Oak View (2011 data):
Rabobank, National Association: Oak View Branch at 410 North Ventura Avenue, branch established on 1985/03/25. Info updated 2011/01/27: Bank assets: $11,745.0 mil, Deposits: $8,446.0 mil, headquarters in Roseville, CA, positive income , Agricultural Specialization, 124 total offices , Holding Company: Cooperatieve Centrale Raiffeisen-Boerenleenbank B.A., "rabobank Nederland
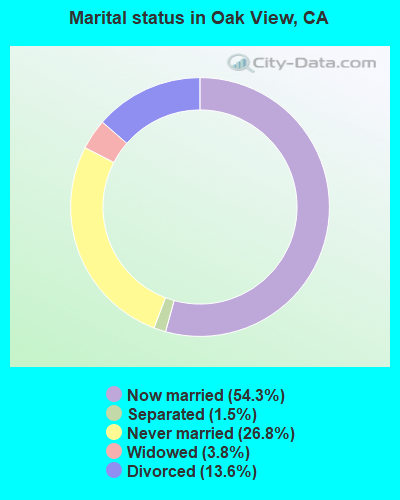
For population 15 years and over in Oak View:
Never married: 26.8%Now married: 54.3%Separated: 1.5%Widowed: 3.8%Divorced: 13.6% For population 25 years and over in Oak View:
High school or higher: 88.0%Bachelor's degree or higher: 29.1%Graduate or professional degree: 9.9%Unemployed: 6.3%Mean travel time to work (commute): 23.9 minutes
Education Gini index (Inequality in education) Here:
10.9California average:
15.5
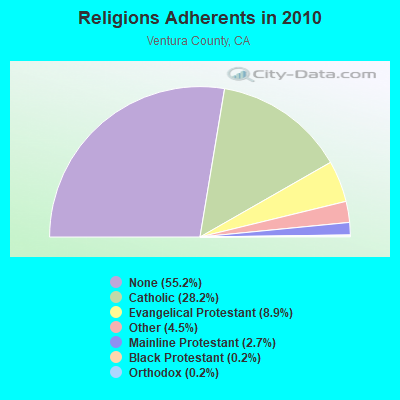
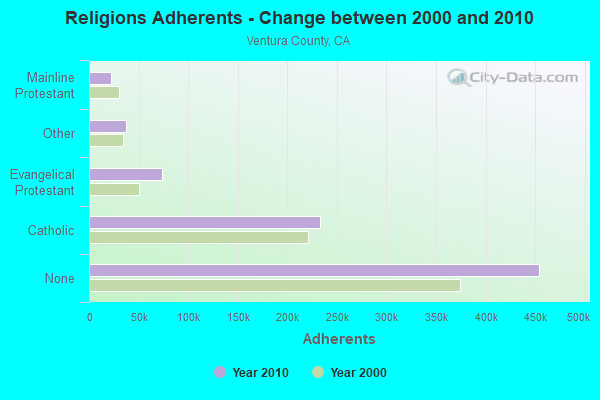
Religion statistics for Oak View, CA (based on Ventura County data)
Religion Adherents Congregations Catholic 232,571 20 Evangelical Protestant 73,341 268 Other 37,398 118 Mainline Protestant 22,006 65 Black Protestant 1,986 4 Orthodox 1,680 7 None 454,336 -
Source: Clifford Grammich, Kirk Hadaway, Richard Houseal, Dale E.Jones, Alexei Krindatch, Richie Stanley and Richard H.Taylor. 2012. 2010 U.S.Religion Census: Religious Congregations & Membership Study. Association of Statisticians of American Religious Bodies. Jones, Dale E., et al. 2002. Congregations and Membership in the United States 2000. Nashville, TN: Glenmary Research Center. Graphs represent county-level data
Food Environment Statistics: Number of grocery stores : 156Ventura County :
1.97 / 10,000 pop.California :
2.14 / 10,000 pop.
Number of supercenters and club stores : 4Here :
0.05 / 10,000 pop.State :
0.04 / 10,000 pop.
Number of convenience stores (no gas) : 45Ventura County :
0.57 / 10,000 pop.California :
0.62 / 10,000 pop.
Number of convenience stores (with gas) : 134This county :
1.69 / 10,000 pop.California :
1.49 / 10,000 pop.
Number of full-service restaurants : 577Ventura County :
7.28 / 10,000 pop.California :
7.42 / 10,000 pop.
Adult obesity rate : Ventura County :
23.1%California :
21.3%
Low-income preschool obesity rate : Health and Nutrition: Healthy diet rate : Oak View:
47.0%California:
49.4%
Average overall health of teeth and gums : People feeling badly about themselves : Here:
22.9%California:
20.2%
People not drinking alcohol at all : Average hours sleeping at night : This city:
6.7California:
6.8
Overweight people : Oak View:
33.9%State:
31.5%
General health condition : Oak View:
54.7%State:
56.4%
Average condition of hearing : Oak View:
78.7%California:
80.9%
More about Health and Nutrition of Oak View, CA Residents
4.96% of this county's 2021 resident taxpayers lived in other counties in 2020 ($110,211 average adjusted gross income )
Here:
4.96%California average:
5.19%
0.03% of residents moved from foreign countries ($345 average AGI )Ventura County:
0.03%California average:
0.03%
Top counties from which taxpayers relocated into this county between 2020 and 2021:
5.51% of this county's 2020 resident taxpayers moved to other counties in 2021 ($95,405 average adjusted gross income )
Here:
5.51%California average:
6.14%
0.02% of residents moved to foreign countries ($247 average AGI )Ventura County:
0.02%California average:
0.02%
Top counties to which taxpayers relocated from this county between 2020 and 2021: Businesses in Oak View, CA
Strongest AM radio stations in Oak View:
KOXR (910 AM; 5 kW; OXNARD, CA; Owner: LAZER BROADCASTING CORPORATION)
KACD (850 AM; 25 kW; THOUSAND OAKS, CA; Owner: CITICASTERS LICENSES, L.P.)
KSPN (710 AM; 50 kW; LOS ANGELES, CA; Owner: KABC-AM RADIO, INC.)
KUNX (1590 AM; 5 kW; VENTURA, CA; Owner: GOLD COAST BROADCASTING LLC)
KVTA (1520 AM; 10 kW; PORT HUENEME, CA; Owner: GOLD COAST BROADCASTING LLC)
KGDP (660 AM; 50 kW; ORCUTT, CA; Owner: RADIO REPRESENTATIVES, INC.)
KLAC (570 AM; 50 kW; LOS ANGELES, CA; Owner: AMFM RADIO LICENSES, L.L.C.)
KIRN (670 AM; 35 kW; SIMI VALLEY, CA; Owner: LOTUS OXNARD CORP.)
KFWB (980 AM; 50 kW; LOS ANGELES, CA; Owner: INFINITY BROADCASTING OPERATIONS, INC.)
KFI (640 AM; 50 kW; LOS ANGELES, CA; Owner: CAPSTAR TX LIMITED PARTNERSHIP)
KNX (1070 AM; 50 kW; LOS ANGELES, CA; Owner: INFINITY BROADCASTING OPERATIONS, INC.)
KTMS (990 AM; 5 kW; SANTA BARBARA, CA; Owner: CITICASTERS LICENSES, L.P.)
KSUR (1260 AM; 25 kW; BEVERLY HILLS, CA)
Strongest FM radio stations in Oak View:
KCAQ (104.7 FM; OXNARD, CA; Owner: GOLD COAST BROADCASTING LLC)
KOCP (95.9 FM; CAMARILLO, CA; Owner: GOLD COAST BROADCASTING LLC)
K271AC (102.1 FM; OJAI, CA; Owner: SANTA MONICA COMMUNITY COLLEGE DIST.)
KFYV (105.5 FM; OJAI, CA; Owner: GOLD COAST BROADCASTING LLC)
KHAY (100.7 FM; VENTURA, CA; Owner: CUMULUS LICENSING CORP.)
KLFH (89.5 FM; OJAI, CA; Owner: SHEPHERD COMMUNICATIONS, INC.)
KMRO (90.3 FM; CAMARILLO, CA; Owner: THE ASSOCIATION FOR COMMUNITY EDUCATION, INC.)
KCPB (91.1 FM; THOUSAND OAKS, CA; Owner: UNIVERSITY OF SOUTHERN CALIFORNIA)
KDAR (98.3 FM; OXNARD, CA; Owner: ATEP RADIO, INC.)
KSSC (107.1 FM; VENTURA, CA; Owner: ENTRAVISION HOLDINGS, LLC)
K210CH (89.9 FM; OAK VIEW, CA; Owner: LIFE ON THE WAY COMMUNICATIONS, INC.)
KMLA (103.7 FM; EL RIO, CA; Owner: GOLD COAST RADIO, L.L.C.)
KFYV-FM1 (105.5 FM; OAK VIEW, CA; Owner: BUENA VENTURA, INC.)
K254AH (98.7 FM; ISLA VISTA, CA; Owner: PACIFICA FOUNDATION, INC.)
KCZN (96.7 FM; SANTA PAULA, CA; Owner: LAZER BROADCASTING CORPORATION)
K272DI (102.3 FM; FILLMORE, CA; Owner: SANTA MONICA COMMUNITY COLLEGE DIST.)
K293AG (106.5 FM; TAFT, CA; Owner: CENTRO CRISTIANO DE FE, INC.)
KRAZ (105.9 FM; SANTA YNEZ, CA; Owner: KNIGHT BROADCASTING, INC.)
KRUZ (103.3 FM; SANTA BARBARA, CA; Owner: CUMULUS LICENSING CORP.)
KSPE-FM (94.5 FM; ELLWOOD, CA; Owner: CITICASTERS LICENSES, L.P.)
TV broadcast stations around Oak View:
KJLA (Channel 57; VENTURA, CA; Owner: KJLA, LLC)
KTRO-LP (Channel 50; LANCASTER, CA; Owner: ROBERT D. ADELMAN)
KADY-TV (Channel 63; OXNARD, CA; Owner: BILTMORE BROADCASTING, L.L.C.)
K45DU (Channel 45; VENTURA, CA; Owner: TRINITY BROADCASTING NETWORK)
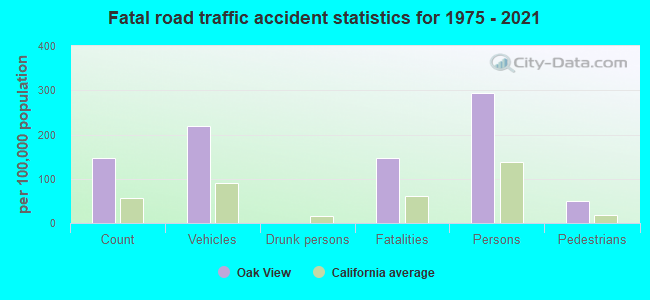
Oak View fatal accident statistics for 1975 - 2021
Oak View fatal accident list:
Jul 10, 2021 00:10 AM, Sr-33 N Ventura Ave, Lat: 34.405325, Lon: -119.299575, Vehicles: 1, Persons: 1, Fatalities: 1Lat: 34.392881, Lon: -119.301175, Vehicles: 1, Persons: 2, Pedestrians: 1, Fatalities: 1Lat: 34.385667, Lon: -119.302142, Vehicles: 2, Persons: 2, Fatalities: 1Lat: 34.402625, Lon: -119.283628, Vehicles: 1, Persons: 1, Pedestrians: 1, Fatalities: 1Lat: 34.387706, Lon: -119.301328, Vehicles: 2, Persons: 2, Fatalities: 1Lat: 34.385720, Lon: -119.302110, Vehicles: 2, Persons: 4, Fatalities: 1
National Bridge Inventory (NBI) Statistics 7 Number of bridges89ft / 26.7m Total length30,390 Total average daily traffic1,725 Total average daily truck traffic43,192 Total future (year 2036) average daily traffic
FCC Registered Private Land Mobile Towers: 1
8228 Sulpher Mountain Rd Sulpher Mountain (Lat: 34.404722 Lon: -119.246500), Structure height: 12 m, Call Sign: WNFL377, Licensee ID: L01744207, Assigned Frequencies: 856.162 MHz, 858.162 MHz, 860.162 MHz, Grant Date: 04/30/2011, Expiration Date: 07/22/2021, Cancellation Date: 08/06/2019, Certifier: Kyle B Entz, Registrant: Nextel West Corp. FCC Registered Broadcast Land Mobile Towers: 3
15 Kunkle St (Lat: 34.397222 Lon: -119.302333), Call Sign: KMD358, Assigned Frequencies: 154.010 MHz, 154.280 MHz, Grant Date: 02/15/2003, Expiration Date: 05/05/2013, Cancellation Date: 07/06/2013, Registrant: Holbrow And Associates, 3603 Castle Rock Road, Diamond Bar, CA 91765, Phone: (909) 595-3020, Email:
OAK VIEW SF, 485 N Ventura Avenue (Lat: 34.394722 Lon: -119.300556), Type: Pipe, Structure height: 6 m, Overall height: 12.1 m, Call Sign: WPXS882, Assigned Frequencies: 155.145 MHz, 155.535 MHz, 156.015 MHz, 156.150 MHz, 158.730 MHz, 159.210 MHz, 154.055 MHz, 158.745 MHz, 158.775 MHz, 158.940 MHz, Grant Date: 03/07/2023, Expiration Date: 06/04/2033, Certifier: Richard George, Registrant: Pegasus Telecommunications Consulting Group, Santa Maria, CA 93456-1608, Phone: (562) 370-7744, Email:
Lat: 34.402333 Lon: -119.299944, Call Sign: WRPM326, Assigned Frequencies: 464.037 MHz, 469.037 MHz, 469.112 MHz, 469.162 MHz, 464.112 MHz, Grant Date: 02/23/2022, Expiration Date: 02/23/2032, Certifier: Greg A Romey, Registrant: Business Radio Licensing, 30251 Golden Lantern, Suite E, Laguna Niguel, CA 92677, Phone: (949) 348-8510, Fax: (949) 348-8514, Email:
FCC Registered Microwave Towers: 3
CASITAS WATER DISTRI, Various Locations (Lat: 34.401639 Lon: -119.299000), Overall height: 2.4 m, Call Sign: WPOT765, Assigned Frequencies: 956.281 MHz, Grant Date: 03/29/2019, Expiration Date: 05/13/2029, Registrant: Atlas License Company & Data Services, 176 West Logan Street, Ste. 227, Noblesville, IN 46060, Phone: (317) 813-4865, Fax: (317) 900-7940, Email:
Oak View, 655 Burnham Road (Lat: 34.413000 Lon: -119.311056), Type: Pole, Structure height: 25 m, Call Sign: WQBI545, Assigned Frequencies: 11285.0 MHz, Grant Date: 09/09/2014, Expiration Date: 10/14/2024, Certifier: John T Scott Iii, Registrant: Los Angeles Smsa Limited Partnership, 5055 North Point Pkwy, Np2ne Network Engineering, Alpharetta, GA 30022, Phone: (770) 797-1070, Fax: (770) 797-1036, Email:
Red Mountain, Off Mill Canyon Rd (Lat: 34.348611 Lon: -119.337889), Type: Ltower, Structure height: 61 m, Call Sign: WQKU419, Assigned Frequencies: 17965.0 MHz, 18065.0 MHz, 17965.0 MHz, 18065.0 MHz, 17965.0 MHz, 18065.0 MHz, 17815.0 MHz, 17965.0 MHz, 17815.0 MHz, 17965.0 MHz... (+9 more), Grant Date: 08/31/2019, Expiration Date: 09/15/2029, Certifier: Michael Connors, Registrant: Micronet Communications, Inc., 812 Lexington Dr, Plano, TX 75075, Phone: (972) 422-7200, Email:
FCC Registered Amateur Radio Licenses: 40 (
See the full list of FCC Registered Amateur Radio Licenses in Oak View )
FAA Registered Aircraft: 9 (
See the full list of FAA Registered Aircraft in Oak View )
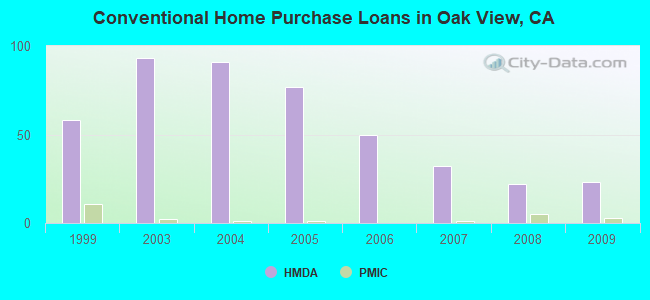
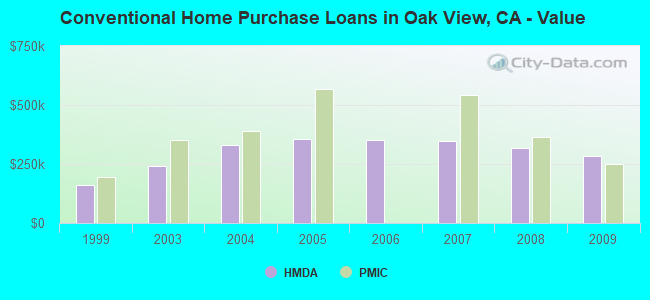
Home Mortgage Disclosure Act Aggregated Statistics For Year 2009(Based on 2 partial tracts) A) FHA, FSA/RHS & VA B) Conventional C) Refinancings D) Home Improvement Loans F) Non-occupant Loans on G) Loans On Manufactured Number Average Value Number Average Value Number Average Value Number Average Value Number Average Value Number Average Value
LOANS ORIGINATED 17 $315,679 23 $282,020 79 $283,570 4 $228,090 7 $259,643 0 $0 APPLICATIONS APPROVED, NOT ACCEPTED 4 $345,890 2 $404,235 13 $339,406 0 $0 1 $147,700 1 $104,150 APPLICATIONS DENIED 2 $455,325 5 $192,102 27 $331,256 2 $180,750 5 $196,454 1 $171,640 APPLICATIONS WITHDRAWN 1 $230,530 3 $359,130 20 $312,968 1 $274,980 2 $262,625 0 $0 FILES CLOSED FOR INCOMPLETENESS 0 $0 0 $0 5 $304,650 0 $0 0 $0 0 $0
Aggregated Statistics For Year 2008(Based on 2 partial tracts) A) FHA, FSA/RHS & VA B) Conventional C) Refinancings D) Home Improvement Loans E) Loans on Dwellings For 5+ Families F) Non-occupant Loans on G) Loans On Manufactured Number Average Value Number Average Value Number Average Value Number Average Value Number Average Value Number Average Value Number Average Value
LOANS ORIGINATED 2 $376,580 22 $318,401 37 $331,675 4 $177,755 1 $458,600 6 $380,738 2 $130,725 APPLICATIONS APPROVED, NOT ACCEPTED 0 $0 6 $443,282 6 $323,783 1 $124,050 0 $0 2 $274,315 0 $0 APPLICATIONS DENIED 2 $395,095 12 $397,348 20 $320,119 2 $28,910 0 $0 5 $342,946 1 $33,480 APPLICATIONS WITHDRAWN 2 $263,380 1 $499,670 11 $351,495 2 $50,485 0 $0 2 $205,890 0 $0 FILES CLOSED FOR INCOMPLETENESS 1 $220,000 1 $193,430 4 $634,520 0 $0 0 $0 0 $0 0 $0
Aggregated Statistics For Year 2007(Based on 2 partial tracts) B) Conventional C) Refinancings D) Home Improvement Loans F) Non-occupant Loans on G) Loans On Manufactured Number Average Value Number Average Value Number Average Value Number Average Value Number Average Value
LOANS ORIGINATED 32 $348,077 87 $366,031 12 $270,492 11 $375,625 6 $130,383 APPLICATIONS APPROVED, NOT ACCEPTED 4 $296,600 26 $369,728 3 $336,580 3 $495,973 1 $91,340 APPLICATIONS DENIED 9 $384,673 67 $412,601 5 $152,182 4 $383,655 4 $153,650 APPLICATIONS WITHDRAWN 6 $385,710 30 $420,948 3 $193,903 5 $484,714 0 $0 FILES CLOSED FOR INCOMPLETENESS 2 $311,660 12 $420,603 1 $221,590 1 $217,630 1 $43,570
Aggregated Statistics For Year 2006(Based on 2 partial tracts) B) Conventional C) Refinancings D) Home Improvement Loans F) Non-occupant Loans on G) Loans On Manufactured Number Average Value Number Average Value Number Average Value Number Average Value Number Average Value
LOANS ORIGINATED 50 $353,318 122 $354,836 15 $272,244 20 $384,441 5 $169,064 APPLICATIONS APPROVED, NOT ACCEPTED 10 $426,283 21 $332,343 4 $625,810 2 $332,130 1 $117,510 APPLICATIONS DENIED 19 $332,473 46 $436,002 12 $236,862 8 $427,381 4 $80,410 APPLICATIONS WITHDRAWN 6 $388,565 44 $379,415 7 $221,217 2 $298,405 2 $130,460 FILES CLOSED FOR INCOMPLETENESS 0 $0 9 $401,588 2 $93,185 1 $156,240 0 $0
Aggregated Statistics For Year 2005(Based on 2 partial tracts) B) Conventional C) Refinancings D) Home Improvement Loans F) Non-occupant Loans on G) Loans On Manufactured Number Average Value Number Average Value Number Average Value Number Average Value Number Average Value
LOANS ORIGINATED 77 $357,602 156 $339,852 24 $232,659 21 $316,137 4 $122,222 APPLICATIONS APPROVED, NOT ACCEPTED 11 $391,113 24 $382,495 1 $44,110 2 $397,380 1 $52,520 APPLICATIONS DENIED 23 $381,327 50 $374,939 6 $197,367 8 $422,325 1 $85,560 APPLICATIONS WITHDRAWN 17 $355,650 47 $327,966 7 $237,486 2 $392,200 0 $0 FILES CLOSED FOR INCOMPLETENESS 4 $362,728 21 $367,122 3 $277,417 2 $354,325 0 $0
Aggregated Statistics For Year 2004(Based on 2 partial tracts) B) Conventional C) Refinancings D) Home Improvement Loans F) Non-occupant Loans on G) Loans On Manufactured Number Average Value Number Average Value Number Average Value Number Average Value Number Average Value
LOANS ORIGINATED 91 $330,512 166 $284,005 22 $181,576 17 $288,586 7 $66,977 APPLICATIONS APPROVED, NOT ACCEPTED 11 $300,792 27 $252,338 3 $142,353 3 $229,043 2 $219,285 APPLICATIONS DENIED 13 $341,201 37 $278,776 12 $116,777 4 $247,222 4 $149,268 APPLICATIONS WITHDRAWN 19 $295,976 58 $261,469 6 $193,205 3 $249,790 5 $70,560 FILES CLOSED FOR INCOMPLETENESS 2 $300,505 10 $276,694 2 $190,285 1 $295,510 1 $103,210
Aggregated Statistics For Year 2003(Based on 2 partial tracts) B) Conventional C) Refinancings D) Home Improvement Loans F) Non-occupant Loans on Number Average Value Number Average Value Number Average Value Number Average Value
LOANS ORIGINATED 93 $241,173 378 $225,937 5 $48,772 25 $195,755 APPLICATIONS APPROVED, NOT ACCEPTED 8 $256,156 46 $213,657 4 $138,675 2 $221,020 APPLICATIONS DENIED 16 $236,231 55 $238,895 4 $18,090 3 $170,453 APPLICATIONS WITHDRAWN 15 $219,222 60 $218,236 2 $28,450 4 $318,852 FILES CLOSED FOR INCOMPLETENESS 4 $283,835 11 $238,680 1 $24,980 1 $242,720
Aggregated Statistics For Year 1999(Based on 1 partial tract) A) FHA, FSA/RHS & VA B) Conventional C) Refinancings D) Home Improvement Loans F) Non-occupant Loans on Number Average Value Number Average Value Number Average Value Number Average Value Number Average Value
LOANS ORIGINATED 10 $144,170 58 $160,239 81 $163,219 13 $33,772 10 $132,890 APPLICATIONS APPROVED, NOT ACCEPTED 0 $0 7 $175,034 17 $155,152 3 $21,340 2 $118,520 APPLICATIONS DENIED 2 $88,415 9 $139,101 24 $127,240 3 $47,003 1 $248,860 APPLICATIONS WITHDRAWN 1 $213,030 9 $148,713 33 $147,347 2 $14,865 1 $176,830 FILES CLOSED FOR INCOMPLETENESS 0 $0 1 $201,600 6 $167,367 0 $0 0 $0
Detailed HMDA statistics for the following Tracts:
0011.01
, 0011.02
Private Mortgage Insurance Companies Aggregated Statistics For Year 2009(Based on 2 partial tracts) A) Conventional B) Refinancings Number Average Value Number Average Value
LOANS ORIGINATED 3 $249,237 1 $146,670 APPLICATIONS APPROVED, NOT ACCEPTED 1 $365,600 1 $191,300 APPLICATIONS DENIED 1 $143,480 0 $0 APPLICATIONS WITHDRAWN 0 $0 0 $0 FILES CLOSED FOR INCOMPLETENESS 1 $194,490 0 $0
Aggregated Statistics For Year 2008(Based on 2 partial tracts) A) Conventional B) Refinancings C) Non-occupant Loans on Number Average Value Number Average Value Number Average Value
LOANS ORIGINATED 5 $365,344 2 $301,835 1 $113,190 APPLICATIONS APPROVED, NOT ACCEPTED 2 $323,355 0 $0 1 $142,420 APPLICATIONS DENIED 1 $207,250 0 $0 0 $0 APPLICATIONS WITHDRAWN 0 $0 1 $190,240 1 $190,240 FILES CLOSED FOR INCOMPLETENESS 0 $0 0 $0 0 $0
Aggregated Statistics For Year 2007(Based on 2 partial tracts) A) Conventional B) Refinancings C) Non-occupant Loans on Number Average Value Number Average Value Number Average Value
LOANS ORIGINATED 1 $543,610 3 $553,117 0 $0 APPLICATIONS APPROVED, NOT ACCEPTED 1 $172,170 1 $239,660 1 $172,170 APPLICATIONS DENIED 0 $0 0 $0 0 $0 APPLICATIONS WITHDRAWN 0 $0 1 $263,040 0 $0 FILES CLOSED FOR INCOMPLETENESS 0 $0 0 $0 0 $0
Aggregated Statistics For Year 2006(Based on 1 partial tract) B) Refinancings C) Non-occupant Loans on Number Average Value Number Average Value
LOANS ORIGINATED 1 $543,090 1 $248,700 APPLICATIONS APPROVED, NOT ACCEPTED 0 $0 0 $0 APPLICATIONS DENIED 0 $0 0 $0 APPLICATIONS WITHDRAWN 0 $0 0 $0 FILES CLOSED FOR INCOMPLETENESS 0 $0 0 $0
Aggregated Statistics For Year 2005(Based on 1 partial tract) A) Conventional B) Refinancings Number Average Value Number Average Value
LOANS ORIGINATED 1 $568,070 1 $488,360 APPLICATIONS APPROVED, NOT ACCEPTED 0 $0 0 $0 APPLICATIONS DENIED 0 $0 0 $0 APPLICATIONS WITHDRAWN 0 $0 0 $0 FILES CLOSED FOR INCOMPLETENESS 0 $0 0 $0
Aggregated Statistics For Year 2004(Based on 2 partial tracts) A) Conventional B) Refinancings C) Non-occupant Loans on Number Average Value Number Average Value Number Average Value
LOANS ORIGINATED 1 $390,580 1 $187,580 1 $187,050 APPLICATIONS APPROVED, NOT ACCEPTED 1 $276,260 1 $171,640 0 $0 APPLICATIONS DENIED 0 $0 0 $0 0 $0 APPLICATIONS WITHDRAWN 0 $0 0 $0 0 $0 FILES CLOSED FOR INCOMPLETENESS 0 $0 0 $0 0 $0
Aggregated Statistics For Year 2003(Based on 2 partial tracts) A) Conventional B) Refinancings Number Average Value Number Average Value
LOANS ORIGINATED 2 $350,895 3 $256,517 APPLICATIONS APPROVED, NOT ACCEPTED 0 $0 1 $257,730 APPLICATIONS DENIED 0 $0 1 $137,100 APPLICATIONS WITHDRAWN 0 $0 0 $0 FILES CLOSED FOR INCOMPLETENESS 0 $0 0 $0
Aggregated Statistics For Year 1999(Based on 1 partial tract) A) Conventional B) Refinancings Number Average Value Number Average Value
LOANS ORIGINATED 11 $193,253 7 $182,220 APPLICATIONS APPROVED, NOT ACCEPTED 2 $152,440 2 $197,790 APPLICATIONS DENIED 2 $174,925 0 $0 APPLICATIONS WITHDRAWN 0 $0 0 $0 FILES CLOSED FOR INCOMPLETENESS 0 $0 0 $0
Detailed PMIC statistics for the following Tracts:
0011.01
, 0011.02
Most common first names in Oak View, CA among deceased individuals Name Count Lived (average)
William 28 72.9 years Mary 27 75.0 years John 26 74.9 years James 25 72.3 years Robert 24 72.9 years George 19 75.7 years Charles 18 70.4 years Dorothy 18 78.2 years Richard 17 73.2 years Betty 15 71.1 years
Most common last names in Oak View, CA among deceased individuals Last name Count Lived (average)
Smith 22 73.1 years Thompson 9 76.1 years Wilson 8 80.9 years Davis 7 82.0 years Nelson 7 81.1 years Taylor 7 77.3 years Wood 7 76.7 years Campbell 6 75.4 years Coleman 6 72.2 years Miller 6 60.6 years
Oak View compared to California state average:
Unemployed percentage below state average. Black race population percentage significantly below state average. Median age above state average. Foreign-born population percentage significantly below state average. Renting percentage below state average. Length of stay since moving in significantly above state average.
Top Patent Applicants
Brad Scott Farrenkopf (3)
Steven Lee Herbruck (3)
Katherine Marks Sojka (2)
Richard L. Kendall (2)
Matthew I. Jerums (2)
Andrew R. Kiehl (1)
Neville Macaulife (1)
Matthew Jerums (1)
Jesse Vandiver (1)
Leslie Ann Karr (1)
Total of 18 patent applications in 2008-2024.


 Recent articles from our blog. Our writers, many of them Ph.D. graduates or candidates, create easy-to-read articles on a wide variety of topics.

 (8.6 miles


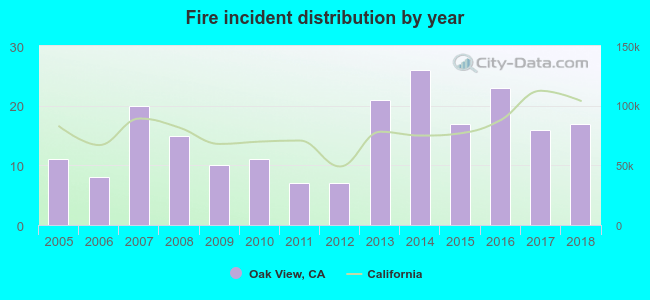 According to the data from the years 2005 - 2018 the average number of fire incidents per year is 15. The highest number of reported fires - 26 took place in 2014, and the least - 7 in 2011. The data has an increasing trend.
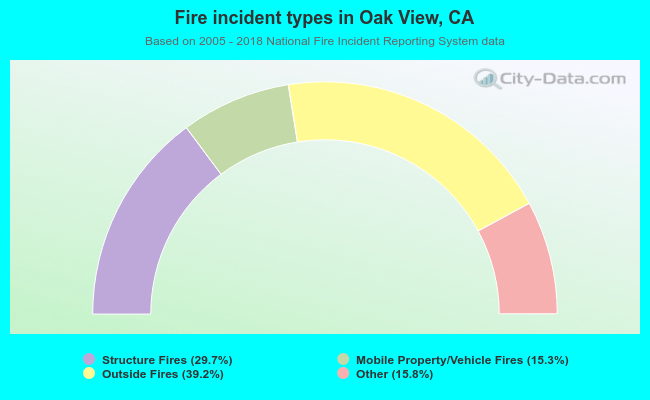 When looking into fire subcategories, the most reports belonged to: Outside Fires (39.2%), and Structure Fires (29.7%).