Bridgeview: Fire Incidents, Illinois (IL)
Where are fire incidents reported in Bridgeview, IL
Something went wrong! Please refresh the page.
| Fire incidents reported | |
|---|---|
| Sreet name | Count |
| HARLEM AVE | 1,162 |
| 71ST ST | 212 |
| 78TH AVE | 180 |
| 77TH AVE | 170 |
| 87TH ST | 162 |
| BELOIT AVE | 116 |
| 79TH ST | 110 |
| OKETO AVE | 104 |
| ROBERTS RD | 96 |
| THOMAS AVE | 74 |
| 76TH AVE | 72 |
| 77TH CT | 52 |
| 83RD ST | 48 |
| 82ND ST | 46 |
| HARLEM | 46 |
| ODELL | 46 |
| OLYMPIC DR | 46 |
| OCTAVIA | 42 |
| 79TH PL | 40 |
| 90TH ST | 40 |
| 75TH ST | 38 |
| OKETO | 36 |
| 100TH PL | 34 |
| 87TH PL | 34 |
| 91ST ST | 32 |
| 73RD ST | 28 |
| BELOIT | 28 |
| 80TH PL | 26 |
| 86TH ST | 26 |
| 93RD ST | 26 |
2002 - 2018 National Fire Incident Reporting System (NFIRS) incidents
- Incident types reported to NFIRS in Bridgeview, IL
- 12,16357.8%Rescue & EMS
- 2,30410.9%False Alarm
- 2,22210.6%Fire
- 1,8488.8%Hazardous Condition
- 1,6788.0%Good Intent Call
- 7923.8%Service Call
- 230.1%Overpressure Rupture
- Fire incident types reported to NFIRS in Bridgeview, IL
- 1,26056.7%Structure Fires
- 54324.4%Outside Fires
- 29313.2%Mobile Property/Vehicle Fires
- 1265.7%Other
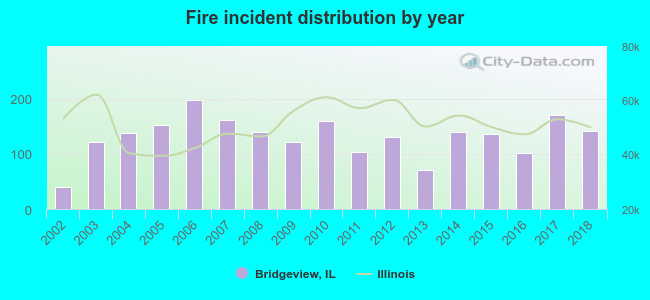 According to the data from the years 2002 - 2018 the average number of fire incidents per year is 131. The highest number of reported fires - 197 took place in 2006, and the least - 39 in 2002. The data has an increasing trend.
The average number of yearly fire incidents per 10k residents in Bridgeview, IL compared to nearest cities:
(Note: Based on data for the last 3 years, including only cities with population 5,000 and above)
| Bridgeview: | 83.7 |
| Justice: | 60.7 |
| Hickory Hills: | 40.0 |
| Burbank: | 31.9 |
| Chicago Ridge: | 54.5 |
| Palos Hills: | 37.6 |
| Summit: | 57.7 |
| Oak Lawn: | 33.4 |
| Willow Springs: | 46.1 |
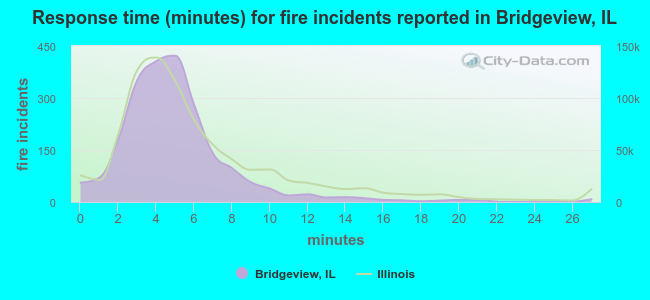 The median response time based on all reported fire incidents is 5 minutes. This is comparable to the state median value.
The median response time in Bridgeview, IL compared to nearest cities:
(Note: Based on data for all years, including only cities with at least 500 fire incidents)
| Bridgeview: | 5 minutes |
| Justice: | 4 minutes |
| Hickory Hills: | 4 minutes |
| Burbank: | 4 minutes |
| Bedford Park: | 5 minutes |
| Chicago Ridge: | 5 minutes |
| Palos Hills: | 4 minutes |
| Summit: | 5 minutes |
| Oak Lawn: | 5 minutes |
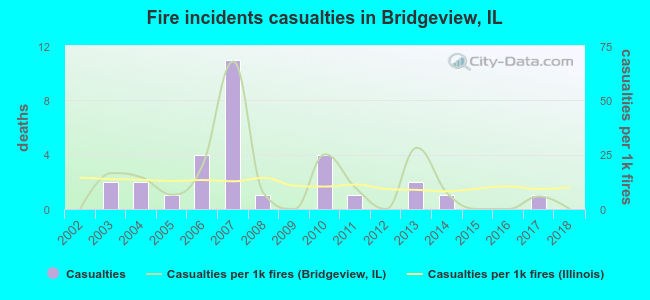 According to the data from the years 2002 - 2018 the average number of fire-related casualties per year is 2. The highest number of reported casualties - 11 took place in 2007, and the lowest - 0 in 2002. The data has a constant trend.
The average number of casualties per 1,000 fire incidents is 12. This indicator was the highest - 68 in 2007, and the lowest 0 in 2002. The trend for injuries per 1,000 incidents is constant. Compared to the Illinois value the number of injuries per 1,000 incidents is higher.
According to the data from the years 2002 - 2018 the average number of fire-related casualties per year is 2. The highest number of reported casualties - 11 took place in 2007, and the lowest - 0 in 2002. The data has a constant trend.
The average number of casualties per 1,000 fire incidents is 12. This indicator was the highest - 68 in 2007, and the lowest 0 in 2002. The trend for injuries per 1,000 incidents is constant. Compared to the Illinois value the number of injuries per 1,000 incidents is higher.Casualties per 1,000 incidents in Bridgeview, IL compared to nearest cities:
(Note: Based on data for all years, including only cities with at least 500 fire incidents)
| Bridgeview: | 13.5 |
| Justice: | 16.7 |
| Hickory Hills: | 21.9 |
| Burbank: | 18.2 |
| Bedford Park: | 4.4 |
| Chicago Ridge: | 6.1 |
| Palos Hills: | 12.1 |
| Summit: | 14.3 |
| Oak Lawn: | 10.6 |
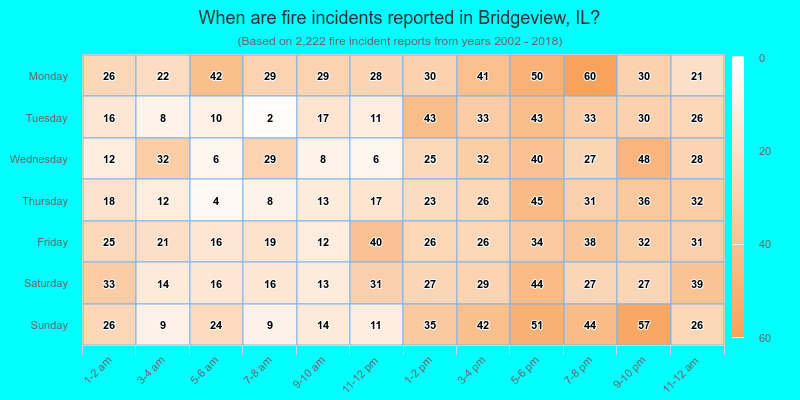
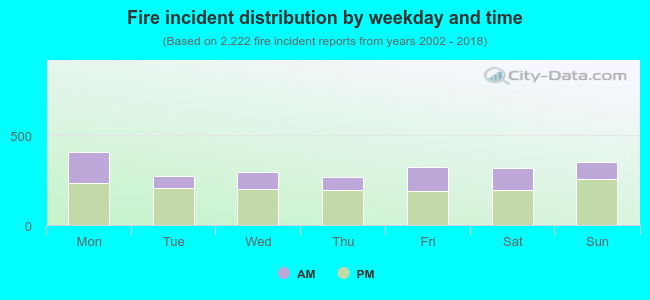 33.9% incidents where reported in the morning and 66.1% in the evening. The most fires (18.4%) took place on Monday, and the least (11.9%) on Thursday.
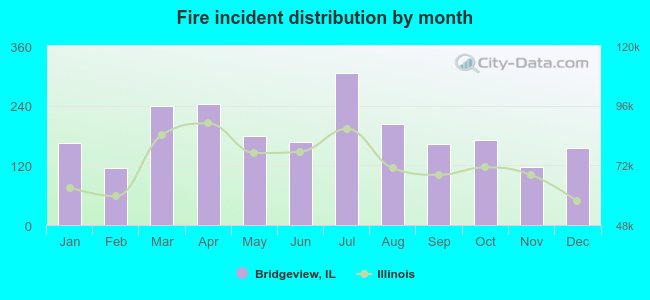 According to the 2,222 fire incident reports from years 2002 - 2018 most fires (13.8%) took place during July, and the least (5.2%) in February.
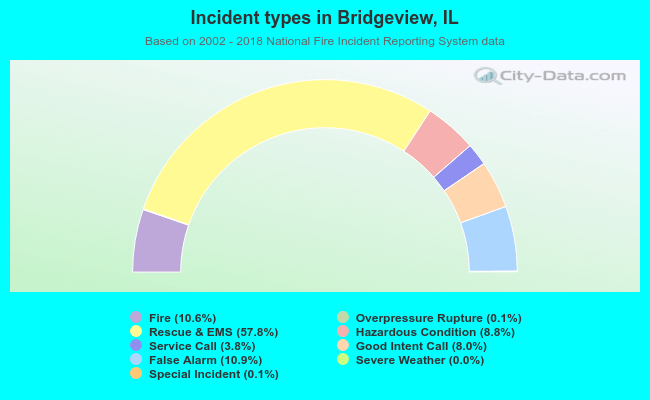 Out of all 21,053 cases reported during the years 2002 - 2018, the most belonged to the categories: Rescue & EMS (57.8%), False Alarm (10.9%), and Fire (10.6%).
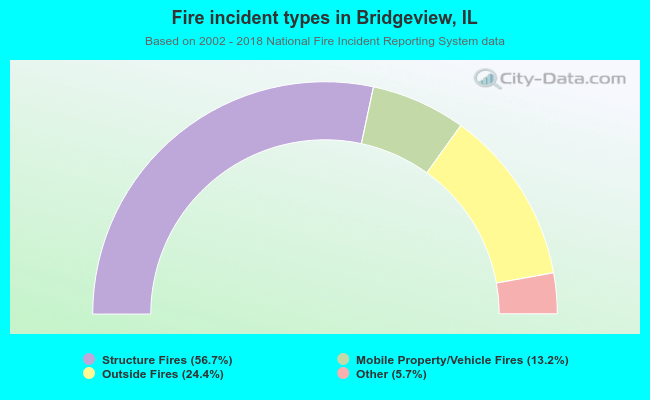 When looking into fire subcategories, the most incidents belonged to: Structure Fires (56.7%), and Outside Fires (24.4%).