Bullhead City: Fire Incidents, Arizona (AZ)
Where are fire incidents reported in Bullhead City, AZ
Something went wrong! Please refresh the page.
| Fire incidents reported | |
|---|---|
| Sreet name | Count |
| HWY 95 | 692 |
| HANCOCK RD | 148 |
| HWY 68 | 128 |
| RAMAR RD | 106 |
| BASELINE RD | 74 |
| MARINA BLVD | 72 |
| MIRACLE MILE | 70 |
| RIVERFRONT DR | 66 |
| BALBOA DR | 60 |
| LAKESIDE DR | 60 |
| RIVIERA BLVD | 58 |
| ARRIBA DR | 56 |
| MOSER AVE | 54 |
| SILVER CREEK RD | 54 |
| BULLHEAD PKY | 52 |
| HIGHWAY 95 | 52 |
| LEE AVE | 52 |
| MERRILL AVE | 40 |
| PALO VERDE DR | 40 |
| MCCORMICK BLVD | 36 |
| RIVERVIEW DR | 36 |
| CLEARWATER DR | 34 |
| LONG AVE | 34 |
| CAMINO DEL RIO | 32 |
| CORONADO DR | 32 |
| PLAZA DR | 32 |
| SEA BREEZE LANE | 32 |
| CHURCH ST | 30 |
| CITRUS ST | 30 |
| GOLDRUSH RD | 30 |
| Other | 514 |
2003 - 2018 National Fire Incident Reporting System (NFIRS) incidents
- Incident types reported to NFIRS in Bullhead City, AZ
- 2,80634.3%Fire
- 2,10025.7%Hazardous Condition
- 90211.0%Service Call
- 89911.0%Rescue & EMS
- 7539.2%Good Intent Call
- 6217.6%False Alarm
- 660.8%Severe Weather
- 270.3%Overpressure Rupture
- 130.2%Special Incident
- Fire incident types reported to NFIRS in Bullhead City, AZ
- 1,12440.1%Outside Fires
- 80228.6%Mobile Property/Vehicle Fires
- 76027.1%Structure Fires
- 1204.3%Other
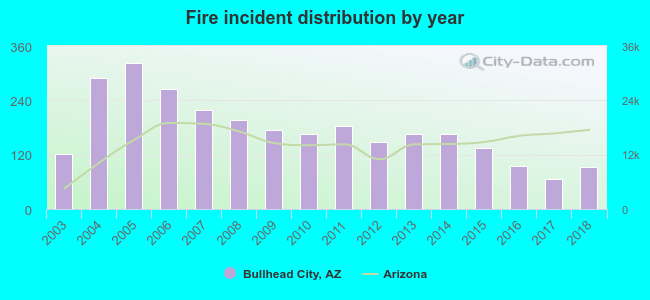 Based on the data from the years 2003 - 2018 the average number of fire incidents per year is 175. The highest number of fire incidents - 323 took place in 2005, and the least - 66 in 2017. The data has a decreasing trend.
The average number of yearly fire incidents per 10k residents in Bullhead City, AZ compared to nearest cities:
(Note: Based on data for the last 3 years, including only cities with population 5,000 and above)
| Bullhead City: | 21.4 |
| Fort Mohave: | 36.4 |
| Golden Valley: | 24.3 |
| Kingman: | 81.3 |
| Lake Havasu City: | 31.9 |
 The median response time based on all reported fire incidents is 5 minutes. This is close to the state median value.
The median response time in Bullhead City, AZ compared to nearest cities:
(Note: Based on data for all years, including only cities with at least 500 fire incidents)
| Bullhead City: | 5 minutes |
| Mohave Valley: | 7 minutes |
| Golden Valley: | 10 minutes |
| Kingman: | 5 minutes |
| Lake Havasu City: | 6 minutes |
 Based on the data from the years 2003 - 2018 the average number of fire-related yearly deaths is 1. The highest number of deaths - 2 took place in 2004, and the lowest - 0 in 2003. The data has a rising trend.
The average number of fatalities per 1,000 fires is 4. This indicator was the highest - 11 in 2011, and the lowest 0 in 2003. The trend for deaths per 1,000 incidents is rising. Compared to the state value the number of deaths per 1,000 fire incidents is much higher.
Based on the data from the years 2003 - 2018 the average number of fire-related yearly deaths is 1. The highest number of deaths - 2 took place in 2004, and the lowest - 0 in 2003. The data has a rising trend.
The average number of fatalities per 1,000 fires is 4. This indicator was the highest - 11 in 2011, and the lowest 0 in 2003. The trend for deaths per 1,000 incidents is rising. Compared to the state value the number of deaths per 1,000 fire incidents is much higher.Deaths per 1,000 incidents in Bullhead City, AZ compared to nearest cities:
(Note: Based on data for all years, including only cities with at least 2,500 fire incidents)
| Bullhead City: | 3.6 |
| Kingman: | 0.0 |
 Based on the reports from the years 2003 - 2018 the average number of fire-related casualties per year is 6. The highest number of reported injuries - 16 took place in 2004, and the lowest - 0 in 2008. The data has a declining trend.
The average number of injuries per 1,000 fire incidents is 33. This indicator was the highest - 60 in 2012, and the lowest 0 in 2008. The trend for injuries per 1,000 incidents is declining. Compared to the Arizona value the number of casualties per 1,000 incidents is much higher.
Based on the reports from the years 2003 - 2018 the average number of fire-related casualties per year is 6. The highest number of reported injuries - 16 took place in 2004, and the lowest - 0 in 2008. The data has a declining trend.
The average number of injuries per 1,000 fire incidents is 33. This indicator was the highest - 60 in 2012, and the lowest 0 in 2008. The trend for injuries per 1,000 incidents is declining. Compared to the Arizona value the number of casualties per 1,000 incidents is much higher.Casualties per 1,000 incidents in Bullhead City, AZ compared to nearest cities:
(Note: Based on data for all years, including only cities with at least 500 fire incidents)
| Bullhead City: | 33.9 |
| Mohave Valley: | 16.8 |
| Golden Valley: | 7.3 |
| Kingman: | 6.9 |
| Lake Havasu City: | 28.7 |
 35.8% incidents where reported in the morning and 64.2% in the evening. The most fires (15.3%) took place on Friday, and the least (13.4%) on Tuesday.
 According to the 2,806 fire incident reports from years 2003 - 2018 most fires (14.1%) took place during June, and the least (5.8%) in November.
 Out of all 8,187 cases reported during the years 2003 - 2018, the most belonged to the categories: Fire (34.3%), Hazardous Condition (25.7%), and Service Call (11.0%).
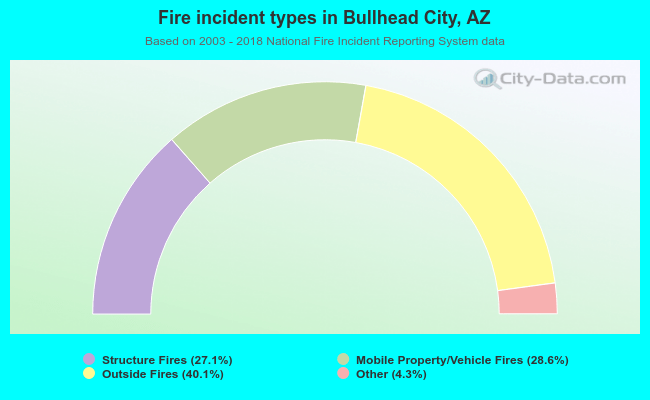 When looking into fire subcategories, the most reports belonged to: Outside Fires (40.1%), and Mobile Property/Vehicle Fires (28.6%).