Cedartown: Fire Incidents, Georgia (GA)
Where are fire incidents reported in Cedartown, GA
Something went wrong! Please refresh the page.
| Fire incidents reported | |
|---|---|
| Sreet name | Count |
| MAIN ST | 114 |
| PIEDMONT HWY | 102 |
| BUCHANAN HWY | 86 |
| 27 HWY | 74 |
| ROCKMART HWY | 66 |
| POTASH RD | 64 |
| COLLARD VALLEY RD | 62 |
| ANTIOCH RD | 56 |
| TREAT MOUNTAIN RD | 56 |
| BERRY RD | 50 |
| CULP LAKE RD | 50 |
| WEST AVE | 50 |
| CAVE SPRING RD | 48 |
| JOHNSON LAKE RD | 48 |
| LEES CHAPEL RD | 46 |
| PRIOR STATION RD | 42 |
| YOUNGS FARM RD | 40 |
| BREWSTER FIELD RD | 38 |
| CASON RD | 38 |
| JUDKIN MILL RD | 36 |
| PINE PITCH RD | 36 |
| ROME HWY | 36 |
| DRUMMOND RD | 34 |
| PUCKETT RD | 34 |
| CANAL ST | 32 |
| GEORGIA AVE | 32 |
| HUTTO RD | 32 |
| MOUNTAIN HOME RD | 32 |
| SHILOH RD | 32 |
| WIEUCA WAY | 32 |
| Other | 1,024 |
2003 - 2018 National Fire Incident Reporting System (NFIRS) incidents
- Incident types reported to NFIRS in Cedartown, GA
- 3,15436.6%Rescue & EMS
- 2,52229.3%Fire
- 1,40016.3%Hazardous Condition
- 6377.4%Good Intent Call
- 5416.3%Service Call
- 2833.3%False Alarm
- 440.5%Overpressure Rupture
- 210.2%Special Incident
- 120.1%Severe Weather
- Fire incident types reported to NFIRS in Cedartown, GA
- 1,25249.6%Outside Fires
- 85533.9%Structure Fires
- 37014.7%Mobile Property/Vehicle Fires
- 451.8%Other
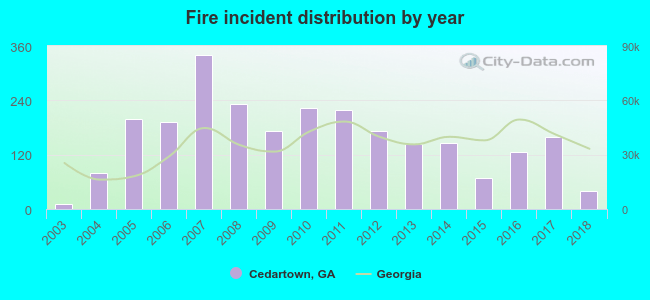 Based on the data from the years 2003 - 2018 the average number of fires per year is 158. The highest number of reported fire incidents - 341 took place in 2007, and the least - 11 in 2003. The data has a growing trend.
The average number of yearly fire incidents per 10k residents in Cedartown, GA compared to nearest cities:
(Note: Based on data for the last 3 years, including only cities with population 5,000 and above)
| Cedartown: | 110.4 |
| Rome: | 120.7 |
| Bremen: | 159.5 |
| Dallas: | 203.0 |
| Armuchee: | 22.1 |
| Villa Rica: | 115.0 |
| Cartersville: | 188.9 |
| Winston: | 27.5 |
| Carrollton: | 157.7 |
 The median response time based on all reported fire incidents is 8 minutes. This is higher than the state median value.
The median response time in Cedartown, GA compared to nearest cities:
(Note: Based on data for all years, including only cities with at least 500 fire incidents)
| Cedartown: | 8 minutes |
| Rockmart: | 8 minutes |
| Buchanan: | 7 minutes |
| Rome: | 6 minutes |
| Tallapoosa: | 8 minutes |
| Piedmont: | 8 minutes |
| Bremen: | 6 minutes |
| Temple: | 7 minutes |
| Cedar Bluff: | 11 minutes |
 According to the data from the years 2003 - 2018 the average number of fire-related casualties per year is 1. The highest number of reported casualties - 5 took place in 2014, and the lowest - 0 in 2004. The data has a decreasing trend.
The average number of casualties per 1,000 fires is 11. This indicator was the highest - 91 in 2003, and the lowest 0 in 2004. The trend for injuries per 1,000 fires is dropping. Compared to the state value the number of casualties per 1,000 fires is lower.
According to the data from the years 2003 - 2018 the average number of fire-related casualties per year is 1. The highest number of reported casualties - 5 took place in 2014, and the lowest - 0 in 2004. The data has a decreasing trend.
The average number of casualties per 1,000 fires is 11. This indicator was the highest - 91 in 2003, and the lowest 0 in 2004. The trend for injuries per 1,000 fires is dropping. Compared to the state value the number of casualties per 1,000 fires is lower.Casualties per 1,000 incidents in Cedartown, GA compared to nearest cities:
(Note: Based on data for all years, including only cities with at least 500 fire incidents)
| Cedartown: | 6.3 |
| Rockmart: | 5.8 |
| Buchanan: | 0.8 |
| Rome: | 9.4 |
| Tallapoosa: | 16.2 |
| Piedmont: | 1.8 |
| Bremen: | 18.7 |
| Temple: | 3.6 |
| Cedar Bluff: | 2.0 |
 27.8% incidents where reported in the morning and 72.2% in the evening. The most fires (16.1%) took place on Saturday, and the least (13.1%) on Monday.
 Based on the 2,522 fire incidents from years 2003 - 2018 most fires (11.0%) took place during March, and the least (6.3%) in September.
 Out of all 8,614 cases reported during the years 2003 - 2018, the most belonged to the categories: Rescue & EMS (36.6%), Fire (29.3%), and Hazardous Condition (16.3%).
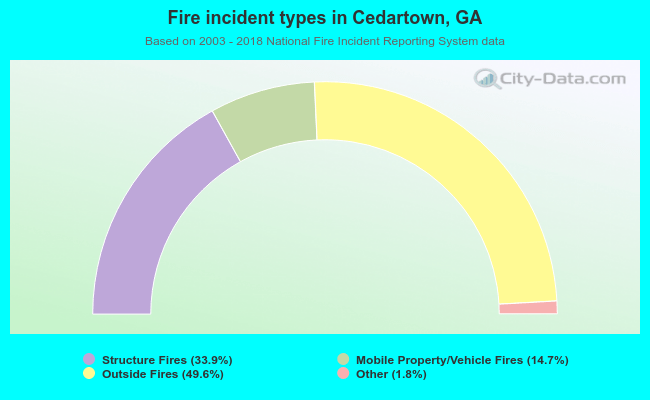 When looking into fire subcategories, the most incidents belonged to: Outside Fires (49.6%), and Structure Fires (33.9%).