Florin: Fire Incidents, California (CA)
Where are fire incidents reported in Florin, CA
Something went wrong! Please refresh the page.
| Fire incidents reported | |
|---|---|
| Sreet name | Count |
| FLORIN RD | 396 |
| GERBER RD | 228 |
| CALVINE RD | 192 |
| STOCKTON BL | 150 |
| STOCKTON | 138 |
| ELK GROVE FLORIN RD | 128 |
| POWER INN RD | 114 |
| 65TH ST | 112 |
| FRENCH RD | 64 |
| SUNNYSLOPE DR | 64 |
| BRADSHAW RD | 60 |
| SKY PW | 54 |
| ORANGE AV | 50 |
| COTTONWOOD LN | 44 |
| ELSIE AV | 44 |
| PALMER HOUSE DR | 44 |
| LOUCRETA DR | 42 |
| TIOGAWOODS DR | 42 |
| ELSIE | 40 |
| VINTAGE PARK DR | 40 |
| 66TH AV | 36 |
| CASELMAN RD | 36 |
| WATERMAN RD | 36 |
| FLORIN MALL DR | 34 |
| ORANGE | 34 |
| REESE RD | 34 |
| BRITTANY PARK DR | 32 |
| LINDALE DR | 28 |
| SKY | 28 |
| STEVENSON AV | 28 |
| Other | 132 |
2005 - 2018 National Fire Incident Reporting System (NFIRS) incidents
- Incident types reported to NFIRS in Florin, CA
- 23,39568.6%Rescue & EMS
- 3,2929.7%Good Intent Call
- 2,5047.3%Fire
- 1,6975.0%Service Call
- 1,4614.3%Special Incident
- 1,1473.4%False Alarm
- 5711.7%Hazardous Condition
- Fire incident types reported to NFIRS in Florin, CA
- 1,38355.2%Outside Fires
- 55622.2%Structure Fires
- 40816.3%Mobile Property/Vehicle Fires
- 1576.3%Other
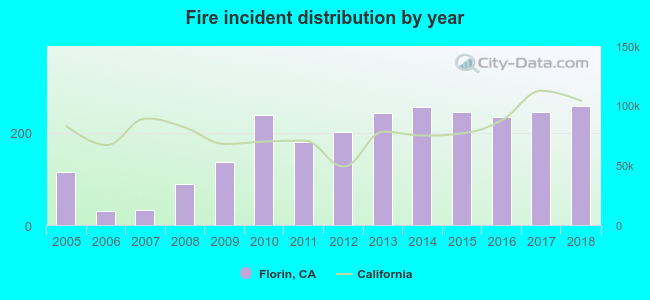 According to the data from the years 2005 - 2018 the average number of fire incidents per year is 179. The highest number of reported fire incidents - 259 took place in 2018, and the least - 30 in 2006. The data has an increasing trend.
The average number of yearly fire incidents per 10k residents in Florin, CA compared to nearest cities:
(Note: Based on data for the last 3 years, including only cities with population 5,000 and above)
| Florin: | 51.8 |
| Elk Grove: | 2.5 |
| Laguna: | 0.5 |
| Sacramento: | 69.5 |
| Franklin: | 3.3 |
| Mather: | 36.7 |
| West Sacramento: | 58.9 |
| Rancho Cordova: | 32.6 |
| Carmichael: | 16.0 |
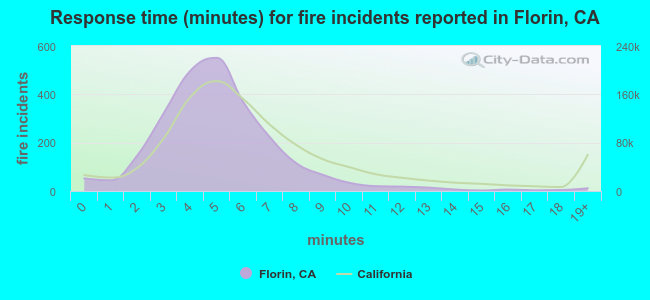 The median response time based on all reported fire incidents is 5 minutes. This is lower compared to the California median value.
The median response time in Florin, CA compared to nearest cities:
(Note: Based on data for all years, including only cities with at least 500 fire incidents)
| Florin: | 5 minutes |
| Elk Grove: | 6 minutes |
| Sacramento: | 5 minutes |
| Mather: | 6 minutes |
| West Sacramento: | 5 minutes |
| Rancho Cordova: | 5 minutes |
| Carmichael: | 5 minutes |
| North Highlands: | 5 minutes |
| Fair Oaks: | 5 minutes |
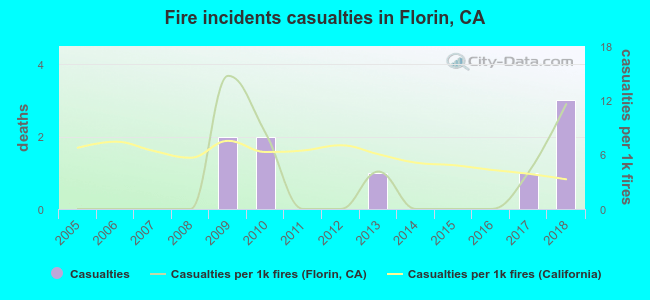 Based on the data from the years 2005 - 2018 the average number of fire-related yearly casualties is 1. The highest number of reported injuries - 3 took place in 2018, and the lowest - 0 in 2005. The data has an increasing trend.
The average number of injuries per 1,000 fires is 3. This indicator was the highest - 15 in 2009, and the lowest 0 in 2005. The trend for injuries per 1,000 fires is increasing. Compared to the state value the number of injuries per 1,000 fire incidents is lower.
Based on the data from the years 2005 - 2018 the average number of fire-related yearly casualties is 1. The highest number of reported injuries - 3 took place in 2018, and the lowest - 0 in 2005. The data has an increasing trend.
The average number of injuries per 1,000 fires is 3. This indicator was the highest - 15 in 2009, and the lowest 0 in 2005. The trend for injuries per 1,000 fires is increasing. Compared to the state value the number of injuries per 1,000 fire incidents is lower.Casualties per 1,000 incidents in Florin, CA compared to nearest cities:
(Note: Based on data for all years, including only cities with at least 500 fire incidents)
| Florin: | 3.6 |
| Elk Grove: | 1.0 |
| Sacramento: | 2.3 |
| Mather: | 0.0 |
| West Sacramento: | 4.0 |
| Rancho Cordova: | 4.0 |
| Carmichael: | 5.6 |
| North Highlands: | 0.0 |
| Fair Oaks: | 3.6 |
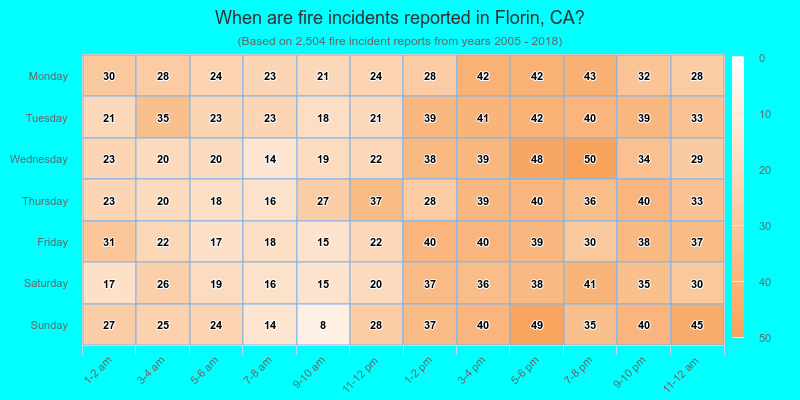
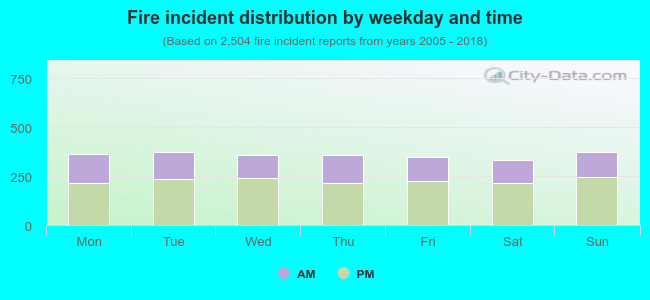 36.5% incidents where reported in the morning and 63.5% in the evening. The most fires (15.0%) took place on Tuesday, and the least (13.2%) on Saturday.
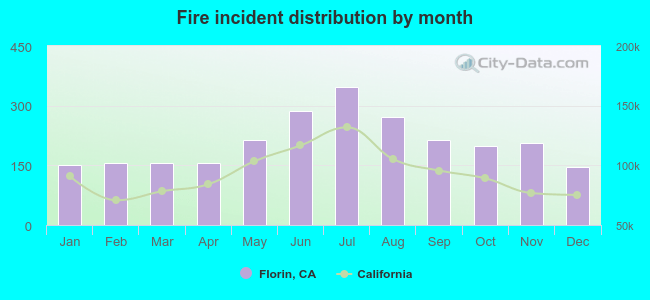 According to the 2,504 incident reports from years 2005 - 2018 most fires (13.9%) took place during July, and the least (5.9%) in December.
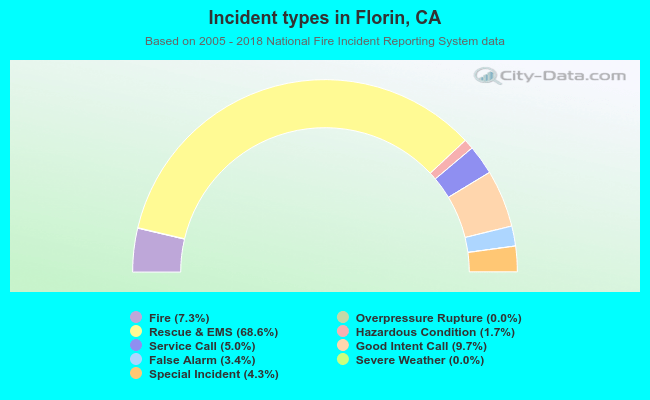 Out of all 34,084 cases reported during the years 2005 - 2018, the most belonged to the categories: Rescue & EMS (68.6%), Good Intent Call (9.7%), and Fire (7.3%).
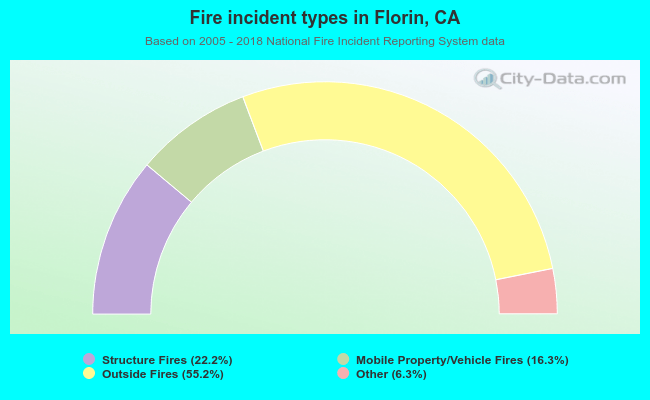 When looking into fire subcategories, the most reports belonged to: Outside Fires (55.2%), and Structure Fires (22.2%).