Freehold: Fire Incidents, New Jersey (NJ)
Where are fire incidents reported in Freehold, NJ
Something went wrong! Please refresh the page.
| Fire incidents reported | |
|---|---|
| Sreet name | Count |
| HUDSON ST | 718 |
| MAIN ST | 214 |
| ROUTE 9 | 202 |
| ELTON ADELPHIA RD | 122 |
| SOUTH ST | 120 |
| THROCKMORTON ST | 100 |
| JACKSON ST | 86 |
| FORD AVE | 72 |
| DUTCH LANE RD | 56 |
| MANALAPAN AVE | 56 |
| PARK AVE | 54 |
| BROAD ST | 52 |
| ROUTE 33 | 38 |
| GEORGIA RD | 34 |
| MANCHESTER CT | 32 |
| WEST MAIN ST | 30 |
| BROADWAY | 28 |
| CENTER ST | 28 |
| COURT ST | 26 |
| JACKSON MILLS RD | 26 |
| JERSEYVILLE AVE | 26 |
| AVENUE A | 24 |
| MONMOUTH AVE | 24 |
| HALLS MILLS RD | 22 |
| INSTITUTE ST | 22 |
| MOUNTS CORNER DR | 22 |
| WILLOWBROOK RD | 22 |
| KINGSLEY WAY | 20 |
| EAST FREEHOLD RD | 18 |
| ELTON ADELPHIA RD | 18 |
2002 - 2018 National Fire Incident Reporting System (NFIRS) incidents
- Incident types reported to NFIRS in Freehold, NJ
- 2,97346.1%Hazardous Condition
- 1,95330.3%Fire
- 95814.8%False Alarm
- 2834.4%Good Intent Call
- 1662.6%Service Call
- 781.2%Rescue & EMS
- 260.4%Special Incident
- 90.1%Severe Weather
- 80.1%Overpressure Rupture
- Fire incident types reported to NFIRS in Freehold, NJ
- 1,23363.1%Structure Fires
- 44923.0%Outside Fires
- 1789.1%Mobile Property/Vehicle Fires
- 934.8%Other
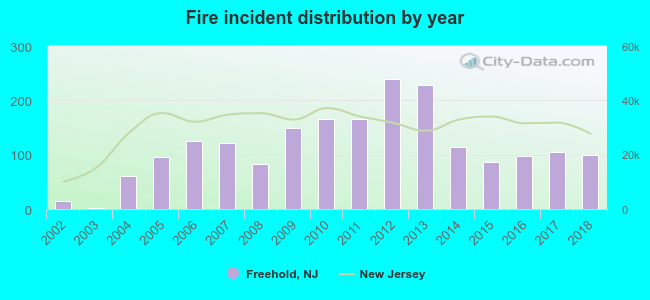 According to the data from the years 2002 - 2018 the average number of fire incidents per year is 115. The highest number of reported fire incidents - 240 took place in 2012, and the least - 1 in 2003. The data has a growing trend.
The average number of yearly fire incidents per 10k residents in Freehold, NJ compared to nearest cities:
(Note: Based on data for the last 3 years, including only cities with population 5,000 and above)
| Freehold: | 84.1 |
| Morganville: | 36.4 |
| Lincroft: | 19.6 |
| Tinton Falls: | 47.9 |
| Old Bridge: | 38.9 |
| Jamesburg: | 16.6 |
| Matawan: | 41.3 |
| Spotswood: | 16.0 |
| Lakewood: | 1.7 |
 The median response time based on all reported fire incidents is 5 minutes. This is comparable to the state median value.
The median response time in Freehold, NJ compared to nearest cities:
(Note: Based on data for all years, including only cities with at least 500 fire incidents)
| Freehold: | 5 minutes |
| Morganville: | 4 minutes |
| Tinton Falls: | 7 minutes |
| Old Bridge: | 4 minutes |
| Matawan: | 4 minutes |
| Lakewood: | 4 minutes |
| Eatontown: | 5 minutes |
| Keyport: | 4 minutes |
| Cranbury: | 7 minutes |
 Based on the reports from the years 2002 - 2018 the average number of fire-related casualties per year is 0. The highest number of injuries - 3 took place in 2005, and the lowest - 0 in 2003. The data has a dropping trend.
The average number of injuries per 1,000 fires is 8. This indicator was the highest - 71 in 2002, and the lowest 0 in 2003. The trend for casualties per 1,000 fire incidents is dropping. Compared to the state value the number of casualties per 1,000 fire incidents is much lower.
Based on the reports from the years 2002 - 2018 the average number of fire-related casualties per year is 0. The highest number of injuries - 3 took place in 2005, and the lowest - 0 in 2003. The data has a dropping trend.
The average number of injuries per 1,000 fires is 8. This indicator was the highest - 71 in 2002, and the lowest 0 in 2003. The trend for casualties per 1,000 fire incidents is dropping. Compared to the state value the number of casualties per 1,000 fire incidents is much lower.Casualties per 1,000 incidents in Freehold, NJ compared to nearest cities:
(Note: Based on data for all years, including only cities with at least 500 fire incidents)
| Freehold: | 3.1 |
| Morganville: | 1.7 |
| Tinton Falls: | 5.5 |
| Old Bridge: | 9.9 |
| Matawan: | 8.2 |
| Lakewood: | 44.4 |
| Eatontown: | 26.9 |
| Keyport: | 20.6 |
| Cranbury: | 0.0 |
 28.4% incidents where reported in the morning and 71.6% in the evening. The most fires (15.9%) took place on Saturday, and the least (12.8%) on Friday.
 Based on the 1,953 fire incident reports from years 2002 - 2018 most fires (11.2%) took place during April, and the least (5.5%) in February.
 Out of all 6,454 cases reported during the years 2002 - 2018, the most belonged to the categories: Hazardous Condition (46.1%), Fire (30.3%), and False Alarm (14.8%).
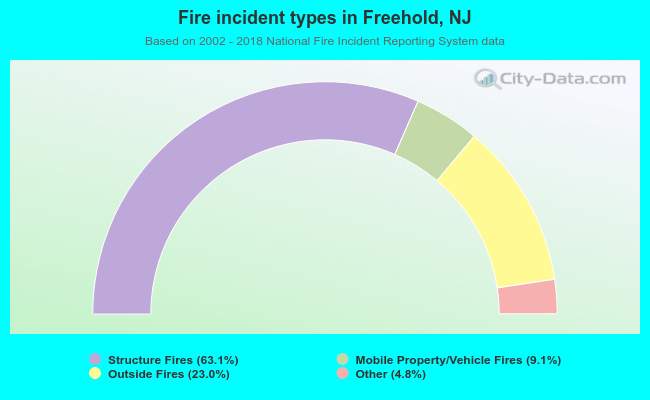 When looking into fire subcategories, the most incidents belonged to: Structure Fires (63.1%), and Outside Fires (23.0%).