Grand Island: Fire Incidents, New York (NY)
Where are fire incidents reported in Grand Island, NY
Something went wrong! Please refresh the page.
| Fire incidents reported | |
|---|---|
| Sreet name | Count |
| GRAND ISLAND BLVD | 190 |
| EAST RIVER RD | 128 |
| BASELINE RD | 108 |
| WHITEHAVEN RD | 94 |
| STALEY RD | 88 |
| BEDELL RD | 74 |
| STONY POINT RD | 74 |
| LONG RD | 52 |
| WEST RIVER RD | 48 |
| LOVE RD | 40 |
| FIX RD | 36 |
| THRUWAY SOUTH | 34 |
| THRUWAY NORTH | 32 |
| RANSOM RD | 30 |
| BROADWAY | 18 |
| CONTINENTAL LN | 16 |
| SANDY BEACH RD | 16 |
| WEST OAKFIELD RD | 16 |
| CARL RD | 14 |
| HUTH RD | 14 |
| WARNER DR | 14 |
| BEAVER ISLAND | 12 |
| EAST PARK RD | 12 |
| TOWN HALL TERR | 12 |
| WALLACE DR | 12 |
| WEST PARK RD | 12 |
| BUSH RD | 10 |
| DEERWOOD LN | 10 |
| FERRY RD | 10 |
| FIRST ST | 10 |
2002 - 2018 National Fire Incident Reporting System (NFIRS) incidents
- Incident types reported to NFIRS in Grand Island, NY
- 5,31958.3%Rescue & EMS
- 1,02111.2%Hazardous Condition
- 8599.4%Fire
- 8249.0%False Alarm
- 5636.2%Service Call
- 4745.2%Good Intent Call
- 370.4%Special Incident
- 110.1%Overpressure Rupture
- Fire incident types reported to NFIRS in Grand Island, NY
- 49858.0%Structure Fires
- 21525.0%Outside Fires
- 779.0%Mobile Property/Vehicle Fires
- 698.0%Other
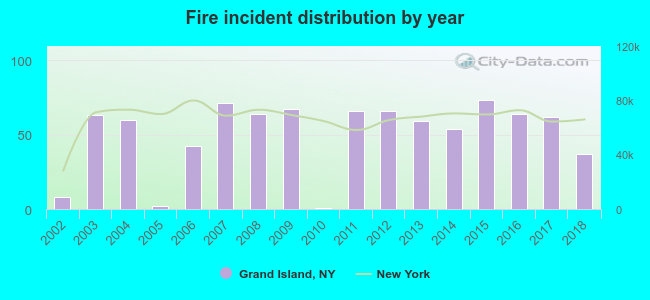 According to the data from the years 2002 - 2018 the average number of fires per year is 51. The highest number of reported fires - 73 took place in 2015, and the least - 1 in 2010. The data has an increasing trend.
The average number of yearly fire incidents per 10k residents in Grand Island, NY compared to nearest cities:
(Note: Based on data for the last 3 years, including only cities with population 5,000 and above)
| Grand Island: | 26.7 |
| Tonawanda: | 81.5 |
| North Tonawanda: | 27.1 |
| Kenmore: | 21.9 |
| Niagara Falls: | 80.8 |
| Eggertsville: | 1.0 |
| Buffalo: | 16.1 |
| Amherst: | 14.9 |
| Pendleton: | 1.6 |
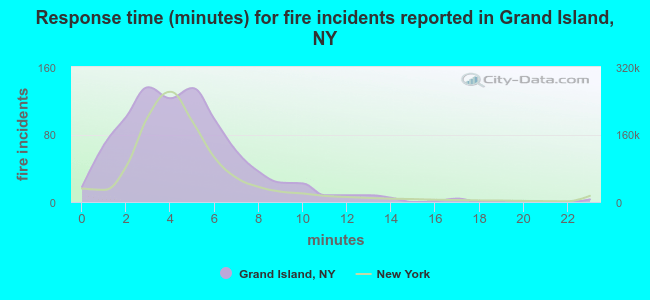 The median response time based on all reported fire incidents is 4 minutes. This is similar to the state median value.
The median response time in Grand Island, NY compared to nearest cities:
(Note: Based on data for all years, including only cities with at least 500 fire incidents)
| Grand Island: | 4 minutes |
| Tonawanda: | 2 minutes |
| North Tonawanda: | 3 minutes |
| Kenmore: | 2 minutes |
| Niagara Falls: | 3 minutes |
| Buffalo: | 3 minutes |
| Amherst: | 4 minutes |
| Williamsville: | 4 minutes |
| Cheektowaga: | 4 minutes |
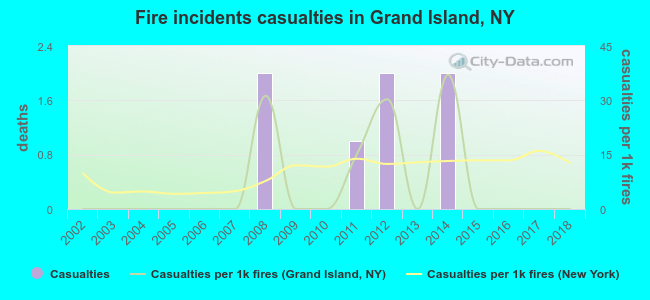 Based on the reports from the years 2002 - 2018 the average number of fire-related yearly casualties is 0. The highest number of reported injuries - 2 took place in 2008, and the lowest - 0 in 2002. The data has a constant trend.
The average number of casualties per 1,000 fire incidents is 7. This indicator was the highest - 37 in 2014, and the lowest 0 in 2002. The trend for injuries per 1,000 fire incidents is constant. Compared to the New York value the number of injuries per 1,000 fires is lower.
Based on the reports from the years 2002 - 2018 the average number of fire-related yearly casualties is 0. The highest number of reported injuries - 2 took place in 2008, and the lowest - 0 in 2002. The data has a constant trend.
The average number of casualties per 1,000 fire incidents is 7. This indicator was the highest - 37 in 2014, and the lowest 0 in 2002. The trend for injuries per 1,000 fire incidents is constant. Compared to the New York value the number of injuries per 1,000 fires is lower.Casualties per 1,000 incidents in Grand Island, NY compared to nearest cities:
(Note: Based on data for all years, including only cities with at least 500 fire incidents)
| Grand Island: | 8.1 |
| Tonawanda: | 20.9 |
| North Tonawanda: | 7.9 |
| Kenmore: | 35.6 |
| Niagara Falls: | 22.3 |
| Buffalo: | 5.5 |
| Amherst: | 6.6 |
| Williamsville: | 3.3 |
| Cheektowaga: | 9.8 |
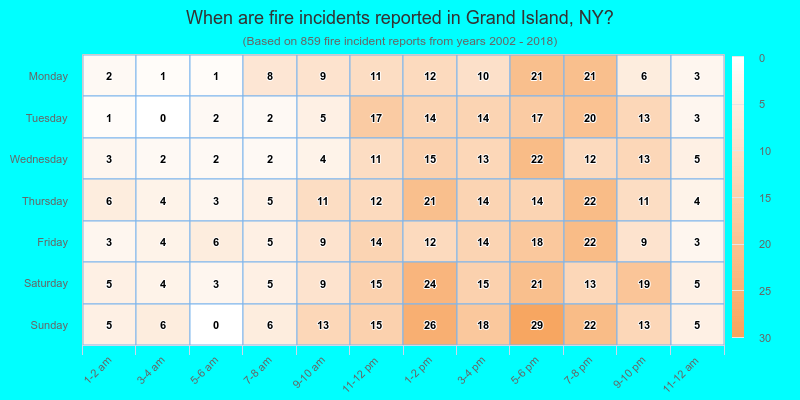
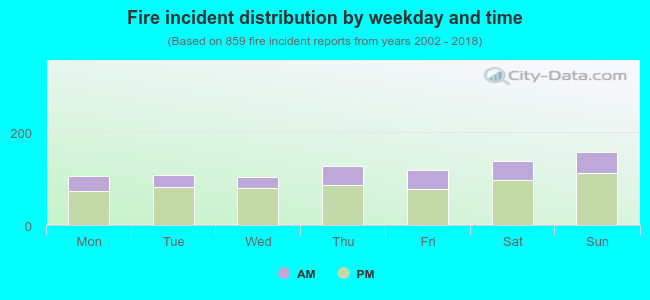 29.2% incidents where reported in the morning and 70.8% in the evening. The most fires (18.4%) took place on Sunday, and the least (12.1%) on Wednesday.
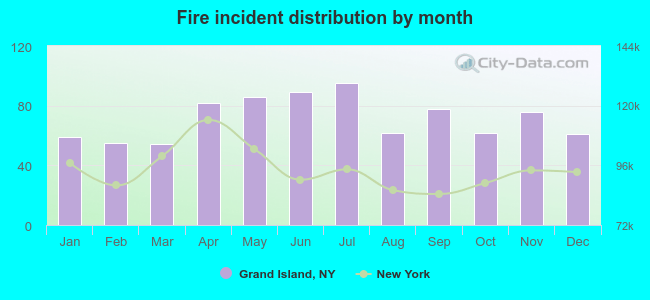 According to the 859 fire incident reports from years 2002 - 2018 most fires (11.1%) took place during July, and the least (6.3%) in March.
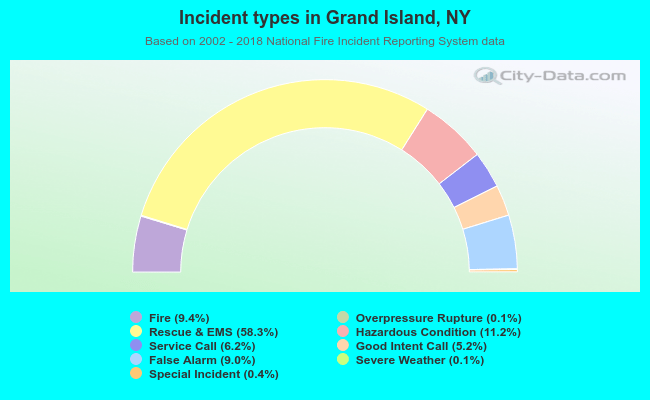 Out of all 9,117 cases reported during the years 2002 - 2018, the most belonged to the categories: Rescue & EMS (58.3%), Hazardous Condition (11.2%), and Fire (9.4%).
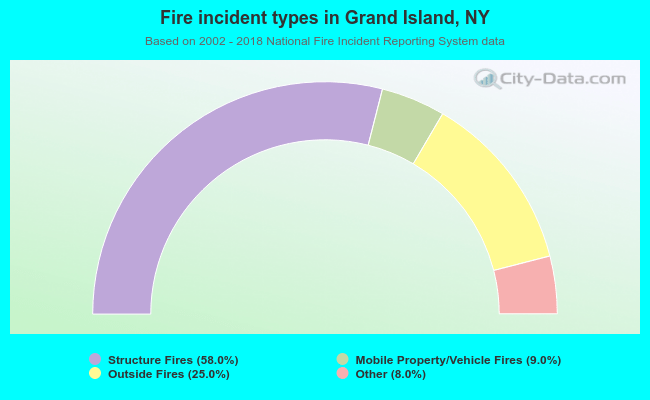 When looking into fire subcategories, the most incidents belonged to: Structure Fires (58.0%), and Outside Fires (25.0%).