Lincoln City: Fire Incidents, Oregon (OR)
Where are fire incidents reported in Lincoln City, OR
Something went wrong! Please refresh the page.
|
| |||||||||||||||||||||||||||||||||||||||||||||||||||||||||||||||||||||||||||||||||||||||||||||||||||||||||||||
2002 - 2018 National Fire Incident Reporting System (NFIRS) incidents
- Incident types reported to NFIRS in Lincoln City, OR
- 4,16366.6%Rescue & EMS
- 65910.5%Fire
- 4957.9%Service Call
- 3495.6%Hazardous Condition
- 3135.0%Good Intent Call
- 2644.2%False Alarm
- Fire incident types reported to NFIRS in Lincoln City, OR
- 36655.5%Outside Fires
- 20431.0%Structure Fires
- 8813.4%Mobile Property/Vehicle Fires
- 10.2%Other
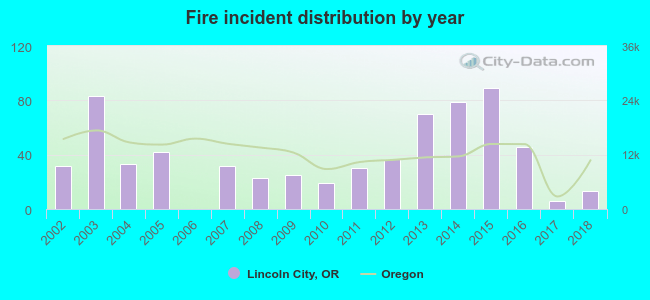 According to the data from the years 2002 - 2018 the average number of fires per year is 39. The highest number of reported fire incidents - 89 took place in 2015, and the least - 0 in 2006. The data has a declining trend.
The average number of yearly fire incidents per 10k residents in Lincoln City, OR compared to nearest cities:
(Note: Based on data for the last 3 years, including only cities with population 5,000 and above)
| Lincoln City: | 27.0 |
| Agate Beach: | 1.6 |
| Newport: | 46.5 |
| Sheridan: | 39.0 |
| Dallas: | 26.9 |
| Monmouth: | 14.7 |
| Independence: | 14.4 |
| McMinnville: | 7.8 |
| Corvallis: | 10.1 |
 The median response time based on all reported fire incidents is 7 minutes. This is close to the state median value.
The median response time in Lincoln City, OR compared to nearest cities:
(Note: Based on data for all years, including only cities with at least 500 fire incidents)
| Lincoln City: | 7 minutes |
| Newport: | 5 minutes |
| Sheridan: | 8 minutes |
| Dallas: | 7 minutes |
| Tillamook: | 5 minutes |
| McMinnville: | 6 minutes |
| Corvallis: | 6 minutes |
| Salem: | 5 minutes |
| Keizer: | 5 minutes |
 32.8% incidents where reported in the morning and 67.2% in the evening. The most fires (16.4%) took place on Monday, and the least (12.3%) on Wednesday.
 According to the 659 incident reports from years 2002 - 2018 most fires (19.0%) took place during August, and the least (4.4%) in December.
 Out of all 6,248 cases reported during the years 2002 - 2018, the most belonged to the categories: Rescue & EMS (66.6%), Fire (10.5%), and Service Call (7.9%).
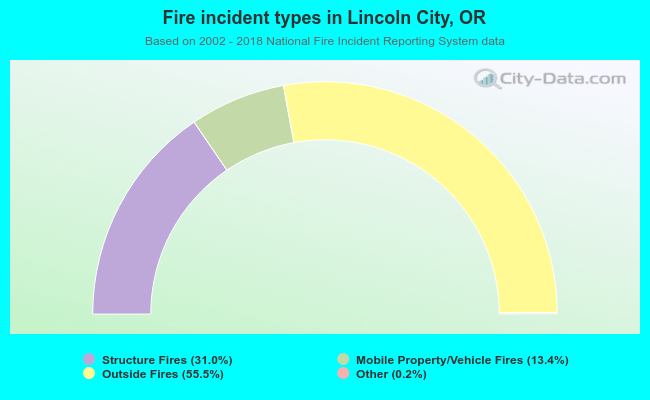 When looking into fire subcategories, the most reports belonged to: Outside Fires (55.5%), and Structure Fires (31.0%).