Muskogee: Fire Incidents, Oklahoma (OK)
Where are fire incidents reported in Muskogee, OK
Something went wrong! Please refresh the page.
| Fire incidents reported | |
|---|---|
| Sreet name | Count |
| 40TH ST | 252 |
| 32ND ST | 246 |
| DAYTON ST | 164 |
| YORK ST | 154 |
| MAIN ST | 138 |
| 24TH ST | 128 |
| CHEROKEE ST | 116 |
| BROADWAY ST | 110 |
| SHAWNEE AVE | 100 |
| OKMULGEE AVE | 84 |
| SMITH FERRY RD | 70 |
| ELMIRA ST | 68 |
| PEAK BLVD | 68 |
| COUNTRY CLUB RD | 64 |
| CHANDLER RD | 62 |
| HANCOCK ST | 62 |
| 45TH ST | 56 |
| GIBSON ST | 56 |
| 13TH ST | 54 |
| 53RD ST | 54 |
| 6TH ST | 54 |
| COURT ST | 54 |
| C ST | 52 |
| HARRIS RD | 52 |
| B ST | 50 |
| 3RD ST | 48 |
| ELGIN ST | 48 |
| 17TH ST | 46 |
| 55TH ST | 46 |
| 7TH ST | 46 |
| Other | 1,185 |
2006 - 2018 National Fire Incident Reporting System (NFIRS) incidents
- Incident types reported to NFIRS in Muskogee, OK
- 7,54747.4%Rescue & EMS
- 3,78723.8%Fire
- 1,96912.4%False Alarm
- 1,2517.9%Hazardous Condition
- 6804.3%Good Intent Call
- 5133.2%Service Call
- 880.6%Special Incident
- 680.4%Overpressure Rupture
- Fire incident types reported to NFIRS in Muskogee, OK
- 1,86849.3%Outside Fires
- 1,31634.8%Structure Fires
- 41410.9%Mobile Property/Vehicle Fires
- 1895.0%Other
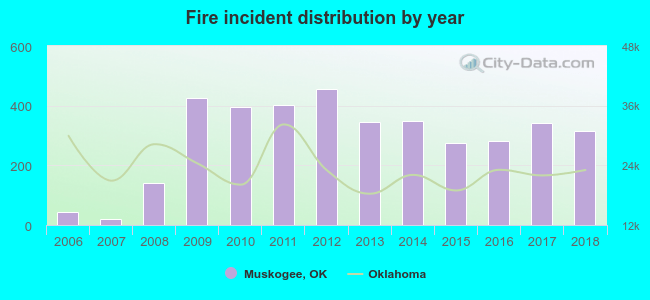 Based on the data from the years 2006 - 2018 the average number of fires per year is 291. The highest number of reported fire incidents - 455 took place in 2012, and the least - 19 in 2007. The data has an increasing trend.
The average number of yearly fire incidents per 10k residents in Muskogee, OK compared to nearest cities:
(Note: Based on data for the last 3 years, including only cities with population 5,000 and above)
| Muskogee: | 81.2 |
| Wagoner: | 85.2 |
| Coweta: | 31.5 |
| Tahlequah: | 109.9 |
| Broken Arrow: | 20.0 |
| Bixby: | 20.1 |
 The median response time based on all reported fire incidents is 5 minutes. This is lower than the state median value.
The median response time in Muskogee, OK compared to nearest cities:
(Note: Based on data for all years, including only cities with at least 500 fire incidents)
| Muskogee: | 5 minutes |
| Wagoner: | 4 minutes |
| Hulbert: | 5 minutes |
| Coweta: | 6 minutes |
| Tahlequah: | 5 minutes |
| Inola: | 9 minutes |
| Vian: | 9 minutes |
| Morris: | 10 minutes |
| Chouteau: | 4 minutes |
 According to the reports from the years 2006 - 2018 the average number of fire-related fatalities per year is 1. The highest number of deaths - 3 took place in 2009, and the lowest - 0 in 2006. The data has an increasing trend.
The average number of fatalities per 1,000 fire incidents is 2. This indicator was the highest - 7 in 2009, and the lowest 0 in 2006. The trend for fatalities per 1,000 fire incidents is growing. Compared to the Oklahoma value the number of deaths per 1,000 incidents is higher.
According to the reports from the years 2006 - 2018 the average number of fire-related fatalities per year is 1. The highest number of deaths - 3 took place in 2009, and the lowest - 0 in 2006. The data has an increasing trend.
The average number of fatalities per 1,000 fire incidents is 2. This indicator was the highest - 7 in 2009, and the lowest 0 in 2006. The trend for fatalities per 1,000 fire incidents is growing. Compared to the Oklahoma value the number of deaths per 1,000 incidents is higher.Deaths per 1,000 incidents in Muskogee, OK compared to nearest cities:
(Note: Based on data for all years, including only cities with at least 2,500 fire incidents)
| Muskogee: | 2.9 |
| Broken Arrow: | 1.4 |
 According to the data from the years 2006 - 2018 the average number of fire-related casualties per year is 2. The highest number of casualties - 13 took place in 2010, and the lowest - 0 in 2006. The data has a constant trend.
The average number of injuries per 1,000 fire incidents is 5. This indicator was the highest - 33 in 2010, and the lowest 0 in 2006. The trend for casualties per 1,000 fire incidents is constant. Compared to the state value the number of casualties per 1,000 incidents is higher.
According to the data from the years 2006 - 2018 the average number of fire-related casualties per year is 2. The highest number of casualties - 13 took place in 2010, and the lowest - 0 in 2006. The data has a constant trend.
The average number of injuries per 1,000 fire incidents is 5. This indicator was the highest - 33 in 2010, and the lowest 0 in 2006. The trend for casualties per 1,000 fire incidents is constant. Compared to the state value the number of casualties per 1,000 incidents is higher.
 29.4% incidents where reported in the morning and 70.6% in the evening. The most fires (14.9%) took place on Wednesday, and the least (13.5%) on Friday.
 According to the 3,787 incident reports from years 2006 - 2018 most fires (11.1%) took place during July, and the least (6.8%) in May.
 Out of all 15,911 cases reported during the years 2006 - 2018, the most belonged to the categories: Rescue & EMS (47.4%), Fire (23.8%), and False Alarm (12.4%).
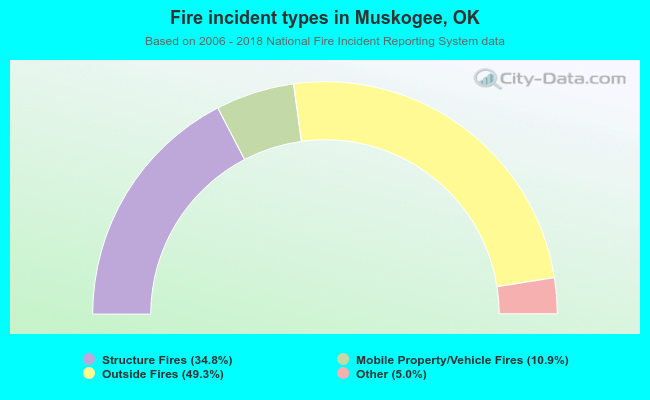 When looking into fire subcategories, the most reports belonged to: Outside Fires (49.3%), and Structure Fires (34.8%).