Newport Beach: Fire Incidents, California (CA)
Where are fire incidents reported in Newport Beach, CA
Something went wrong! Please refresh the page.
| Fire incidents reported | |
|---|---|
| Sreet name | Count |
| COAST HWY | 98 |
| COAST HY | 50 |
| NEWPORT CENTER DR | 48 |
| OCEAN FRONT | 48 |
| IRVINE AVE | 38 |
| SHERINGTON PL | 38 |
| BALBOA BLVD | 36 |
| PARK NEWPORT DR | 36 |
| SEASHORE DR | 36 |
| 16TH ST | 34 |
| 73 FWY | 34 |
| BIRCH ST | 34 |
| MACARTHUR BLVD | 32 |
| NEWPORT COAST DR | 30 |
| JAMBOREE RD | 28 |
| SUPERIOR AVE | 28 |
| SB 73 FY | 26 |
| AVOCADO AVE | 24 |
| BALBOA BL | 24 |
| BAYSIDE DR | 24 |
| BACK BAY DR | 22 |
| MARINERS DR | 22 |
| 15TH ST | 20 |
| 34TH ST | 20 |
| BRISTOL ST | 20 |
| PROMONTORY DR | 20 |
| HOAG DR | 18 |
| PLACENTIA AVE | 18 |
| SAN JOAQUIN HILLS RD | 18 |
| BAYPOINTE DR | 16 |
| Other | 440 |
2005 - 2018 National Fire Incident Reporting System (NFIRS) incidents
- Incident types reported to NFIRS in Newport Beach, CA
- 26,89766.1%Rescue & EMS
- 5,75014.1%Good Intent Call
- 2,5716.3%False Alarm
- 2,4696.1%Service Call
- 1,5423.8%Hazardous Condition
- 1,3803.4%Fire
- Fire incident types reported to NFIRS in Newport Beach, CA
- 72152.2%Structure Fires
- 32123.3%Outside Fires
- 23016.7%Mobile Property/Vehicle Fires
- 1087.8%Other
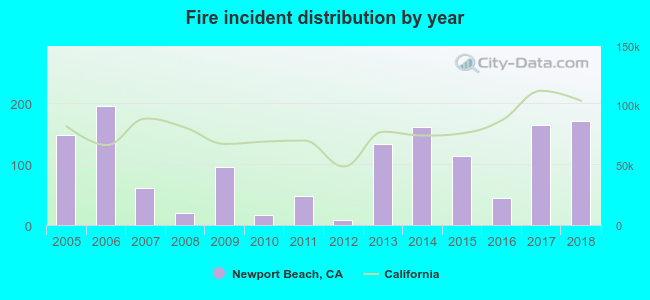 Based on the data from the years 2005 - 2018 the average number of fires per year is 99. The highest number of fires - 196 took place in 2006, and the least - 9 in 2012. The data has a growing trend.
The average number of yearly fire incidents per 10k residents in Newport Beach, CA compared to nearest cities:
(Note: Based on data for the last 3 years, including only cities with population 5,000 and above)
| Newport Beach: | 14.5 |
| Costa Mesa: | 17.6 |
| Fountain Valley: | 2.5 |
| Irvine: | 11.3 |
| Huntington Beach: | 2.7 |
| Santa Ana: | 14.7 |
| Laguna Beach: | 4.1 |
| Laguna Woods: | 12.8 |
| Tustin: | 12.4 |
 The median response time based on all reported fire incidents is 6 minutes. This is similar to the state median value.
The median response time in Newport Beach, CA compared to nearest cities:
(Note: Based on data for all years, including only cities with at least 500 fire incidents)
| Newport Beach: | 6 minutes |
| Costa Mesa: | 5 minutes |
| Fountain Valley: | 6 minutes |
| Irvine: | 6 minutes |
| Huntington Beach: | 6 minutes |
| Santa Ana: | 5 minutes |
| Tustin: | 6 minutes |
| Westminster: | 5 minutes |
| Laguna Hills: | 6 minutes |
 According to the data from the years 2005 - 2018 the average number of fire-related yearly casualties is 0. The highest number of injuries - 2 took place in 2014, and the lowest - 0 in 2008. The data has a decreasing trend.
The average number of injuries per 1,000 fire incidents is 3. This indicator was the highest - 17 in 2007, and the lowest 0 in 2008. The trend for injuries per 1,000 fires is declining. Compared to the California value the number of casualties per 1,000 fires is lower.
According to the data from the years 2005 - 2018 the average number of fire-related yearly casualties is 0. The highest number of injuries - 2 took place in 2014, and the lowest - 0 in 2008. The data has a decreasing trend.
The average number of injuries per 1,000 fire incidents is 3. This indicator was the highest - 17 in 2007, and the lowest 0 in 2008. The trend for injuries per 1,000 fires is declining. Compared to the California value the number of casualties per 1,000 fires is lower.Casualties per 1,000 incidents in Newport Beach, CA compared to nearest cities:
(Note: Based on data for all years, including only cities with at least 500 fire incidents)
| Newport Beach: | 3.6 |
| Costa Mesa: | 16.4 |
| Fountain Valley: | 31.9 |
| Irvine: | 15.1 |
| Huntington Beach: | 31.1 |
| Santa Ana: | 16.8 |
| Tustin: | 20.1 |
| Westminster: | 24.0 |
| Laguna Hills: | 8.0 |
 32.4% incidents where reported in the morning and 67.6% in the evening. The most fires (15.7%) took place on Sunday, and the least (11.8%) on Thursday.
 Based on the 1,380 reports from years 2005 - 2018 most fires (11.2%) took place during January, and the least (5.7%) in October.
 Out of all 40,668 cases reported during the years 2005 - 2018, the most belonged to the categories: Rescue & EMS (66.1%), Good Intent Call (14.1%), and False Alarm (6.3%).
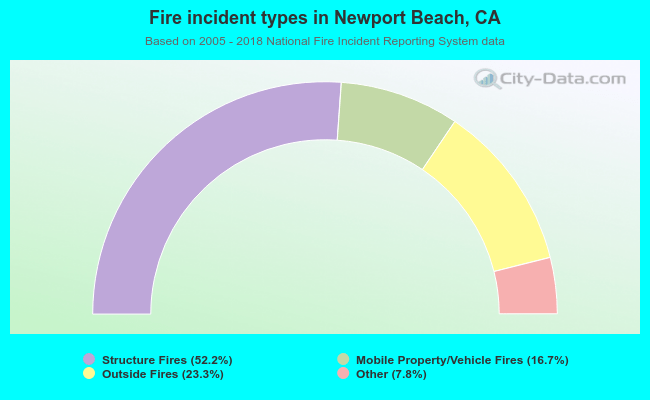 When looking into fire subcategories, the most incidents belonged to: Structure Fires (52.2%), and Outside Fires (23.3%).