Pleasant Prairie: Fire Incidents, Wisconsin (WI)
Where are fire incidents reported in Pleasant Prairie, WI
Something went wrong! Please refresh the page.
| Fire incidents reported | |
|---|---|
| Sreet name | Count |
| 95TH ST | 92 |
| 88TH AVE | 74 |
| INTERSTATE 94 | 56 |
| 104TH (STH 165) ST | 54 |
| 82ND ST | 46 |
| 100TH ST | 40 |
| LAKESHORE DR | 36 |
| SPRINGBROOK RD | 32 |
| OLD GREEN BAY RD | 30 |
| SHERIDAN (STH 32) RD | 30 |
| 108TH ST | 26 |
| 116TH ST | 26 |
| BAIN STATION RD | 26 |
| 104THSTH 165 ST | 24 |
| 120TH (E. FRONTAGE) AVE | 24 |
| 122ND ST | 24 |
| 128TH ST | 20 |
| 39TH AVE | 20 |
| 7TH AVE | 20 |
| 85TH ST | 20 |
| 93RD ST | 20 |
| GREEN BAY (STH 31) RD | 20 |
| 72ND AVE | 18 |
| 113TH ST | 16 |
| 76TH ST | 16 |
| 80TH AVE | 16 |
| 32ND AVE | 14 |
| 94TH AVE | 14 |
| PRAIRIE RIDGE BLVD | 14 |
| 109TH ST | 12 |
2002 - 2018 National Fire Incident Reporting System (NFIRS) incidents
- Incident types reported to NFIRS in Pleasant Prairie, WI
- 6,50761.3%Rescue & EMS
- 1,45513.7%False Alarm
- 7407.0%Hazardous Condition
- 7407.0%Service Call
- 7376.9%Fire
- 4204.0%Good Intent Call
- 110.1%Overpressure Rupture
- Fire incident types reported to NFIRS in Pleasant Prairie, WI
- 29940.6%Structure Fires
- 25434.5%Outside Fires
- 17623.9%Mobile Property/Vehicle Fires
- 81.1%Other
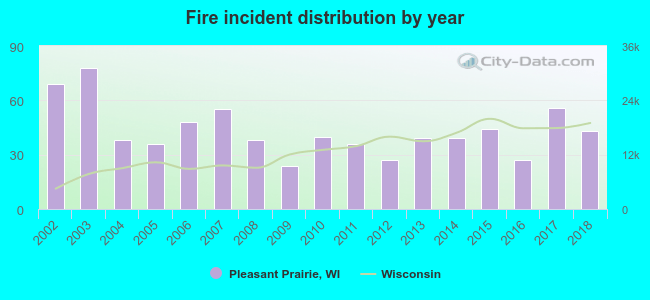 According to the data from the years 2002 - 2018 the average number of fires per year is 43. The highest number of reported fires - 78 took place in 2003, and the least - 24 in 2009. The data has a declining trend.
The average number of yearly fire incidents per 10k residents in Pleasant Prairie, WI compared to nearest cities:
(Note: Based on data for the last 3 years, including only cities with population 5,000 and above)
| Pleasant Prairie: | 20.6 |
| Kenosha: | 23.0 |
| Somers: | 39.9 |
| Sturtevant: | 43.0 |
| Mount Pleasant: | 8.9 |
| Salem: | 27.3 |
| Racine: | 33.7 |
| Caledonia: | 8.1 |
| Twin Lakes: | 47.0 |
 The median response time based on all reported fire incidents is 5 minutes. This is lower compared to the state median value.
The median response time in Pleasant Prairie, WI compared to nearest cities:
(Note: Based on data for all years, including only cities with at least 500 fire incidents)
| Pleasant Prairie: | 5 minutes |
| Kenosha: | 4 minutes |
| Winthrop Harbor: | 5 minutes |
| Zion: | 5 minutes |
| Wadsworth: | 7 minutes |
| Beach Park: | 6 minutes |
| Waukegan: | 5 minutes |
| Gurnee: | 6 minutes |
| Antioch: | 8 minutes |
 Based on the data from the years 2002 - 2018 the average number of fire-related casualties per year is 2. The highest number of casualties - 8 took place in 2010, and the lowest - 0 in 2006. The data has a decreasing trend.
The average number of casualties per 1,000 fires is 48. This indicator was the highest - 200 in 2010, and the lowest 0 in 2006. The trend for injuries per 1,000 fires is dropping. Compared to the Wisconsin value the number of casualties per 1,000 fires is much higher.
Based on the data from the years 2002 - 2018 the average number of fire-related casualties per year is 2. The highest number of casualties - 8 took place in 2010, and the lowest - 0 in 2006. The data has a decreasing trend.
The average number of casualties per 1,000 fires is 48. This indicator was the highest - 200 in 2010, and the lowest 0 in 2006. The trend for injuries per 1,000 fires is dropping. Compared to the Wisconsin value the number of casualties per 1,000 fires is much higher.Casualties per 1,000 incidents in Pleasant Prairie, WI compared to nearest cities:
(Note: Based on data for all years, including only cities with at least 500 fire incidents)
| Pleasant Prairie: | 48.8 |
| Kenosha: | 26.3 |
| Winthrop Harbor: | 15.2 |
| Zion: | 11.7 |
| Wadsworth: | 5.1 |
| Beach Park: | 8.1 |
| Waukegan: | 23.1 |
| Gurnee: | 25.4 |
| Antioch: | 7.2 |
 35.3% incidents where reported in the morning and 64.7% in the evening. The most fires (16.7%) took place on Tuesday, and the least (11.4%) on Wednesday.
 According to the 737 fires from years 2002 - 2018 most fires (11.7%) took place during May, and the least (5.8%) in September.
 Out of all 10,618 cases reported during the years 2002 - 2018, the most belonged to the categories: Rescue & EMS (61.3%), False Alarm (13.7%), and Hazardous Condition (7.0%).
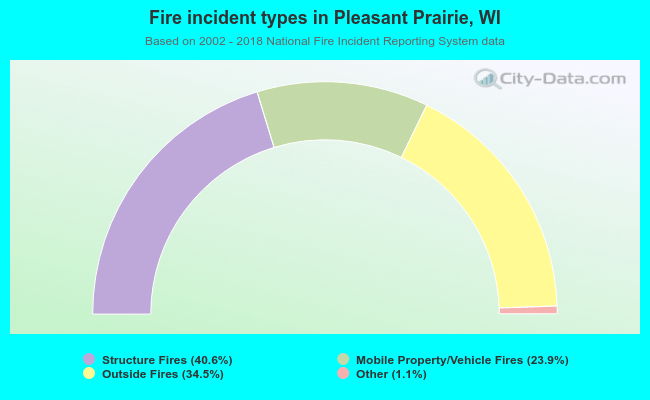 When looking into fire subcategories, the most reports belonged to: Structure Fires (40.6%), and Outside Fires (34.5%).