Prairie Village: Fire Incidents, Kansas (KS)
Where are fire incidents reported in Prairie Village, KS
Something went wrong! Please refresh the page.
|
| |||||||||||||||||||||||||||||||||||||||||||||||||||||||||||||||||||||||||||||||||||||||||||||||||||||||||||||
2002 - 2018 National Fire Incident Reporting System (NFIRS) incidents
- Incident types reported to NFIRS in Prairie Village, KS
- 5,43250.3%Rescue & EMS
- 1,74316.1%Good Intent Call
- 1,17610.9%Hazardous Condition
- 1,09410.1%False Alarm
- 8387.8%Service Call
- 4914.5%Fire
- 120.1%Overpressure Rupture
- Fire incident types reported to NFIRS in Prairie Village, KS
- 28958.9%Structure Fires
- 14629.7%Outside Fires
- 469.4%Mobile Property/Vehicle Fires
- 102.0%Other
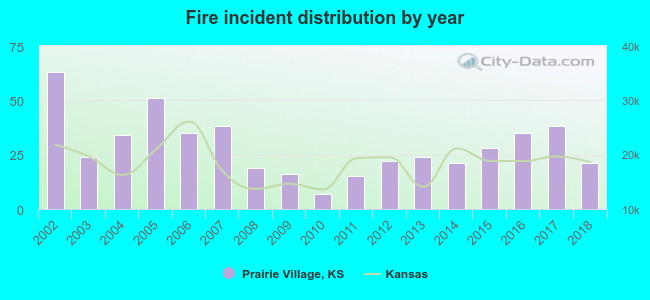 Based on the data from the years 2002 - 2018 the average number of fires per year is 29. The highest number of reported fire incidents - 63 took place in 2002, and the least - 7 in 2010. The data has a dropping trend.
The average number of yearly fire incidents per 10k residents in Prairie Village, KS compared to nearest cities:
(Note: Based on data for the last 3 years, including only cities with population 5,000 and above)
| Prairie Village: | 14.3 |
| Mission: | 28.1 |
| Roeland Park: | 22.9 |
| Merriam: | 38.7 |
| Overland Park: | 21.0 |
| Leawood: | 17.8 |
| Lenexa: | 30.4 |
| Shawnee: | 23.6 |
| Kansas City: | 42.0 |

 35.0% incidents where reported in the morning and 65.0% in the evening. The most fires (18.5%) took place on Saturday, and the least (11.8%) on Thursday.
 Based on the 491 fire incidents from years 2002 - 2018 most fires (11.0%) took place during January, and the least (5.7%) in May.
 Out of all 10,797 cases reported during the years 2002 - 2018, the most belonged to the categories: Rescue & EMS (50.3%), Good Intent Call (16.1%), and Hazardous Condition (10.9%).
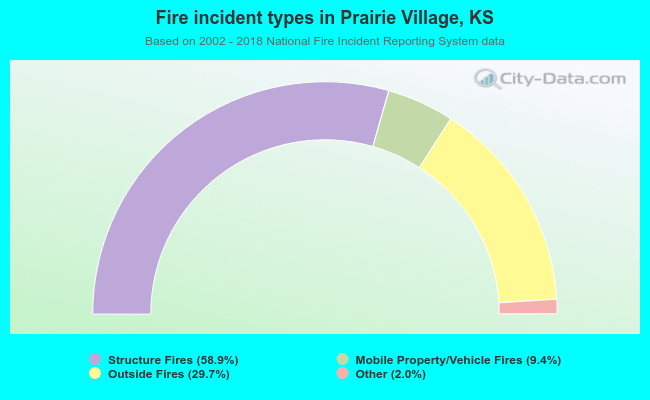 When looking into fire subcategories, the most reports belonged to: Structure Fires (58.9%), and Outside Fires (29.7%).