Raleigh: Fire Incidents, North Carolina (NC)
Where are fire incidents reported in Raleigh, NC
Something went wrong! Please refresh the page.
| Fire incidents reported | |
|---|---|
| Sreet name | Count |
| CAPITAL BLVD | 838 |
| GLENWOOD AVE | 610 |
| NEW BERN AVE | 456 |
| POOLE RD | 334 |
| SIX FORKS RD | 310 |
| ROCK QUARRY RD | 268 |
| FALLS OF NEUSE RD | 264 |
| HILLSBOROUGH ST | 252 |
| TRYON RD | 236 |
| CREEDMOOR RD | 232 |
| LOUISBURG RD | 228 |
| FAYETTEVILLE RD | 222 |
| LEESVILLE RD | 214 |
| LAKE WHEELER RD | 196 |
| WAKE FOREST RD | 184 |
| BUFFALOE RD | 178 |
| I 440 WB | 176 |
| I 40 WB | 172 |
| I 40 EB | 170 |
| NEW HOPE RD | 170 |
| BLUE RIDGE RD | 166 |
| N NEW HOPE RD | 162 |
| WESTERN BLVD | 154 |
| I 440 EB | 148 |
| AVENT FERRY RD | 146 |
| EDWARDS MILL RD | 144 |
| S WILMINGTON ST | 144 |
| SPRING FOREST RD | 144 |
| WADE AVE | 134 |
| GARNER RD | 124 |
| Other | 13,537 |
2002 - 2018 National Fire Incident Reporting System (NFIRS) incidents
- Incident types reported to NFIRS in Raleigh, NC
- 124,03551.8%Rescue & EMS
- 29,01112.1%Good Intent Call
- 29,00912.1%False Alarm
- 22,2559.3%Hazardous Condition
- 20,7138.6%Fire
- 13,9125.8%Service Call
- 2940.1%Overpressure Rupture
- Fire incident types reported to NFIRS in Raleigh, NC
- 7,84837.9%Outside Fires
- 7,67837.1%Structure Fires
- 4,13620.0%Mobile Property/Vehicle Fires
- 1,0515.1%Other
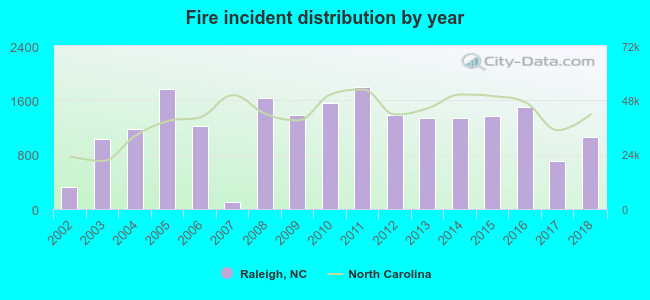 Based on the data from the years 2002 - 2018 the average number of fires per year is 1,218. The highest number of reported fires - 1,802 took place in 2011, and the least - 109 in 2007. The data has a growing trend.
The average number of yearly fire incidents per 10k residents in Raleigh, NC compared to nearest cities:
(Note: Based on data for the last 3 years, including only cities with population 5,000 and above)
| Raleigh: | 24.8 |
| Garner: | 53.3 |
| Knightdale: | 119.9 |
| Cary: | 16.8 |
| Morrisville: | 25.0 |
| Rolesville: | 25.9 |
| Wake Forest: | 42.9 |
| Apex: | 26.2 |
| Holly Springs: | 24.0 |
 The median response time based on all reported fire incidents is 5 minutes. This is lower compared to the state median value.
The median response time in Raleigh, NC compared to nearest cities:
(Note: Based on data for all years, including only cities with at least 500 fire incidents)
| Raleigh: | 5 minutes |
| Garner: | 5 minutes |
| Knightdale: | 5 minutes |
| Cary: | 5 minutes |
| Morrisville: | 6 minutes |
| Wake Forest: | 6 minutes |
| Apex: | 6 minutes |
| Holly Springs: | 6 minutes |
| Wendell: | 6 minutes |
 Based on the reports from the years 2002 - 2018 the average number of fire-related yearly deaths is 1. The highest number of deaths - 2 took place in 2005, and the lowest - 0 in 2002. The data has a growing trend.
The average number of fatalities per 1,000 fire incidents is 1. This indicator was the highest - 3 in 2017, and the lowest 0 in 2002. The trend for deaths per 1,000 incidents is rising. Compared to the state value the number of fatalities per 1,000 incidents is much lower.
Based on the reports from the years 2002 - 2018 the average number of fire-related yearly deaths is 1. The highest number of deaths - 2 took place in 2005, and the lowest - 0 in 2002. The data has a growing trend.
The average number of fatalities per 1,000 fire incidents is 1. This indicator was the highest - 3 in 2017, and the lowest 0 in 2002. The trend for deaths per 1,000 incidents is rising. Compared to the state value the number of fatalities per 1,000 incidents is much lower.Deaths per 1,000 incidents in Raleigh, NC compared to nearest cities:
(Note: Based on data for all years, including only cities with at least 2,500 fire incidents)
| Raleigh: | 0.6 |
| Garner: | 1.6 |
| Cary: | 1.1 |
| Wake Forest: | 0.0 |
| Clayton: | 0.0 |
| Durham: | 1.4 |
| Chapel Hill: | 0.5 |
| Lillington: | 2.1 |
| Dunn: | 1.5 |
 Based on the data from the years 2002 - 2018 the average number of fire-related yearly casualties is 9. The highest number of reported casualties - 23 took place in 2011, and the lowest - 0 in 2002. The data has an increasing trend.
The average number of casualties per 1,000 fires is 6. This indicator was the highest - 17 in 2012, and the lowest 0 in 2002. The trend for injuries per 1,000 fires is increasing. Compared to the state value the number of injuries per 1,000 fires is similar.
Based on the data from the years 2002 - 2018 the average number of fire-related yearly casualties is 9. The highest number of reported casualties - 23 took place in 2011, and the lowest - 0 in 2002. The data has an increasing trend.
The average number of casualties per 1,000 fires is 6. This indicator was the highest - 17 in 2012, and the lowest 0 in 2002. The trend for injuries per 1,000 fires is increasing. Compared to the state value the number of injuries per 1,000 fires is similar.Casualties per 1,000 incidents in Raleigh, NC compared to nearest cities:
(Note: Based on data for all years, including only cities with at least 500 fire incidents)
| Raleigh: | 7.0 |
| Garner: | 2.4 |
| Knightdale: | 12.1 |
| Cary: | 12.2 |
| Morrisville: | 6.8 |
| Wake Forest: | 2.2 |
| Apex: | 6.6 |
| Holly Springs: | 2.5 |
| Wendell: | 1.1 |
 28.9% incidents where reported in the morning and 71.1% in the evening. The most fires (16.2%) took place on Saturday, and the least (13.3%) on Tuesday.
 Based on the 20,713 fire incidents from years 2002 - 2018 most fires (10.4%) took place during April, and the least (6.6%) in October.
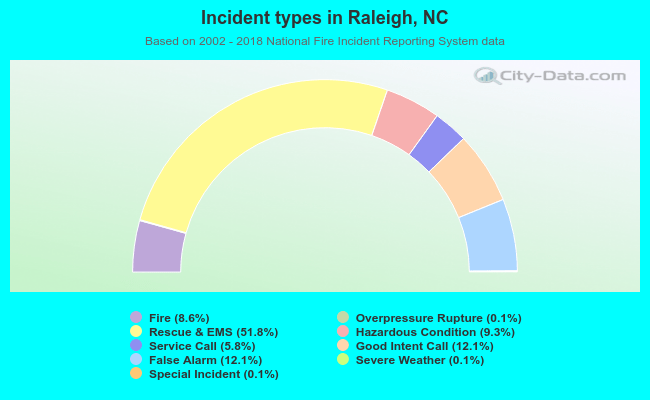 Out of all 239,648 cases reported during the years 2002 - 2018, the most belonged to the categories: Rescue & EMS (51.8%), Good Intent Call (12.1%), and False Alarm (12.1%).
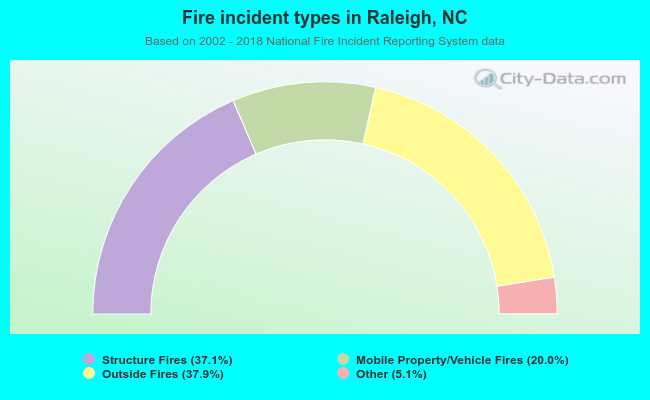 When looking into fire subcategories, the most incidents belonged to: Outside Fires (37.9%), and Structure Fires (37.1%).