Spring Valley: Fire Incidents, California (CA)
Where are fire incidents reported in Spring Valley, CA
Something went wrong! Please refresh the page.
|
| |||||||||||||||||||||||||||||||||||||||||||||||||||||||||||||||||||||||||||||||||||||||||||||||||||||||||||||
2005 - 2018 National Fire Incident Reporting System (NFIRS) incidents
- Incident types reported to NFIRS in Spring Valley, CA
- 4,11764.3%Rescue & EMS
- 94014.7%Good Intent Call
- 4837.5%Fire
- 4497.0%Service Call
- 2363.7%Hazardous Condition
- 1672.6%False Alarm
- Fire incident types reported to NFIRS in Spring Valley, CA
- 19139.5%Structure Fires
- 16133.3%Outside Fires
- 9018.6%Mobile Property/Vehicle Fires
- 418.5%Other
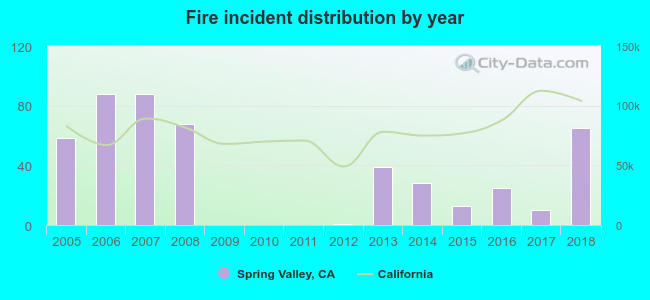 Based on the data from the years 2005 - 2018 the average number of fire incidents per year is 35. The highest number of fire incidents - 88 took place in 2006, and the least - 0 in 2009. The data has an increasing trend.
The average number of yearly fire incidents per 10k residents in Spring Valley, CA compared to nearest cities:
(Note: Based on data for the last 3 years, including only cities with population 5,000 and above)
| Spring Valley: | 11.8 |
| Lemon Grove: | 8.2 |
| La Mesa: | 6.2 |
| El Cajon: | 14.4 |
| Jamul: | 33.0 |
| Bonita: | 16.7 |
| National City: | 27.8 |
| Santee: | 16.9 |
| Chula Vista: | 9.6 |

 33.1% incidents where reported in the morning and 66.9% in the evening. The most fires (18.2%) took place on Monday, and the least (12.0%) on Sunday.
 According to the 483 fires from years 2005 - 2018 most fires (10.6%) took place during October, and the least (6.4%) in February.
 Out of all 6,399 cases reported during the years 2005 - 2018, the most belonged to the categories: Rescue & EMS (64.3%), Good Intent Call (14.7%), and Fire (7.5%).
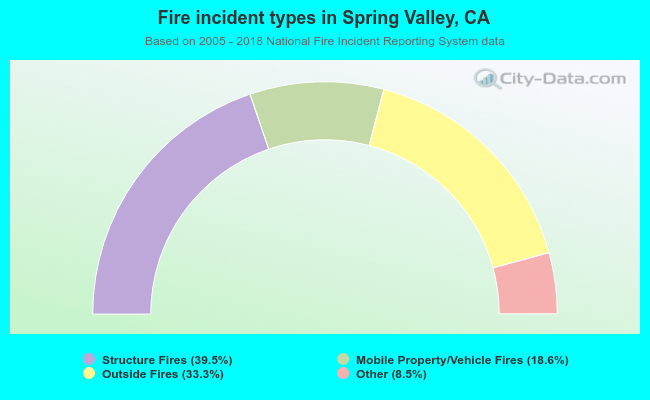 When looking into fire subcategories, the most incidents belonged to: Structure Fires (39.5%), and Outside Fires (33.3%).