Zephyr Cove: Fire Incidents, Nevada (NV)
Where are fire incidents reported in Zephyr Cove, NV
Something went wrong! Please refresh the page.
|
| |||||||||||||||||||||||||||||||||||||||||||||||||||||||||||||||||||||||||||||||||||||||||||||||||||||||||||||
2003 - 2018 National Fire Incident Reporting System (NFIRS) incidents
- Incident types reported to NFIRS in Zephyr Cove, NV
- 76351.4%Rescue & EMS
- 16210.9%False Alarm
- 15010.1%Hazardous Condition
- 1459.8%Service Call
- 1318.8%Fire
- 1067.1%Good Intent Call
- 211.4%Special Incident
- 60.4%Severe Weather
- Fire incident types reported to NFIRS in Zephyr Cove, NV
- 5844.3%Outside Fires
- 3325.2%Structure Fires
- 2216.8%Other
- 1813.7%Mobile Property/Vehicle Fires
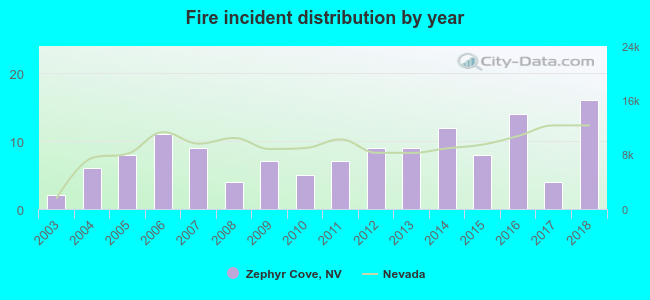 According to the data from the years 2003 - 2018 the average number of fires per year is 8. The highest number of reported fire incidents - 16 took place in 2018, and the least - 2 in 2003. The data has a growing trend.
The average number of yearly fire incidents per 10k residents in Zephyr Cove, NV compared to nearest cities:
(Note: Based on data for the last 3 years, including only cities with population 5,000 and above)
| Zephyr Cove: | 15.2 |
| Indian Hills: | 1.8 |
| Gardnerville: | 69.5 |
| Gardnerville Ranchos: | 0.9 |
| Carson City: | 28.3 |
| Incline Village: | 20.3 |
| Washoe Valley: | 14.4 |
| Dayton: | 45.0 |
| Reno: | 41.0 |

 26.7% incidents where reported in the morning and 73.3% in the evening. The most fires (16.8%) took place on Monday, and the least (11.5%) on Tuesday.
 Based on the 131 fire incident reports from years 2003 - 2018 most fires (19.8%) took place during June, and the least (3.1%) in February.
 Out of all 1,485 cases reported during the years 2003 - 2018, the most belonged to the categories: Rescue & EMS (51.4%), False Alarm (10.9%), and Hazardous Condition (10.1%).
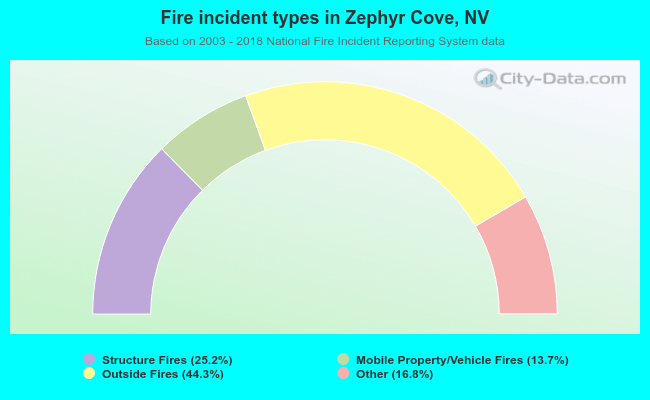 When looking into fire subcategories, the most incidents belonged to: Outside Fires (44.3%), and Structure Fires (25.2%).