Housing density: 214 houses/condos per square mile
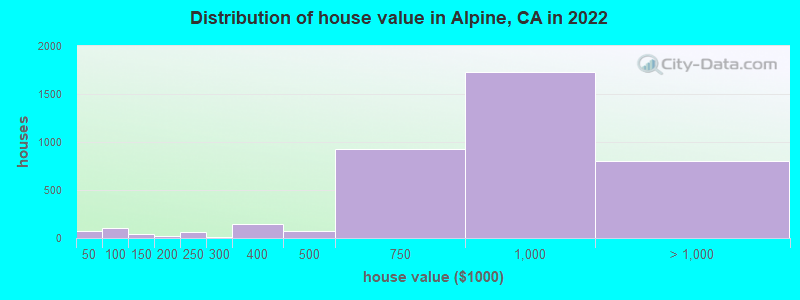
Median price asked for vacant for-sale houses and condos in 2022 in this county: $1,340,665.
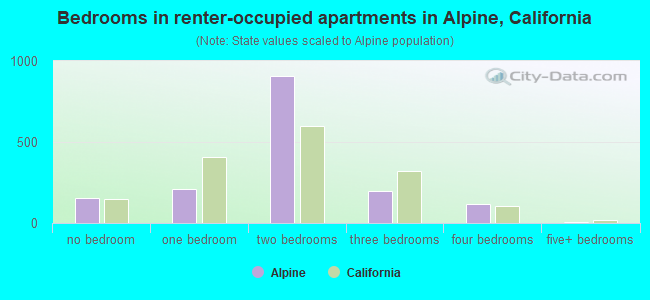
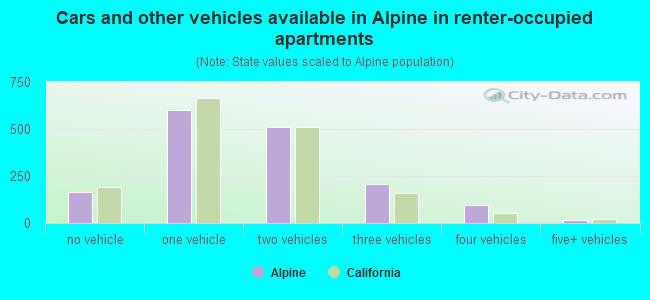
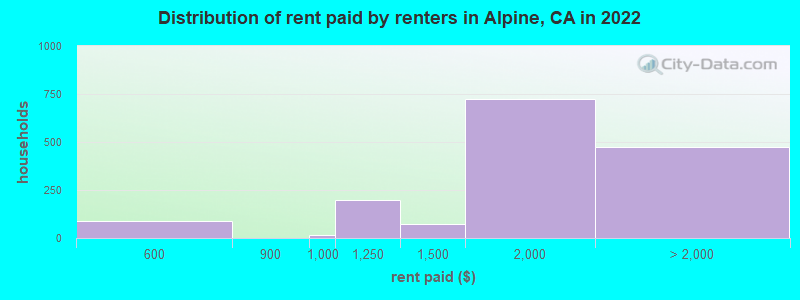
Median contract rent in 2022: $1,802 (lower quartile is $1,530, upper quartile is over $2,000)
Median rent asked for vacant for-rent units in 2022: $1,712
Median gross rent in Alpine, CA in 2022: $1,957
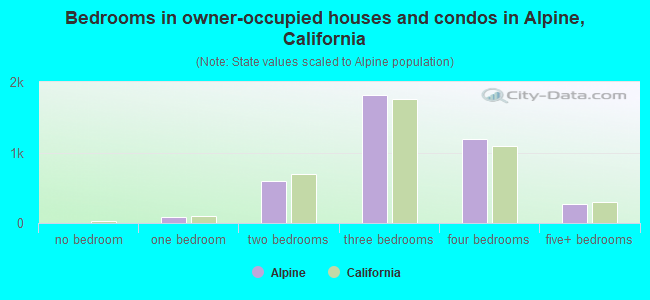
Housing units in Alpine with a mortgage: 3,003 (320 second mortgage, 7 home equity loan, 310 both second mortgage and home equity loan) Houses without a mortgage: 60
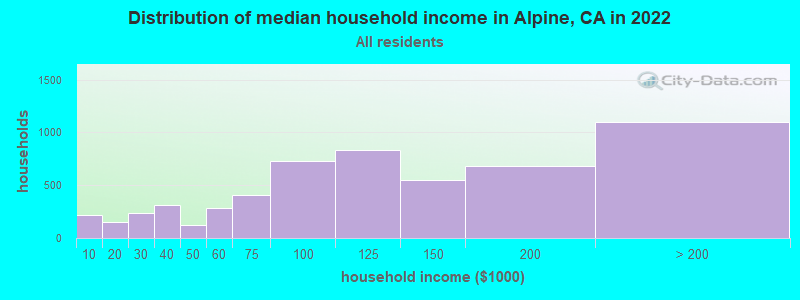
Median household income for houses/condos with a mortgage: $133,989
Median household income for apartments without a mortgage: $75,360
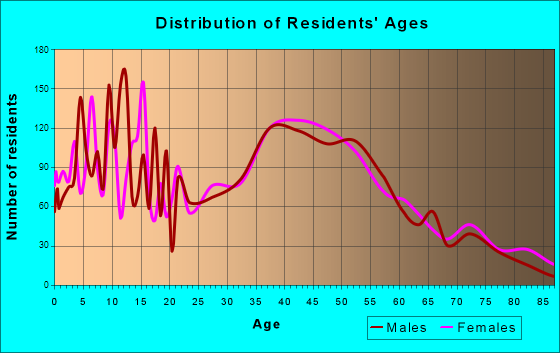
Size of family households: 1,742 2-persons, 867 3-persons, 948 4-persons, 344 5-persons, 185 6-persons, 65 7-or-more-persons.
Size of nonfamily households: 1,080 1-person, 290 2-persons, 41 3-persons.
2,267 married couples with children.
755 single-parent households (435 men, 320 women).
82.0% of residents of Alpine speak English at home.
11.9% of residents speak Spanish at home (67% speak English very well, 15% speak English well, 14% speak English not well, 4% don't speak English at all).
3.2% of residents speak other Indo-European language at home (91% speak English very well, 9% speak English well).
2.4% of residents speak Asian or Pacific Island language at home (37% speak English very well, 54% speak English well, 9% speak English not well).
0.2% of residents speak other language at home (100% speak English very well).
Foreign born population: 1,307 (8.2%)
(71.3% of them are naturalized citizens)
Percentage of workers working in this county: 99.6% Number of people working at home: 728 (10.0% of all workers)
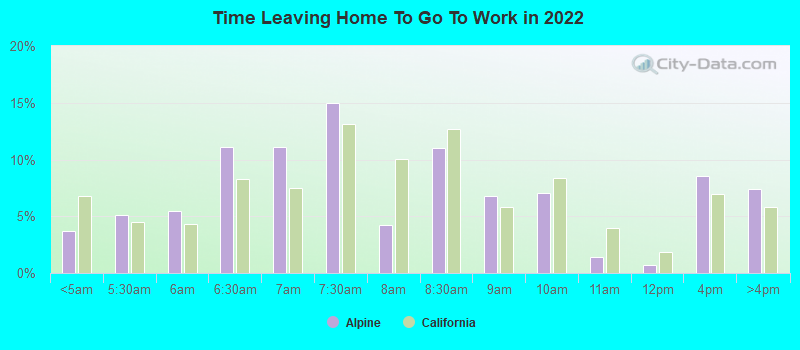
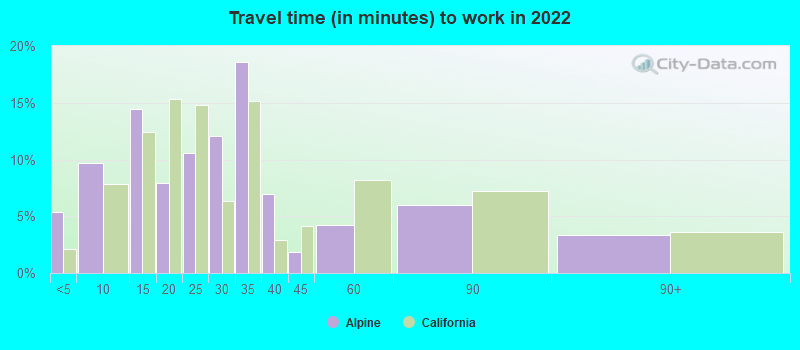
Travel time to work (commute)
Less than 5 minutes: 224
5 to 9 minutes: 469
10 to 14 minutes: 761
15 to 19 minutes: 305
20 to 24 minutes: 858
25 to 29 minutes: 574
30 to 34 minutes: 1,111
35 to 39 minutes: 441
40 to 44 minutes: 463
45 to 59 minutes: 626
60 to 89 minutes: 529
90 or more minutes: 7
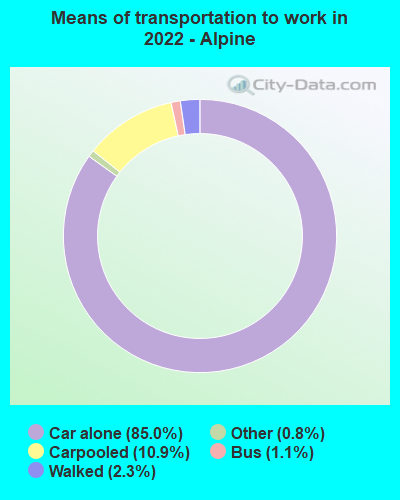
Means of transportation to work:
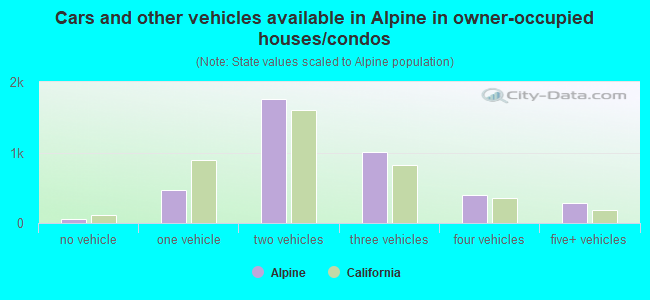
Drove a car alone: 2,251 (66.8%)
Carpooled: 300 (8.9%)
Bus: 25 (0.7%)
Taxi: 22 (0.7%)
Walked: 66 (2.0%)
Worked at home: 728 (21.6%)
Unemployment by race in 2022
Unemployment rate for White non-Hispanic residents
3.0%Males
5.8%Females
Unemployment rate for Black residents
7.8%Males
24.0%Females
Unemployment rate for Asian residents
2.9%Females
Unemployment rate for other race residents
6.5%Males
Unemployment rate for two or more race residents
18.8%Males
Unemployment rate for Hispanic or Latino residents
9.9%Males
2.8%Females
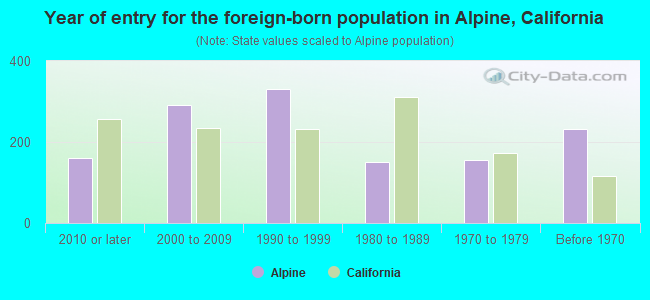
Year of entry for the foreign-born population in Alpine, California
1612010 or later
2922000 to 2009
3321990 to 1999
1501980 to 1989
1551970 to 1979
232Before 1970
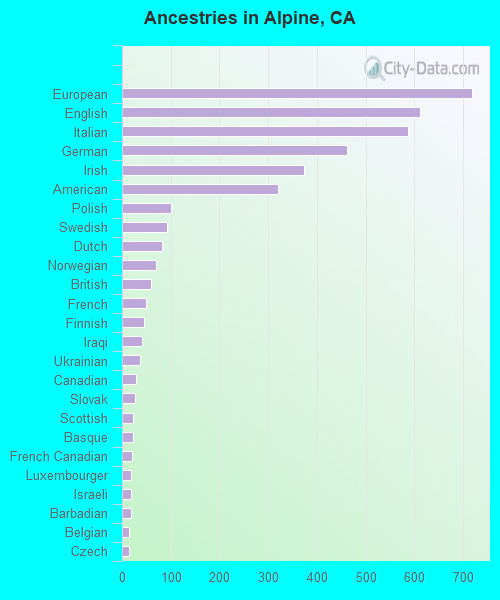
First ancestries reported:
European: 717 (11.0%)
English: 611 (9.4%)
Italian: 587 (9.0%)
German: 461 (7.1%)
Irish: 374 (5.7%)
American: 319 (4.9%)
Polish: 101 (1.5%)
Swedish: 93 (1.4%)
Dutch: 83 (1.3%)
Norwegian: 69 (1.1%)
British: 59 (0.9%)
French: 49 (0.8%)
Finnish: 45 (0.7%)
Iraqi: 41 (0.6%)
Ukrainian: 37 (0.6%)
Canadian: 28 (0.4%)
Slovak: 27 (0.4%)
Scottish: 23 (0.4%)
Basque: 22 (0.3%)
French Canadian: 20 (0.3%)
Luxembourger: 19 (0.3%)
Israeli: 18 (0.3%)
Barbadian: 18 (0.3%)
Belgian: 15 (0.2%)
Czech: 15 (0.2%)
Swiss: 14 (0.2%)
Welsh: 14 (0.2%)
Cajun: 10 (0.2%)
Northern European: 10 (0.2%)
Portuguese: 10 (0.2%)
Scotch-Irish: 10 (0.2%)
Austrian: 9 (0.1%)
Eastern European: 8 (0.1%)
Scandinavian: 8 (0.1%)
Most common places of birth for foreign-born residents (%):
Mexico
Alpine:
43.9% (574)
California:
37.2% (3,881,193)
Philippines
Alpine:
12.1% (158)
California:
7.8% (818,297)
Canada
Alpine:
9.4% (123)
California:
1.2% (127,477)
Trinidad and Tobago
Alpine:
9.1% (119)
California:
0.1% (5,643)
Germany
Alpine:
4.4% (58)
California:
0.7% (73,304)
China, excluding Hong Kong and Taiwan
Alpine:
3.2% (42)
California:
6.6% (684,672)
Korea
Alpine:
3.2% (42)
California:
3.0% (315,248)
Czechoslovakia (includes Czech Republic and Slovakia)
Alpine:
2.1% (28)
California:
0.1% (9,241)
Pakistan
Alpine:
2.0% (26)
California:
0.5% (49,399)
Place of birth for U.S.-born residents:
This state: 11,115
Other state: 3,383
Northeast: 816
Midwest: 1,143
South: 612
West: 794
86.0% of Alpine residents lived in the same house 1 years ago. Out of people who lived in different houses, 44.1% lived in this county. Out of people who lived in different counties, 16.4% lived in California.
Alpine:
86.0%
State average:
88.9%
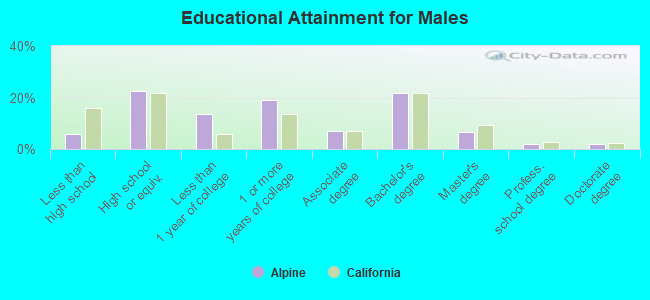
Education attainment for males 25 years and older:
No schooling: 99
Nursery to 4th grade: 21
5th and 6th grade: 0
7th and 8th grade: 0
9th grade: 11
10th grade: 33
11th grade: 30
12th grade, no diploma: 123
High school graduate (or equivalency): 1,185
Less than 1 year of college: 729
Some college more than 1 year, no degree: 1,013
Associate degree: 367
Bachelor's degree: 1,154
Master's degree: 341
Professional school degree: 96
Doctorate degree: 96
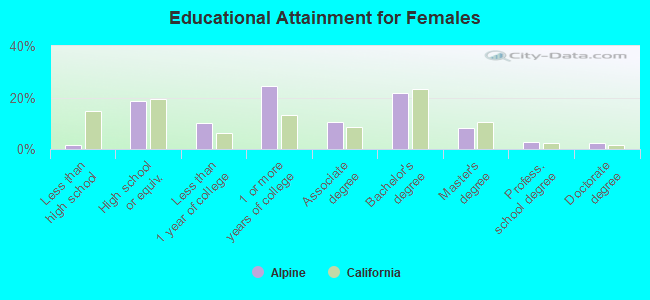
Education attainment for females 25 years and older:
No schooling: 32
Nursery to 4th grade: 0
5th and 6th grade: 0
7th and 8th grade: 4
9th grade: 0
10th grade: 6
11th grade: 18
12th grade, no diploma: 26
High school graduate (or equivalency): 1,068
Less than 1 year of college: 586
Some college more than 1 year, no degree: 1,416
Associate degree: 601
Bachelor's degree: 1,250
Master's degree: 481
Professional school degree: 165
Doctorate degree: 129
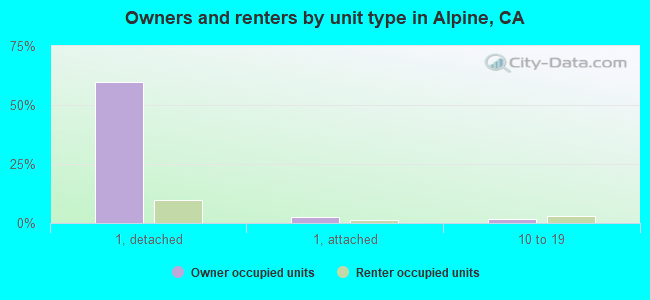
Housing units in structures:
One, detached: 4,096
One, attached: 235
Two: 65
3 or 4: 96
5 to 9: 263
10 to 19: 265
20 to 49: 79
50 or more: 332
Mobile homes: 284
Boats, RVs, vans, etc.: 31
Median worth of mobile homes: $126,598
Housing units lacking complete plumbing facilities in 2022: 1.9%
Housing units lacking complete kitchen facilities in 2022: 1.9%
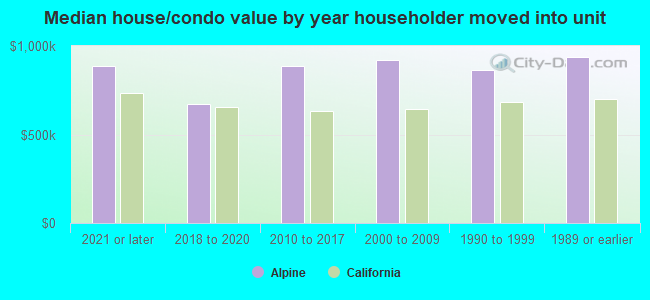
House/condo owner moved in on average 14 years ago