Housing density: 2,865 houses/condos per square mile
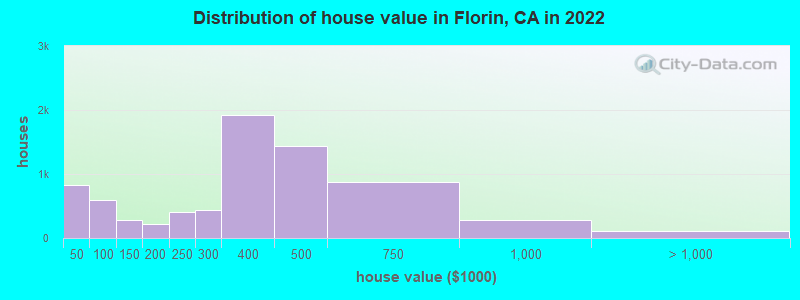
Median price asked for vacant for-sale houses and condos in 2022: $196,379.
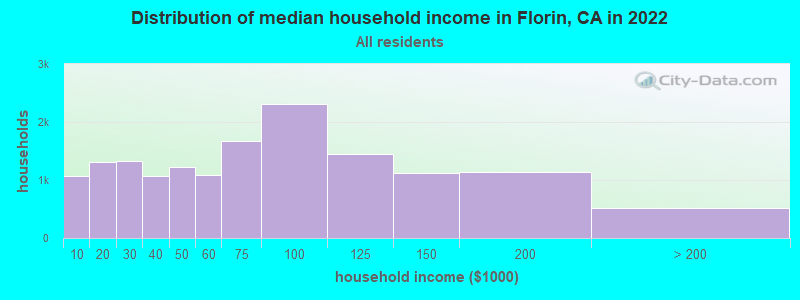
Median contract rent in 2022: $1,259 (lower quartile is $937, upper quartile is $1,648)
Median rent asked for vacant for-rent units in 2022: $1,835
Median gross rent in Florin, CA in 2022: $1,460
Housing units in Florin with a mortgage: 5,131 (291 second mortgage, 90 home equity loan, 140 both second mortgage and home equity loan) Houses without a mortgage: 34
Median household income for houses/condos with a mortgage: $86,144
Median household income for apartments without a mortgage: $64,391
5,930 married couples with children.
4,549 single-parent households (1,379 men, 3,170 women).
43.5% of residents of Florin speak English at home.
23.0% of residents speak Spanish at home (59% speak English very well, 15% speak English well, 21% speak English not well, 5% don't speak English at all).
6.1% of residents speak other Indo-European language at home (52% speak English very well, 25% speak English well, 16% speak English not well, 7% don't speak English at all).
28.1% of residents speak Asian or Pacific Island language at home (37% speak English very well, 29% speak English well, 27% speak English not well, 7% don't speak English at all).
1.2% of residents speak other language at home (59% speak English very well, 39% speak English well, 2% speak English not well).
Foreign born population: 17,123 (34.1%)
(57.6% of them are naturalized citizens)
Percentage of workers working in this county: 87.7% Number of people working at home: 2,432 (11.4% of all workers)
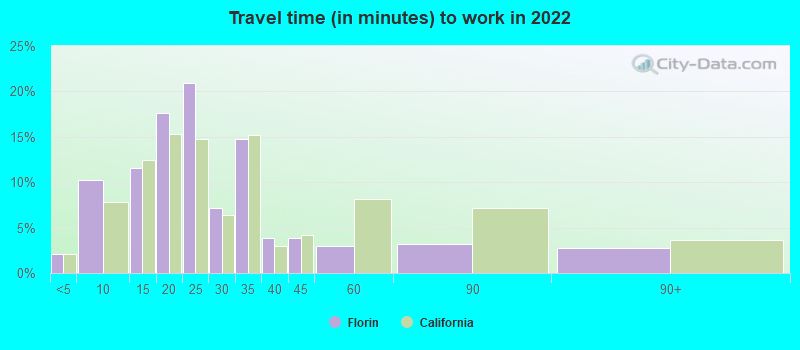
Travel time to work (commute)
Less than 5 minutes: 168
5 to 9 minutes: 1,490
10 to 14 minutes: 2,237
15 to 19 minutes: 3,508
20 to 24 minutes: 3,276
25 to 29 minutes: 1,173
30 to 34 minutes: 3,216
35 to 39 minutes: 769
40 to 44 minutes: 781
45 to 59 minutes: 963
60 to 89 minutes: 607
90 or more minutes: 313
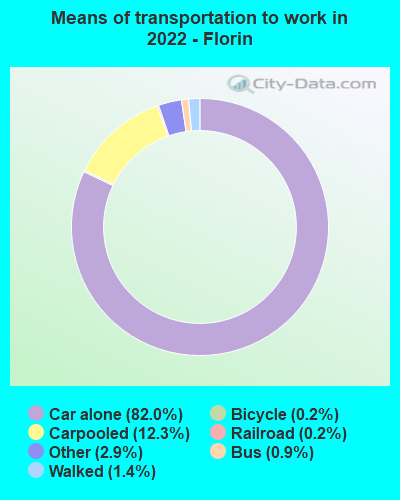
Means of transportation to work:
Drove a car alone: 9,131 (67.1%)
Carpooled: 1,411 (10.4%)
Bus: 55 (0.4%)
Long-distance train or commuter rail: 3 (0.0%)
Light rail, streetcar or trolley: 15 (0.1%)
Taxi: 391 (2.9%)
Bicycle: 18 (0.1%)
Walked: 179 (1.3%)
Worked at home: 2,432 (17.9%)
Unemployment by race in 2022
Unemployment rate for White non-Hispanic residents
17.0%Males
0.9%Females
Unemployment rate for Black residents
27.8%Males
9.7%Females
Unemployment rate for American Indian and Alaska Native residents
1.3%Males
Unemployment rate for Asian residents
8.1%Males
2.5%Females
Unemployment rate for other race residents
6.0%Males
4.4%Females
Unemployment rate for two or more race residents
9.6%Males
3.5%Females
Unemployment rate for Hispanic or Latino residents
4.7%Males
3.9%Females
Year of entry for the foreign-born population in Florin, California
4,5582010 or later
3,7792000 to 2009
3,7951990 to 1999
2,1371980 to 1989
7481970 to 1979
542Before 1970
First ancestries reported:
American: 717 (2.3%)
Afghan: 305 (1.0%)
German: 282 (0.9%)
English: 242 (0.8%)
Romanian: 194 (0.6%)
Irish: 189 (0.6%)
European: 166 (0.5%)
Italian: 163 (0.5%)
African: 140 (0.4%)
Nigerian: 112 (0.4%)
Portuguese: 95 (0.3%)
Polish: 78 (0.2%)
Russian: 60 (0.2%)
Dutch: 46 (0.1%)
French: 44 (0.1%)
Scottish: 37 (0.1%)
Sierra Leonean: 30 (0.09%)
Ghanaian: 28 (0.09%)
Iranian: 27 (0.09%)
Swiss: 24 (0.08%)
Norwegian: 17 (0.05%)
Lebanese: 16 (0.05%)
Maltese: 15 (0.05%)
Palestinian: 15 (0.05%)
Welsh: 11 (0.03%)
Moroccan: 9 (0.03%)
Eastern European: 9 (0.03%)
Egyptian: 8 (0.03%)
Belgian: 8 (0.03%)
Northern European: 7 (0.02%)
Swedish: 6 (0.02%)
Ukrainian: 5 (0.02%)
West Indian: 5 (0.02%)
Scotch-Irish: 4 (0.01%)
Greek: 3 (0.01%)
British: 3 (0.01%)
Most common places of birth for foreign-born residents (%):
Mexico
Florin:
24.5% (4,075)
California:
37.2% (3,881,193)
Vietnam
Florin:
22.0% (3,662)
California:
4.9% (512,335)
Philippines
Florin:
7.7% (1,284)
California:
7.8% (818,297)
China, excluding Hong Kong and Taiwan
Florin:
5.9% (988)
California:
6.6% (684,672)
Laos
Florin:
5.6% (940)
California:
0.5% (48,911)
Thailand
Florin:
5.3% (880)
California:
0.6% (65,335)
India
Florin:
4.3% (722)
California:
5.2% (539,184)
Fiji
Florin:
4.3% (720)
California:
0.3% (33,937)
Afghanistan
Florin:
2.8% (473)
California:
0.5% (53,260)
Marshall Islands
Florin:
1.8% (298)
California:
0.0% (1,626)
Guatemala
Florin:
1.8% (296)
California:
2.8% (290,436)
Place of birth for U.S.-born residents:
This state: 28,279
Other state: 4,272
Northeast: 626
Midwest: 1,302
South: 1,510
West: 837
92.3% of Florin residents lived in the same house 1 years ago. Out of people who lived in different houses, 43.9% lived in this county. Out of people who lived in different counties, 90.4% lived in California.
Florin:
92.3%
State average:
88.9%
Education attainment for males 25 years and older:
No schooling: 1,076
Nursery to 4th grade: 155
5th and 6th grade: 569
7th and 8th grade: 189
9th grade: 265
10th grade: 230
11th grade: 143
12th grade, no diploma: 853
High school graduate (or equivalency): 5,541
Less than 1 year of college: 1,424
Some college more than 1 year, no degree: 2,528
Associate degree: 1,433
Bachelor's degree: 1,648
Master's degree: 295
Professional school degree: 85
Doctorate degree: 110
Education attainment for females 25 years and older:
No schooling: 1,766
Nursery to 4th grade: 58
5th and 6th grade: 360
7th and 8th grade: 411
9th grade: 226
10th grade: 136
11th grade: 134
12th grade, no diploma: 670
High school graduate (or equivalency): 4,260
Less than 1 year of college: 1,376
Some college more than 1 year, no degree: 2,756
Associate degree: 1,601
Bachelor's degree: 1,833
Master's degree: 489
Professional school degree: 87
Doctorate degree: 0
Housing units in structures:
One, detached: 10,064
One, attached: 1,230
Two: 331
3 or 4: 529
5 to 9: 919
10 to 19: 548
20 to 49: 64
50 or more: 997
Mobile homes: 1,438
Boats, RVs, vans, etc.: 56
Median worth of mobile homes: $93,935
Housing units lacking complete plumbing facilities in 2022: 0.8%
Housing units lacking complete kitchen facilities in 2022: 0.6%
House/condo owner moved in on average 12 years ago