Mililani Town, HI (Hawaii) Houses and Residents
Estimated median house or condo value in 2022: $889,107 (it was $261,200 in 2000 )
Mililani Town:
$889,107Hawaii:
$820,100
Lower value quartile - upper value quartile: $654,802 - $1,049,544Mean price in 2022: Detached houses: $952,637 Here:
$952,637State:
$1,035,348
Townhouses or other attached units: $625,702 Here:
$625,702State:
$976,474
In 2-unit structures: $486,937 Here:
$486,937State:
$928,739
In 3-to-4-unit structures: $450,243 Here:
$450,243State:
$758,960
In 5-or-more-unit structures: $481,076 Here:
$481,076State:
$584,974
Total population: 27,629 (All urban)
Houses: 9,944 (9,753 occupied: 7,952 owner occupied, 1,831 renter occupied )
% of renters here:
19%State:
37%
Housing density: 2,544 houses/condos per square mile
Median price asked for vacant for-sale houses and condos in 2022 in this county: $1,374,313.
Median contract rent in 2022: $1,821 (lower quartile is $1,405, upper quartile is over $2,000)
Median rent asked for vacant for-rent units in 2022: $1,640
Median gross rent in Mililani Town, HI in 2022: over $2,000
Housing units in Mililani Town with a mortgage: 5,730 (1,238 second mortgage, 56 home equity loan, 1,096 both second mortgage and home equity loan )Houses without a mortgage: 398
Median household income for houses/condos with a mortgage: $126,761
Median household income for apartments without a mortgage: $113,050
Median monthly housing costs: $2,150
Data:
Median house or condo value ($)
Median house or condo value ($ change since 2000)
Median house or condo value ($) - White
Median house or condo value ($) - Black or African American
Median house or condo value ($) - Asian
Median house or condo value ($) - Hispanic or Latino
Median house or condo value ($) - American Indian and Alaska Native
Median house or condo value ($) - Multirace
Median house or condo value ($) - Other Race
Median price asked for mobile homes ($)
Household density (households per square mile)
Mean house or condo value by units in structure - 1, detached ($)
Mean house or condo value by units in structure - 1, attached ($)
Mean house or condo value by units in structure - 2 ($)
Mean house or condo value by units in structure by units in structure - 3 or 4 ($)
Mean house or condo value by units in structure - 5 or more ($)
Mean house or condo value by units in structure - Boat, RV, van, etc. ($)
Mean house or condo value by units in structure - Mobile home ($)
Median contract rent ($)
Median contract rent - Lower quartile ($)
Median contract rent - Upper quartile ($)
Median gross rent ($)
Urban houses (%)
Rural houses (%)
Houses occupied (%)
Houses occupied (% change since 2000)
Houses owner occupied (%)
Houses owner occupied (% change since 2000)
Houses renter occupied (%)
Houses renter occupied (% change since 2000)
Vacant housing units - For rent (%)
Vacant housing units - For rent (% change since 2000)
Vacant housing units - For sale only (%)
Vacant housing units - For sale only (% change since 2000)
Vacant housing units - Rented or sold, not occupied (%)
Vacant housing units - Rented or sold, not occupied (% change since 2000)
Vacant housing units - For seasonal, recreational, or occasional use (%)
Vacant housing units - For seasonal, recreational, or occasional use (% change since 2000)
Vacant housing units - For migrant workers (%)
Vacant housing units - For migrant workers (% change since 2000)
Vacant housing units - Other vacant (%)
Vacant housing units - Other vacant (% change since 2000)
Median monthly housing costs ($)
Median household income for houses/condos with a mortgage ($)
Median household income for houses/condos without a mortgage ($)
Median household income ($)
Median household income ($) - White
Median household income ($) - Black or African American
Median household income ($) - Asian
Median household income ($) - Hispanic or Latino
Median household income ($) - American Indian and Alaska Native
Median household income ($) - Multirace
Median household income ($) - Other Race
Mortgage status - with mortgage (%)
Mortgage status - with second mortgage (%)
Mortgage status - with home equity loan (%)
Mortgage status - with both second mortgage and home equity loan (%)
Mortgage status - without a mortgage (%)
Median year house/condo built
Median year apartment built
Household type by relationship - Male householder living alone (%)
Household type by relationship - Male householder not living alone (%)
Household type by relationship - Female householder living alone (%)
Household type by relationship - Female householder not living alone (%)
Household type by relationship - Opposite-Sex spouse (%)
Household type by relationship - Same-Sex spouse (%)
Household type by relationship - Opposite-Sex unmarried partner (%)
Household type by relationship - Same-Sex unmarried partner (%)
Household type by relationship - In group quarters (%)
Size of family households - 2-person household (%)
Size of family households - 3-person household (%)
Size of family households - 4-person household (%)
Size of family households - 5-person household (%)
Size of family households - 6-person household (%)
Size of family households - 7-or-more-person household (%)
Size of nonfamily households - 1-person household (%)
Size of nonfamily households - 2-person household (%)
Size of nonfamily households - 3-person household (%)
Size of nonfamily households - 4-person household (%)
Size of nonfamily households - 5-person household (%)
Size of nonfamily households - 6-person household (%)
Size of nonfamily households - 7-or-moreperson household (%)
Year house built - Built 2010 or later (%)
Year house built - Built 2000 to 2009 (%)
Year house built - Built 1990 to 1999 (%)
Year house built - Built 1980 to 1989 (%)
Year house built - Built 1970 to 1979 (%)
Year house built - Built 1960 to 1969 (%)
Year house built - Built 1950 to 1959 (%)
Year house built - Built 1940 to 1949 (%)
Year house built - Built 1939 or earlier (%)
Median number of rooms in houses and condos
Median number of rooms in apartments
Median number of bedrooms in owner occupied houses
Mean number of bedrooms in owner occupied houses
Median number of bedrooms in renter occupied houses
Mean number of bedrooms in renter occupied houses
Median number of vehichles in owner occupied houses
Mean number of vehichles in owner occupied houses
Median number of vehichles in renter occupied houses
Mean number of vehichles in renter occupied houses
Rooms in owner-occupied houses - 1 room (%)
Rooms in owner-occupied houses - 2 rooms (%)
Rooms in owner-occupied houses - 3 rooms (%)
Rooms in owner-occupied houses - 4 rooms (%)
Rooms in owner-occupied houses - 5 rooms (%)
Rooms in owner-occupied houses - 6 rooms (%)
Rooms in owner-occupied houses - 7 rooms (%)
Rooms in owner-occupied houses - 8 rooms (%)
Rooms in owner-occupied houses - 9+ rooms (%)
Rooms in renter-occupied houses - 1 room (%)
Rooms in renter-occupied houses - 2 rooms (%)
Rooms in renter-occupied houses - 3 rooms (%)
Rooms in renter-occupied houses - 4 rooms (%)
Rooms in renter-occupied houses - 5 rooms (%)
Rooms in renter-occupied houses - 6 rooms (%)
Rooms in renter-occupied houses - 7 rooms (%)
Rooms in renter-occupied houses - 8 rooms (%)
Rooms in renter-occupied houses - 9+ rooms (%)
Bedrooms in owner-occupied houses - no bedrooms (%)
Bedrooms in owner-occupied houses - 1 bedroom (%)
Bedrooms in owner-occupied houses - 2 bedrooms (%)
Bedrooms in owner-occupied houses - 3 bedrooms (%)
Bedrooms in owner-occupied houses - 4 bedrooms (%)
Bedrooms in owner-occupied houses - 5+ bedrooms (%)
Bedrooms in renter-occupied houses - no bedrooms (%)
Bedrooms in renter-occupied houses - 1 bedroom (%)
Bedrooms in renter-occupied houses - 2 bedrooms (%)
Bedrooms in renter-occupied houses - 3 bedrooms (%)
Bedrooms in renter-occupied houses - 4 bedrooms (%)
Bedrooms in renter-occupied houses - 5+ bedrooms (%)
Vehicles available in owner-occupied houses - no vehicle available (%)
Vehicles available in owner-occupied houses - 1 vehicle available(%)
Vehicles available in owner-occupied houses - 2 Vehicles available (%)
Vehicles available in owner-occupied houses - 3 Vehicles available (%)
Vehicles available in owner-occupied houses - 4 Vehicles available (%)
Vehicles available in owner-occupied houses - 5+ Vehicles available (%)
Vehicles available in renter-occupied houses - no vehicle available (%)
Vehicles available in renter-occupied houses - 1 vehicle available (%)
Vehicles available in renter-occupied houses - 2 Vehicles available (%)
Vehicles available in renter-occupied houses - 3 Vehicles available (%)
Vehicles available in renter-occupied houses - 4 Vehicles available (%)
Vehicles available in renter-occupied houses - 5+ Vehicles available (%)
Housing units in structures - 1, detached (%)
Housing units in structures - 1, attached (%)
Housing units in structures - 2 (%)
Housing units in structures - 3 or 4 (%)
Housing units in structures - 5 to 9 (%)
Housing units in structures - 10 to 19 (%)
Housing units in structures - 20 to 49 (%)
Housing units in structures - 50 or more (%)
Housing units in structures - Mobile home (%)
Housing units in structures - Boat, RV, van, etc. (%)
Housing units in structures - Owners - 1, detached (%)
Housing units in structures - Owners - 1, attached (%)
Housing units in structures - Owners - 2 (%)
Housing units in structures - Owners - 3 or 4 (%)
Housing units in structures - Owners - 5 to 9 (%)
Housing units in structures - Owners - 10 to 19 (%)
Housing units in structures - Owners - 20 to 49 (%)
Housing units in structures - Owners - 50 or more (%)
Housing units in structures - Owners - Mobile home (%)
Housing units in structures - Owners - Boat, RV, van, etc. (%)
Housing units in structures - Renters - 1, detached (%)
Housing units in structures - Renters - 1, attached (%)
Housing units in structures - Renters - 2 (%)
Housing units in structures - Renters - 3 or 4 (%)
Housing units in structures - Renters - 5 to 9 (%)
Housing units in structures - Renters - 10 to 19 (%)
Housing units in structures - Renters - 20 to 49 (%)
Housing units in structures - Renters - 50 or more (%)
Housing units in structures - Renters - Mobile home (%)
Housing units in structures - Renters - Boat, RV, van, etc. (%)
House/condo owner moved in on average (years ago)
Renter moved in on average (years ago)
Year householder moved into unit - Moved in 1999 to March 2000 (%)
Year householder moved into unit - Moved in 1999 to March 2000 (%) - White
Year householder moved into unit - Moved in 1999 to March 2000 (%) - Black or African American
Year householder moved into unit - Moved in 1999 to March 2000 (%) - Asian
Year householder moved into unit - Moved in 1999 to March 2000 (%) - Hispanic or Latino
Year householder moved into unit - Moved in 1999 to March 2000 (%) - American Indian and Alaska Native
Year householder moved into unit - Moved in 1999 to March 2000 (%) - Multirace
Year householder moved into unit - Moved in 1999 to March 2000 (%) - Other Race
Year householder moved into unit - Moved in 1995 to 1998 (%)
Year householder moved into unit - Moved in 1995 to 1998 (%) - White
Year householder moved into unit - Moved in 1995 to 1998 (%) - Black or African American
Year householder moved into unit - Moved in 1995 to 1998 (%) - Asian
Year householder moved into unit - Moved in 1995 to 1998 (%) - Hispanic or Latino
Year householder moved into unit - Moved in 1995 to 1998 (%) - American Indian and Alaska Native
Year householder moved into unit - Moved in 1995 to 1998 (%) - Multirace
Year householder moved into unit - Moved in 1995 to 1998 (%) - Other Race
Year householder moved into unit - Moved in 1990 to 1994 (%)
Year householder moved into unit - Moved in 1990 to 1994 (%) - White
Year householder moved into unit - Moved in 1990 to 1994 (%) - Black or African American
Year householder moved into unit - Moved in 1990 to 1994 (%) - Asian
Year householder moved into unit - Moved in 1990 to 1994 (%) - Hispanic or Latino
Year householder moved into unit - Moved in 1990 to 1994 (%) - American Indian and Alaska Native
Year householder moved into unit - Moved in 1990 to 1994 (%) - Multirace
Year householder moved into unit - Moved in 1990 to 1994 (%) - Other Race
Year householder moved into unit - Moved in 1980 to 1989 (%)
Year householder moved into unit - Moved in 1980 to 1989 (%) - White
Year householder moved into unit - Moved in 1980 to 1989 (%) - Black or African American
Year householder moved into unit - Moved in 1980 to 1989 (%) - Asian
Year householder moved into unit - Moved in 1980 to 1989 (%) - Hispanic or Latino
Year householder moved into unit - Moved in 1980 to 1989 (%) - American Indian and Alaska Native
Year householder moved into unit - Moved in 1980 to 1989 (%) - Multirace
Year householder moved into unit - Moved in 1980 to 1989 (%) - Other Race
Year householder moved into unit - Moved in 1970 to 1979 (%)
Year householder moved into unit - Moved in 1970 to 1979 (%) - White
Year householder moved into unit - Moved in 1970 to 1979 (%) - Black or African American
Year householder moved into unit - Moved in 1970 to 1979 (%) - Asian
Year householder moved into unit - Moved in 1970 to 1979 (%) - Hispanic or Latino
Year householder moved into unit - Moved in 1970 to 1979 (%) - American Indian and Alaska Native
Year householder moved into unit - Moved in 1970 to 1979 (%) - Multirace
Year householder moved into unit - Moved in 1970 to 1979 (%) - Other Race
Year householder moved into unit - Moved in 1969 or earlier (%)
Year householder moved into unit - Moved in 1969 or earlier (%) - White
Year householder moved into unit - Moved in 1969 or earlier (%) - Black or African American
Year householder moved into unit - Moved in 1969 or earlier (%) - Asian
Year householder moved into unit - Moved in 1969 or earlier (%) - Hispanic or Latino
Year householder moved into unit - Moved in 1969 or earlier (%) - American Indian and Alaska Native
Year householder moved into unit - Moved in 1969 or earlier (%) - Multirace
Year householder moved into unit - Moved in 1969 or earlier (%) - Other Race
Housing units lacking complete plumbing facilities (%)
Housing units lacking complete kitchen facilities (%)
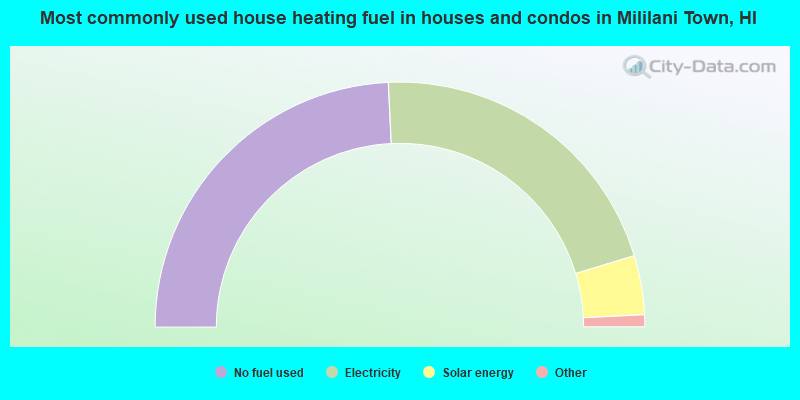
House heating fuel used in houses and condos - Utility gas (%)
House heating fuel used in houses and condos - Bottled, tank, or LP gas (%)
House heating fuel used in houses and condos - Electricity (%)
House heating fuel used in houses and condos - Fuel oil, kerosene, etc. (%)
House heating fuel used in houses and condos - Coal or coke (%)
House heating fuel used in houses and condos - Wood (%)
House heating fuel used in houses and condos - Solar energy (%)
House heating fuel used in houses and condos - Other fuel (%)
House heating fuel used in houses and condos - No fuel used (%)
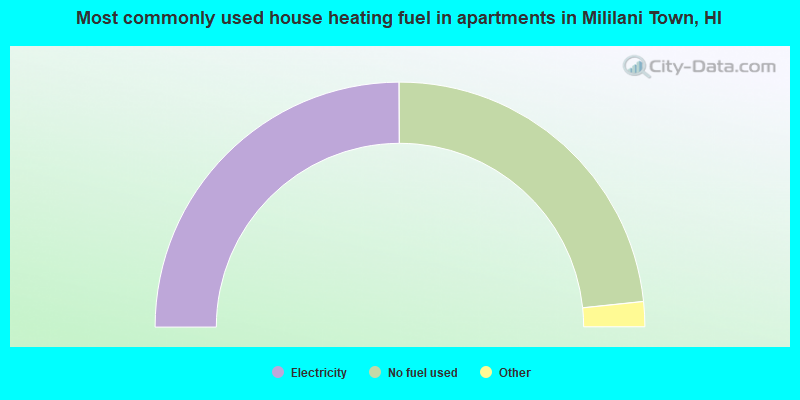
House heating fuel used in apartments - Utility gas (%)
House heating fuel used in apartments - Bottled, tank, or LP gas (%)
House heating fuel used in apartments - Electricity (%)
House heating fuel used in apartments - Fuel oil, kerosene, etc. (%)
House heating fuel used in apartments - Coal or coke (%)
House heating fuel used in apartments - Wood (%)
House heating fuel used in apartments - Solar energy (%)
House heating fuel used in apartments - Other fuel (%)
House heating fuel used in apartments - No fuel used (%)
Median year house/condo built: 1979Median year apartment built: 1978Household type by relationship:
Households: 27,030
Male householders: 5,147 (1,021 living alone ), Female householders: 4,361 (733 living alone )5,645 spouses (5,603 opposite-sex spouses ), 614 unmarried partners , (596 opposite-sex unmarried partners ), 7,579 children (7,156 natural , 192 adopted , 231 stepchildren ), 1,188 grandchildren , 325 brothers or sisters , 747 parents , 22 foster children , 688 other relatives , 708 non-relatives
Size of family households: 2,927 2-persons , 2,188 3-persons , 1,302 4-persons , 474 5-persons , 347 6-persons , 170 7-or-more-persons .
Size of nonfamily households: 1,858 1-person , 393 2-persons , 8 3-persons , 54 4-persons , 13 5-persons .
2,682 married couples with children. single-parent households (263 men , 1,037 women ).
89.1% of residents of Mililani Town speak English at home. of residents speak Spanish at home (81% speak English very well , 15% speak English well , 4% speak English not well ).of residents speak other Indo-European language at home (100% speak English very well ).of residents speak Asian or Pacific Island language at home (66% speak English very well , 24% speak English well , 10% speak English not well ).of residents speak other language at home (98% speak English very well , 2% speak English well ).
Foreign born population: 2,753 (10.2%)of them are naturalized citizens )
Median number of rooms in houses and condos:
Median number of rooms in apartments
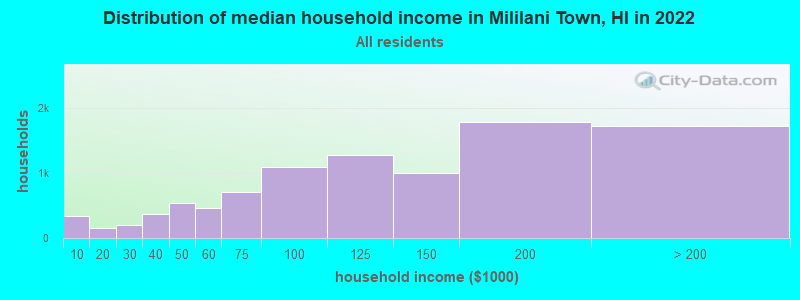
Mililani Town, HI household income distribution 341 Less than $10,000151 $10,000 to $19,999200 $20,000 to $29,999372 $30,000 to $39,999535 $40,000 to $49,999469 $50,000 to $59,999712 $60,000 to $74,9991,091 $75,000 to $99,9991,285 $100,000 to $124,999996 $125,000 to $149,9991,789 $150,000 to $199,9991,734 $200,000 or more
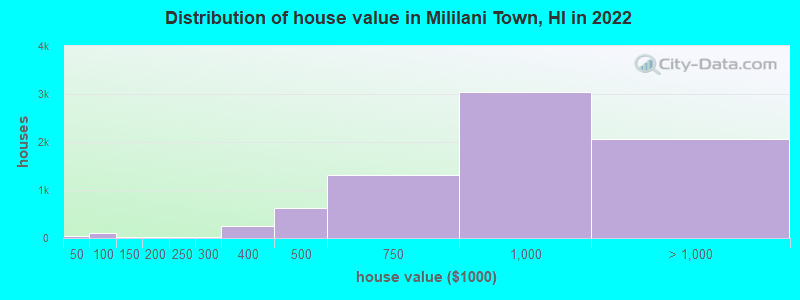
Home value of owner - occupied houses in 2022 in Mililani Town, HI 18 Less than $10,00033 $40,000 to $49,99912 $50,000 to $59,99923 $70,000 to $79,99931 $90,000 to $99,99919 $100,000 to $124,99922 $175,000 to $199,99915 $200,000 to $249,99923 $250,000 to $299,999254 $300,000 to $399,999634 $400,000 to $499,9991,312 $500,000 to $749,9993,047 $750,000 to $999,9991,904 $1,000,000 to $1,499,99985 $1,500,000 to $1,999,99968 $2,000,000 or moreRent paid by renters in 2022 in Mililani Town, HI 17 $500 to $54914 $550 to $59913 $650 to $6995 $750 to $79942 $900 to $999159 $1,000 to $1,249220 $1,250 to $1,499418 $1,500 to $1,999252 $2,000 to $2,499183 $2,500 to $2,999111 $3,000 to $3,49986 $3,500 or more287 No cash rent
Percentage of workers working in this county: 99.1%Number of people working at home: 968 (7.3% of all workers )
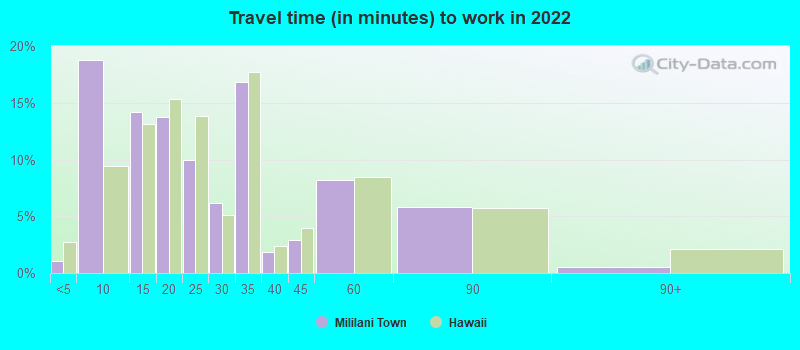
Travel time to work (commute)
Less than 5 minutes: 575 to 9 minutes: 96710 to 14 minutes: 88415 to 19 minutes: 1,05820 to 24 minutes: 1,53525 to 29 minutes: 1,00130 to 34 minutes: 2,96735 to 39 minutes: 49840 to 44 minutes: 56545 to 59 minutes: 1,73560 to 89 minutes: 74290 or more minutes: 205
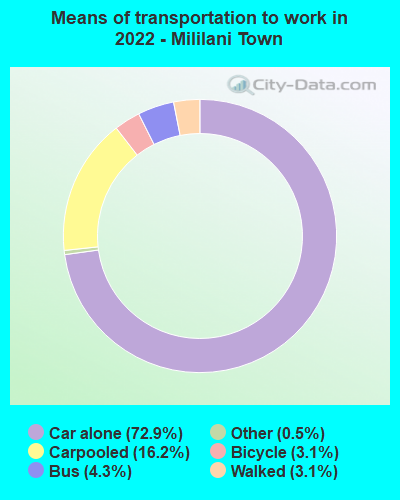
Means of transportation to work:
Drove a car alone: 3,252 (59.7%)Carpooled: 826 (15.2%)Bus : 164 (3.0%)Taxi: 22 (0.4%)Bicycle: 160 (2.9%)Walked: 156 (2.9%)Worked at home: 968 (17.8%)
Unemployment by race in 2022
Unemployment rate for White non-Hispanic residents 1.1% FemalesUnemployment rate for Asian residents 3.5% Males1.3% FemalesUnemployment rate for two or more race residents 2.1% Males5.3% FemalesUnemployment rate for Hispanic or Latino residents 2.8% Males4.1% Females
Year of entry for the foreign-born population in Mililani Town, Hawaii
342 2010 or later 427 2000 to 2009 378 1990 to 1999 642 1980 to 1989 968 1970 to 1979 914 Before 1970
First ancestries reported:
English: 263 (2.0%)
American: 219 (1.7%)
German: 177 (1.3%)
European: 110 (0.8%)
Portuguese: 90 (0.7%)
Italian: 87 (0.7%)
Irish: 81 (0.6%)
Lebanese: 60 (0.5%)
Polish: 40 (0.3%)
Norwegian: 27 (0.2%)
Jamaican: 24 (0.2%)
Australian: 23 (0.2%)
British: 23 (0.2%)
African: 21 (0.2%)
Ghanaian: 17 (0.1%)
Swedish: 10 (0.08%)
Dutch: 9 (0.07%)
French: 9 (0.07%)
French Canadian: 9 (0.07%)
Greek: 7 (0.05%)
Hungarian: 7 (0.05%)
Scotch-Irish: 7 (0.05%)
Scottish: 7 (0.05%)
Welsh: 7 (0.05%)
Northern European: 6 (0.05%)
Scandinavian: 5 (0.04%) Most common places of birth for foreign-born residents (%): Philippines Mililani Town:
44.9% (1,315)Hawaii:
44.3% (115,679)
Japan Mililani Town:
9.6% (281)Hawaii:
8.5% (22,321)
Korea Mililani Town:
8.0% (234)Hawaii:
5.9% (15,525)
China, excluding Hong Kong and Taiwan Mililani Town:
6.0% (175)Hawaii:
7.6% (19,835)
Micronesia Mililani Town:
3.8% (112)Hawaii:
4.0% (10,430)
Mexico Mililani Town:
3.1% (91)Hawaii:
1.8% (4,752)
Taiwan Mililani Town:
2.8% (82)Hawaii:
1.0% (2,701)
Canada Mililani Town:
2.7% (79)Hawaii:
1.8% (4,635)
Germany Mililani Town:
2.1% (61)Hawaii:
1.1% (2,843)
Marshall Islands Mililani Town:
1.8% (52)Hawaii:
2.4% (6,146)
Ghana Mililani Town:
1.6% (46)Hawaii:
0.1% (268)
Place of birth for U.S.-born residents:
This state: 18,784Other state: 4,821Northeast: 587Midwest: 904South: 1,175West: 2,130 93.2% of Mililani Town residents lived in the same house 1 years ago.
Out of people who lived in different houses, 36.7% lived in this county.
Out of people who lived in different counties, 12.9% lived in Hawaii.
Mililani Town:
93.2%State average:
87.8%
Education attainment for males 25 years and older:
No schooling: 53Nursery to 4th grade: 05th and 6th grade: 47th and 8th grade: 289th grade: 1010th grade: 1911th grade: 012th grade, no diploma: 246High school graduate (or equivalency): 2,227Less than 1 year of college: 532Some college more than 1 year, no degree: 1,492Associate degree: 1,552Bachelor's degree: 2,891Master's degree: 936Professional school degree: 408Doctorate degree: 121
Education attainment for females 25 years and older:
No schooling: 79Nursery to 4th grade: 125th and 6th grade: 517th and 8th grade: 429th grade: 2810th grade: 3911th grade: 412th grade, no diploma: 308High school graduate (or equivalency): 2,306Less than 1 year of college: 739Some college more than 1 year, no degree: 1,277Associate degree: 974Bachelor's degree: 2,574Master's degree: 1,206Professional school degree: 260Doctorate degree: 117
Housing units in structures:
One, detached: 6,537One, attached: 1,034Two: 1213 or 4: 8405 to 9: 82910 to 19: 34420 to 49: 9850 or more: 128Boats, RVs, vans, etc.: 11Housing units lacking complete plumbing facilities in 2022: 0.6%Housing units lacking complete kitchen facilities in 2022: 0.4%House/condo owner moved in on average 23 years ago
Renter moved in on average 4 years ago
Private vs. public school enrollment:
Students in private schools in grades 1 to 8 (elementary and middle school): 502 Students in private schools in grades 9 to 12 (high school): 186 Students in private undergraduate colleges: 231