Nampa, ID (Idaho) Houses and Residents
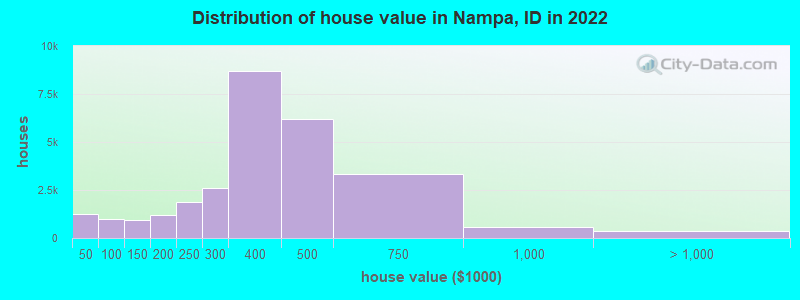
Estimated median house or condo value in 2022: $373,300 (it was $89,900 in 2000 )
Nampa:
$373,300Idaho:
$432,500
Lower value quartile - upper value quartile: $303,700 - $465,100Total population: 88,211 (Urban population: 52,282, Rural population: 134 (all nonfarm) )
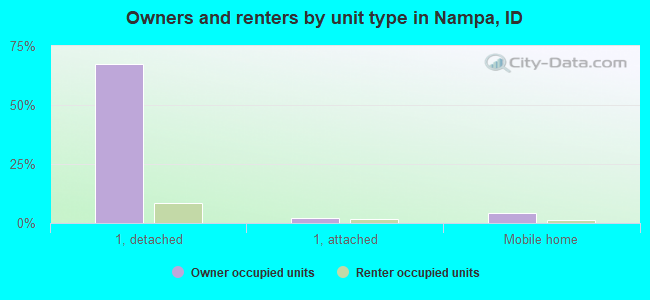
Houses: 40,329 (39,014 occupied: 28,737 owner occupied, 10,277 renter occupied )
% of renters here:
26%State:
28%
Housing density: 2,031 houses/condos per square mile
Median price asked for vacant for-sale houses and condos in 2022: $410,926.
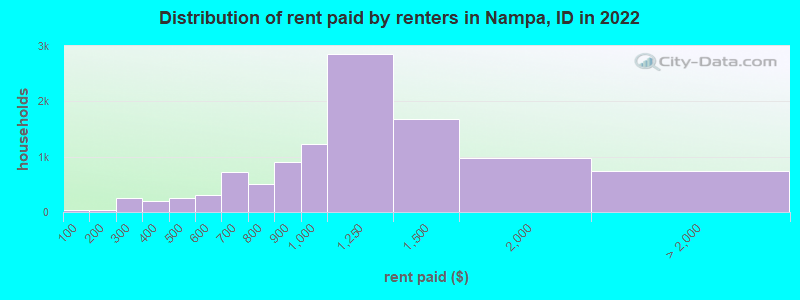
Median contract rent in 2022: $1,198 (lower quartile is $952, upper quartile is $1,465)
Median rent asked for vacant for-rent units in 2022: $2,729
Median gross rent in Nampa, ID in 2022: $1,374
Housing units in Nampa with a mortgage: 21,713 (1,622 second mortgage, 142 home equity loan, 894 both second mortgage and home equity loan )Houses without a mortgage: 232
Median household income for houses/condos with a mortgage: $83,195
Median household income for apartments without a mortgage: $54,444
Median monthly housing costs: $1,236
Data:
Median house or condo value ($)
Median house or condo value ($ change since 2000)
Median house or condo value ($) - White
Median house or condo value ($) - Black or African American
Median house or condo value ($) - Asian
Median house or condo value ($) - Hispanic or Latino
Median house or condo value ($) - American Indian and Alaska Native
Median house or condo value ($) - Multirace
Median house or condo value ($) - Other Race
Median price asked for mobile homes ($)
Household density (households per square mile)
Mean house or condo value by units in structure - 1, detached ($)
Mean house or condo value by units in structure - 1, attached ($)
Mean house or condo value by units in structure - 2 ($)
Mean house or condo value by units in structure by units in structure - 3 or 4 ($)
Mean house or condo value by units in structure - 5 or more ($)
Mean house or condo value by units in structure - Boat, RV, van, etc. ($)
Mean house or condo value by units in structure - Mobile home ($)
Median contract rent ($)
Median contract rent - Lower quartile ($)
Median contract rent - Upper quartile ($)
Median gross rent ($)
Urban houses (%)
Rural houses (%)
Houses occupied (%)
Houses occupied (% change since 2000)
Houses owner occupied (%)
Houses owner occupied (% change since 2000)
Houses renter occupied (%)
Houses renter occupied (% change since 2000)
Vacant housing units - For rent (%)
Vacant housing units - For rent (% change since 2000)
Vacant housing units - For sale only (%)
Vacant housing units - For sale only (% change since 2000)
Vacant housing units - Rented or sold, not occupied (%)
Vacant housing units - Rented or sold, not occupied (% change since 2000)
Vacant housing units - For seasonal, recreational, or occasional use (%)
Vacant housing units - For seasonal, recreational, or occasional use (% change since 2000)
Vacant housing units - For migrant workers (%)
Vacant housing units - For migrant workers (% change since 2000)
Vacant housing units - Other vacant (%)
Vacant housing units - Other vacant (% change since 2000)
Median monthly housing costs ($)
Median household income for houses/condos with a mortgage ($)
Median household income for houses/condos without a mortgage ($)
Median household income ($)
Median household income ($) - White
Median household income ($) - Black or African American
Median household income ($) - Asian
Median household income ($) - Hispanic or Latino
Median household income ($) - American Indian and Alaska Native
Median household income ($) - Multirace
Median household income ($) - Other Race
Mortgage status - with mortgage (%)
Mortgage status - with second mortgage (%)
Mortgage status - with home equity loan (%)
Mortgage status - with both second mortgage and home equity loan (%)
Mortgage status - without a mortgage (%)
Median year house/condo built
Median year apartment built
Household type by relationship - Male householder living alone (%)
Household type by relationship - Male householder not living alone (%)
Household type by relationship - Female householder living alone (%)
Household type by relationship - Female householder not living alone (%)
Household type by relationship - Opposite-Sex spouse (%)
Household type by relationship - Same-Sex spouse (%)
Household type by relationship - Opposite-Sex unmarried partner (%)
Household type by relationship - Same-Sex unmarried partner (%)
Household type by relationship - In group quarters (%)
Size of family households - 2-person household (%)
Size of family households - 3-person household (%)
Size of family households - 4-person household (%)
Size of family households - 5-person household (%)
Size of family households - 6-person household (%)
Size of family households - 7-or-more-person household (%)
Size of nonfamily households - 1-person household (%)
Size of nonfamily households - 2-person household (%)
Size of nonfamily households - 3-person household (%)
Size of nonfamily households - 4-person household (%)
Size of nonfamily households - 5-person household (%)
Size of nonfamily households - 6-person household (%)
Size of nonfamily households - 7-or-moreperson household (%)
Year house built - Built 2010 or later (%)
Year house built - Built 2000 to 2009 (%)
Year house built - Built 1990 to 1999 (%)
Year house built - Built 1980 to 1989 (%)
Year house built - Built 1970 to 1979 (%)
Year house built - Built 1960 to 1969 (%)
Year house built - Built 1950 to 1959 (%)
Year house built - Built 1940 to 1949 (%)
Year house built - Built 1939 or earlier (%)
Median number of rooms in houses and condos
Median number of rooms in apartments
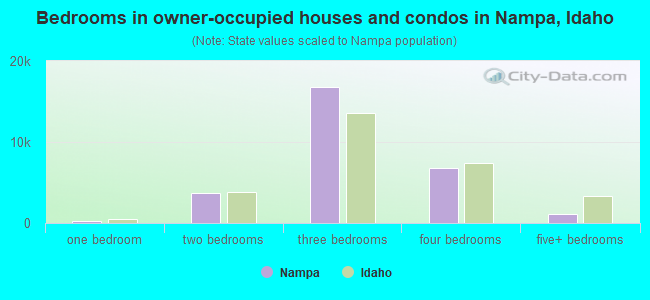
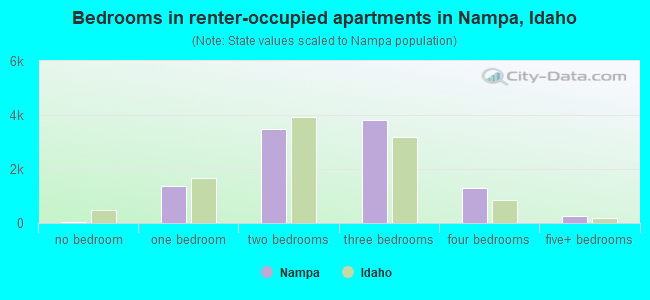
Median number of bedrooms in owner occupied houses
Mean number of bedrooms in owner occupied houses
Median number of bedrooms in renter occupied houses
Mean number of bedrooms in renter occupied houses
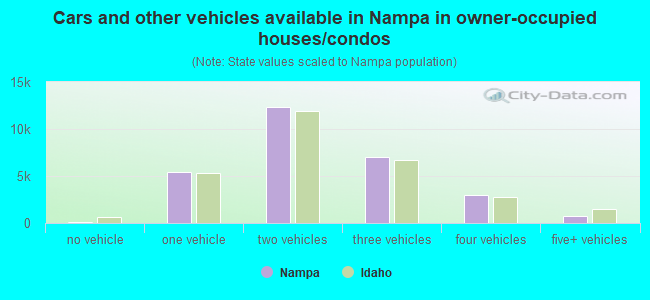
Median number of vehichles in owner occupied houses
Mean number of vehichles in owner occupied houses
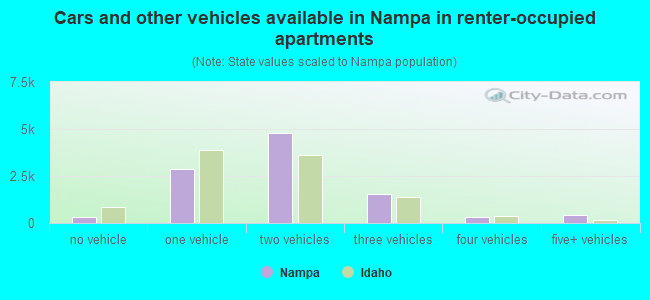
Median number of vehichles in renter occupied houses
Mean number of vehichles in renter occupied houses
Rooms in owner-occupied houses - 1 room (%)
Rooms in owner-occupied houses - 2 rooms (%)
Rooms in owner-occupied houses - 3 rooms (%)
Rooms in owner-occupied houses - 4 rooms (%)
Rooms in owner-occupied houses - 5 rooms (%)
Rooms in owner-occupied houses - 6 rooms (%)
Rooms in owner-occupied houses - 7 rooms (%)
Rooms in owner-occupied houses - 8 rooms (%)
Rooms in owner-occupied houses - 9+ rooms (%)
Rooms in renter-occupied houses - 1 room (%)
Rooms in renter-occupied houses - 2 rooms (%)
Rooms in renter-occupied houses - 3 rooms (%)
Rooms in renter-occupied houses - 4 rooms (%)
Rooms in renter-occupied houses - 5 rooms (%)
Rooms in renter-occupied houses - 6 rooms (%)
Rooms in renter-occupied houses - 7 rooms (%)
Rooms in renter-occupied houses - 8 rooms (%)
Rooms in renter-occupied houses - 9+ rooms (%)
Bedrooms in owner-occupied houses - no bedrooms (%)
Bedrooms in owner-occupied houses - 1 bedroom (%)
Bedrooms in owner-occupied houses - 2 bedrooms (%)
Bedrooms in owner-occupied houses - 3 bedrooms (%)
Bedrooms in owner-occupied houses - 4 bedrooms (%)
Bedrooms in owner-occupied houses - 5+ bedrooms (%)
Bedrooms in renter-occupied houses - no bedrooms (%)
Bedrooms in renter-occupied houses - 1 bedroom (%)
Bedrooms in renter-occupied houses - 2 bedrooms (%)
Bedrooms in renter-occupied houses - 3 bedrooms (%)
Bedrooms in renter-occupied houses - 4 bedrooms (%)
Bedrooms in renter-occupied houses - 5+ bedrooms (%)
Vehicles available in owner-occupied houses - no vehicle available (%)
Vehicles available in owner-occupied houses - 1 vehicle available(%)
Vehicles available in owner-occupied houses - 2 Vehicles available (%)
Vehicles available in owner-occupied houses - 3 Vehicles available (%)
Vehicles available in owner-occupied houses - 4 Vehicles available (%)
Vehicles available in owner-occupied houses - 5+ Vehicles available (%)
Vehicles available in renter-occupied houses - no vehicle available (%)
Vehicles available in renter-occupied houses - 1 vehicle available (%)
Vehicles available in renter-occupied houses - 2 Vehicles available (%)
Vehicles available in renter-occupied houses - 3 Vehicles available (%)
Vehicles available in renter-occupied houses - 4 Vehicles available (%)
Vehicles available in renter-occupied houses - 5+ Vehicles available (%)
Housing units in structures - 1, detached (%)
Housing units in structures - 1, attached (%)
Housing units in structures - 2 (%)
Housing units in structures - 3 or 4 (%)
Housing units in structures - 5 to 9 (%)
Housing units in structures - 10 to 19 (%)
Housing units in structures - 20 to 49 (%)
Housing units in structures - 50 or more (%)
Housing units in structures - Mobile home (%)
Housing units in structures - Boat, RV, van, etc. (%)
Housing units in structures - Owners - 1, detached (%)
Housing units in structures - Owners - 1, attached (%)
Housing units in structures - Owners - 2 (%)
Housing units in structures - Owners - 3 or 4 (%)
Housing units in structures - Owners - 5 to 9 (%)
Housing units in structures - Owners - 10 to 19 (%)
Housing units in structures - Owners - 20 to 49 (%)
Housing units in structures - Owners - 50 or more (%)
Housing units in structures - Owners - Mobile home (%)
Housing units in structures - Owners - Boat, RV, van, etc. (%)
Housing units in structures - Renters - 1, detached (%)
Housing units in structures - Renters - 1, attached (%)
Housing units in structures - Renters - 2 (%)
Housing units in structures - Renters - 3 or 4 (%)
Housing units in structures - Renters - 5 to 9 (%)
Housing units in structures - Renters - 10 to 19 (%)
Housing units in structures - Renters - 20 to 49 (%)
Housing units in structures - Renters - 50 or more (%)
Housing units in structures - Renters - Mobile home (%)
Housing units in structures - Renters - Boat, RV, van, etc. (%)
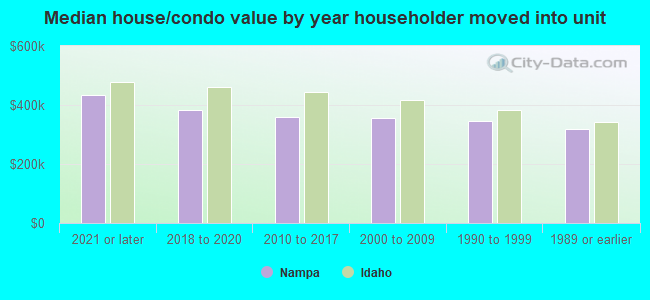
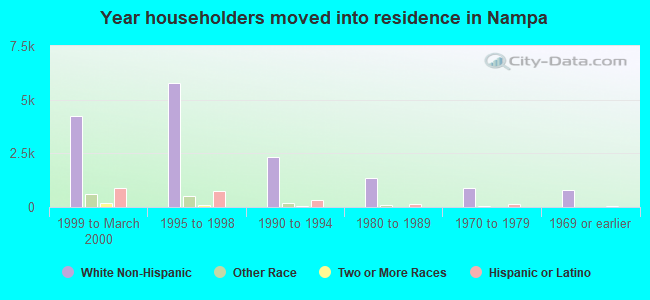
House/condo owner moved in on average (years ago)
Renter moved in on average (years ago)
Year householder moved into unit - Moved in 1999 to March 2000 (%)
Year householder moved into unit - Moved in 1999 to March 2000 (%) - White
Year householder moved into unit - Moved in 1999 to March 2000 (%) - Black or African American
Year householder moved into unit - Moved in 1999 to March 2000 (%) - Asian
Year householder moved into unit - Moved in 1999 to March 2000 (%) - Hispanic or Latino
Year householder moved into unit - Moved in 1999 to March 2000 (%) - American Indian and Alaska Native
Year householder moved into unit - Moved in 1999 to March 2000 (%) - Multirace
Year householder moved into unit - Moved in 1999 to March 2000 (%) - Other Race
Year householder moved into unit - Moved in 1995 to 1998 (%)
Year householder moved into unit - Moved in 1995 to 1998 (%) - White
Year householder moved into unit - Moved in 1995 to 1998 (%) - Black or African American
Year householder moved into unit - Moved in 1995 to 1998 (%) - Asian
Year householder moved into unit - Moved in 1995 to 1998 (%) - Hispanic or Latino
Year householder moved into unit - Moved in 1995 to 1998 (%) - American Indian and Alaska Native
Year householder moved into unit - Moved in 1995 to 1998 (%) - Multirace
Year householder moved into unit - Moved in 1995 to 1998 (%) - Other Race
Year householder moved into unit - Moved in 1990 to 1994 (%)
Year householder moved into unit - Moved in 1990 to 1994 (%) - White
Year householder moved into unit - Moved in 1990 to 1994 (%) - Black or African American
Year householder moved into unit - Moved in 1990 to 1994 (%) - Asian
Year householder moved into unit - Moved in 1990 to 1994 (%) - Hispanic or Latino
Year householder moved into unit - Moved in 1990 to 1994 (%) - American Indian and Alaska Native
Year householder moved into unit - Moved in 1990 to 1994 (%) - Multirace
Year householder moved into unit - Moved in 1990 to 1994 (%) - Other Race
Year householder moved into unit - Moved in 1980 to 1989 (%)
Year householder moved into unit - Moved in 1980 to 1989 (%) - White
Year householder moved into unit - Moved in 1980 to 1989 (%) - Black or African American
Year householder moved into unit - Moved in 1980 to 1989 (%) - Asian
Year householder moved into unit - Moved in 1980 to 1989 (%) - Hispanic or Latino
Year householder moved into unit - Moved in 1980 to 1989 (%) - American Indian and Alaska Native
Year householder moved into unit - Moved in 1980 to 1989 (%) - Multirace
Year householder moved into unit - Moved in 1980 to 1989 (%) - Other Race
Year householder moved into unit - Moved in 1970 to 1979 (%)
Year householder moved into unit - Moved in 1970 to 1979 (%) - White
Year householder moved into unit - Moved in 1970 to 1979 (%) - Black or African American
Year householder moved into unit - Moved in 1970 to 1979 (%) - Asian
Year householder moved into unit - Moved in 1970 to 1979 (%) - Hispanic or Latino
Year householder moved into unit - Moved in 1970 to 1979 (%) - American Indian and Alaska Native
Year householder moved into unit - Moved in 1970 to 1979 (%) - Multirace
Year householder moved into unit - Moved in 1970 to 1979 (%) - Other Race
Year householder moved into unit - Moved in 1969 or earlier (%)
Year householder moved into unit - Moved in 1969 or earlier (%) - White
Year householder moved into unit - Moved in 1969 or earlier (%) - Black or African American
Year householder moved into unit - Moved in 1969 or earlier (%) - Asian
Year householder moved into unit - Moved in 1969 or earlier (%) - Hispanic or Latino
Year householder moved into unit - Moved in 1969 or earlier (%) - American Indian and Alaska Native
Year householder moved into unit - Moved in 1969 or earlier (%) - Multirace
Year householder moved into unit - Moved in 1969 or earlier (%) - Other Race
Housing units lacking complete plumbing facilities (%)
Housing units lacking complete kitchen facilities (%)
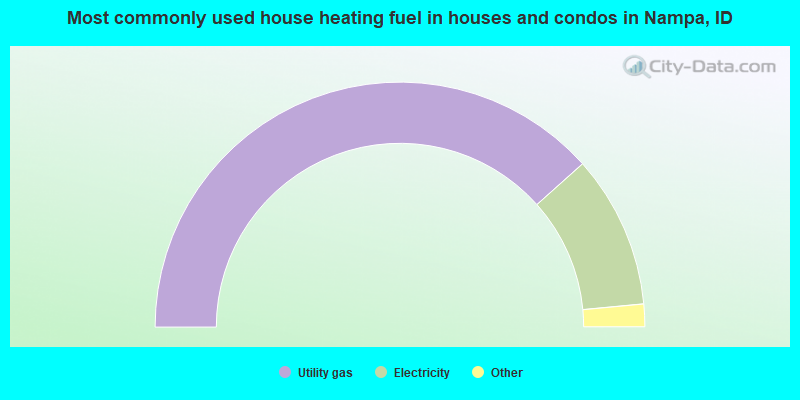
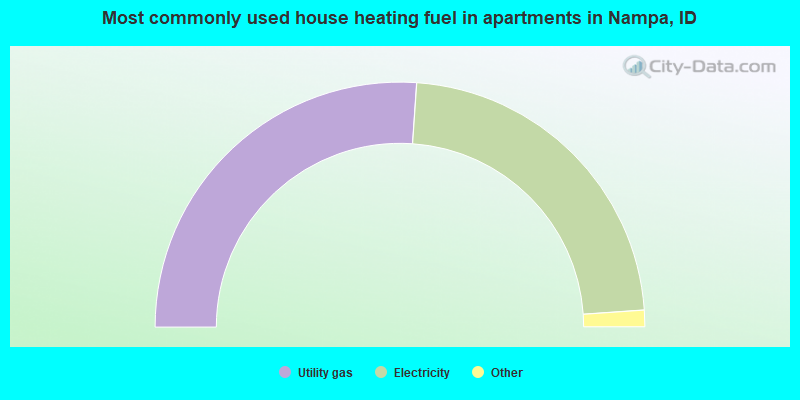
House heating fuel used in houses and condos - Utility gas (%)
House heating fuel used in houses and condos - Bottled, tank, or LP gas (%)
House heating fuel used in houses and condos - Electricity (%)
House heating fuel used in houses and condos - Fuel oil, kerosene, etc. (%)
House heating fuel used in houses and condos - Coal or coke (%)
House heating fuel used in houses and condos - Wood (%)
House heating fuel used in houses and condos - Solar energy (%)
House heating fuel used in houses and condos - Other fuel (%)
House heating fuel used in houses and condos - No fuel used (%)
House heating fuel used in apartments - Utility gas (%)
House heating fuel used in apartments - Bottled, tank, or LP gas (%)
House heating fuel used in apartments - Electricity (%)
House heating fuel used in apartments - Fuel oil, kerosene, etc. (%)
House heating fuel used in apartments - Coal or coke (%)
House heating fuel used in apartments - Wood (%)
House heating fuel used in apartments - Solar energy (%)
House heating fuel used in apartments - Other fuel (%)
House heating fuel used in apartments - No fuel used (%)
Latest news about housing in Nampa, ID collected exclusively by city-data.com from local newspapers, TV, and radio stations
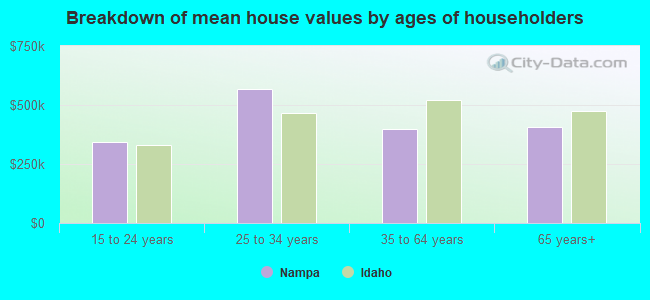
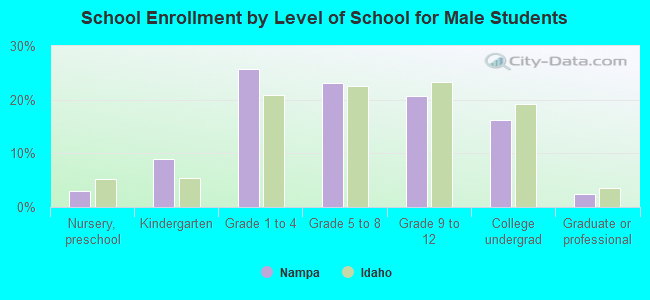
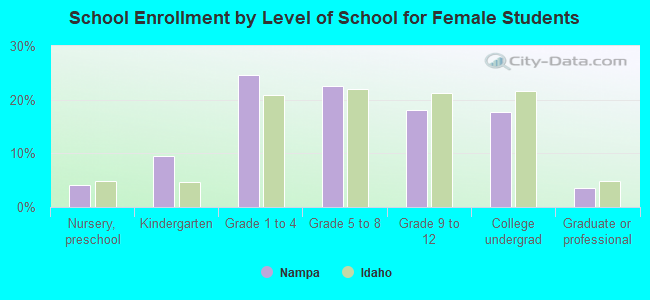
Median year house/condo built: 2001Median year apartment built: 2002Household type by relationship:
Households: 110,932
Male householders: 18,713 (3,818 living alone ), Female householders: 20,301 (3,872 living alone )21,522 spouses (21,522 opposite-sex spouses ), 3,867 unmarried partners , (3,631 opposite-sex unmarried partners ), 34,986 children (31,891 natural , 747 adopted , 2,348 stepchildren ), 1,462 grandchildren , 1,165 brothers or sisters , 785 parents , 79 foster children , 760 other relatives , 5,205 non-relatives In group quarters: 2,087
Size of family households: 10,829 2-persons , 6,735 3-persons , 6,203 4-persons , 2,369 5-persons , 1,415 6-persons , 701 7-or-more-persons .
Size of nonfamily households: 7,690 1-person , 2,310 2-persons , 449 3-persons , 313 4-persons .
19,380 married couples with children. single-parent households (2,485 men , 3,937 women ).
81.8% of residents of Nampa speak English at home. of residents speak Spanish at home (66% speak English very well , 16% speak English well , 13% speak English not well , 4% don't speak English at all ).of residents speak other Indo-European language at home (52% speak English very well , 23% speak English well , 25% speak English not well ).of residents speak Asian or Pacific Island language at home (51% speak English very well , 25% speak English well , 8% speak English not well , 16% don't speak English at all ).of residents speak other language at home (21% speak English very well , 62% speak English well , 17% speak English not well ).
Foreign born population: 7,296 (6.6%)of them are naturalized citizens )
Median number of rooms in houses and condos:
Median number of rooms in apartments
Owner-occupied Renter-occupied
Bedrooms in owner-occupied houses and condos in Nampa, Idaho
61 no bedroom 237 1 bedroom 3,728 2 bedrooms 16,806 3 bedrooms 6,823 4 bedrooms 1,082 5+ bedrooms
Bedrooms in renter-occupied apartments in Nampa, Idaho
52 no bedroom 1,356 1 bedroom 3,479 2 bedrooms 3,822 3 bedrooms 1,309 4 bedrooms 259 5+ bedrooms
Owner-occupied Renter-occupied
Rooms in owner-occupied houses in Nampa, Idaho
61 1 room 47 2 rooms 498 3 rooms 4,121 4 rooms 6,827 5 rooms 6,694 6 rooms 4,784 7 rooms 2,811 8 rooms 2,894 9+ rooms
Rooms in renter-occupied apartments in Nampa, Idaho
52 1 room 575 2 rooms 1,328 3 rooms 2,587 4 rooms 2,202 5 rooms 2,130 6 rooms 684 7 rooms 606 8 rooms 113 9+ rooms
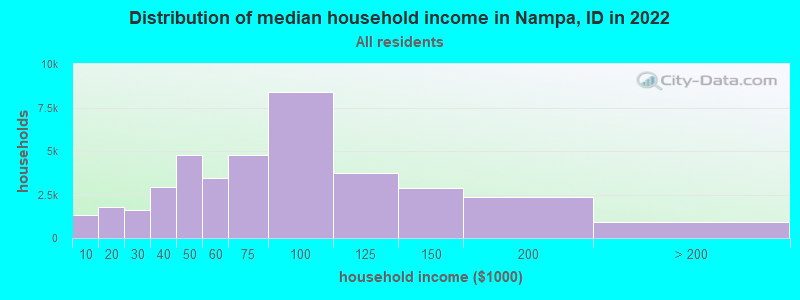
Nampa, ID household income distribution 1,314 Less than $10,0001,787 $10,000 to $19,9991,632 $20,000 to $29,9992,917 $30,000 to $39,9994,792 $40,000 to $49,9993,456 $50,000 to $59,9994,778 $60,000 to $74,9998,418 $75,000 to $99,9993,756 $100,000 to $124,9992,867 $125,000 to $149,9992,377 $150,000 to $199,999920 $200,000 or more
Home value of owner - occupied houses in 2022 in Nampa, ID 250 Less than $10,000293 $10,000 to $14,999110 $15,000 to $19,99997 $20,000 to $24,99953 $25,000 to $29,999110 $30,000 to $34,99949 $35,000 to $39,999307 $40,000 to $49,999167 $50,000 to $59,99919 $60,000 to $69,999123 $70,000 to $79,999167 $80,000 to $89,999216 $90,000 to $99,999446 $100,000 to $124,999497 $125,000 to $149,999538 $150,000 to $174,999649 $175,000 to $199,9991,858 $200,000 to $249,9992,608 $250,000 to $299,9998,702 $300,000 to $399,9996,199 $400,000 to $499,9993,333 $500,000 to $749,999567 $750,000 to $999,99992 $1,000,000 to $1,499,999252 $2,000,000 or moreRent paid by renters in 2022 in Nampa, ID 32 Less than $10040 $150 to $199116 $200 to $249144 $250 to $29994 $300 to $349103 $350 to $399207 $400 to $44943 $450 to $499173 $500 to $549141 $550 to $599301 $600 to $649413 $650 to $699189 $700 to $749311 $750 to $799896 $800 to $8991,233 $900 to $9992,856 $1,000 to $1,2491,684 $1,250 to $1,499983 $1,500 to $1,999309 $2,000 to $2,49937 $2,500 to $2,99940 $3,000 to $3,499345 No cash rent
Percentage of workers working in this county: 59.0%Number of people working at home: 6,262 (11.4% of all workers )
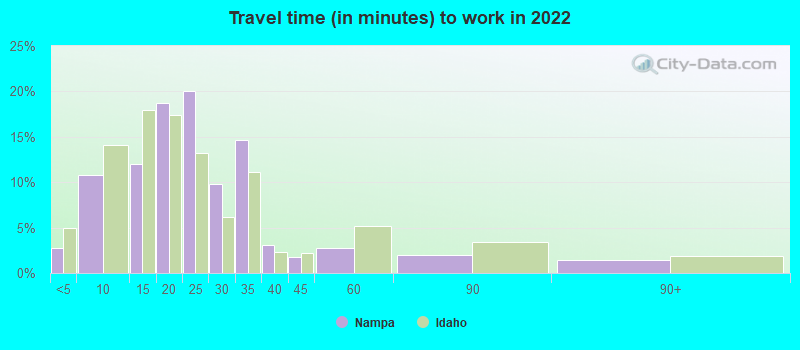
Travel time to work (commute)
Less than 5 minutes: 8355 to 9 minutes: 5,49810 to 14 minutes: 5,44415 to 19 minutes: 8,48120 to 24 minutes: 7,44325 to 29 minutes: 5,08230 to 34 minutes: 9,12235 to 39 minutes: 2,17440 to 44 minutes: 1,59145 to 59 minutes: 3,22960 to 89 minutes: 1,28290 or more minutes: 336
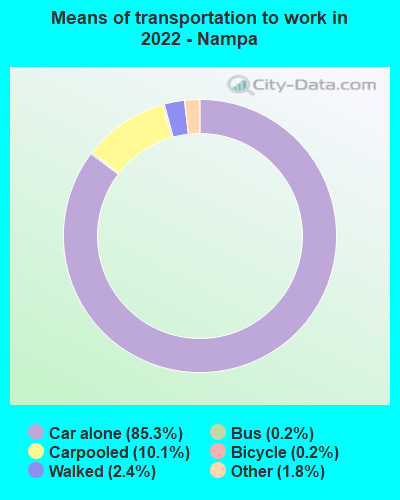
Means of transportation to work:
Drove a car alone: 35,930 (72.3%)Carpooled: 4,695 (9.4%)Bus : 87 (0.2%)Taxi: 850 (1.7%)Bicycle: 49 (0.1%)Walked: 1,412 (2.8%)Worked at home: 6,262 (12.6%)
Unemployment by race in 2022
Unemployment rate for White non-Hispanic residents 2.3% Males1.3% FemalesUnemployment rate for Black residents 8.7% FemalesUnemployment rate for American Indian and Alaska Native residents 0.8% MalesUnemployment rate for Asian residents 25.8% MalesUnemployment rate for other race residents 7.4% Males1.5% FemalesUnemployment rate for two or more race residents 2.3% Males0.3% FemalesUnemployment rate for Hispanic or Latino residents 3.9% Males2.3% Females
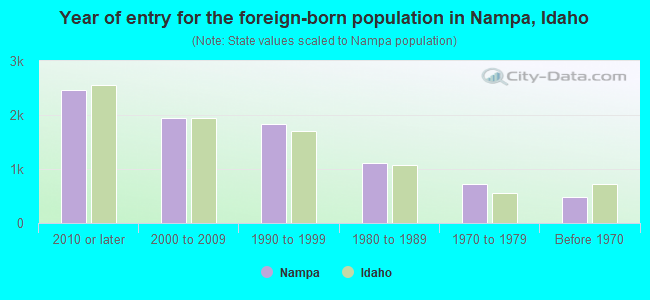
Year of entry for the foreign-born population in Nampa, Idaho
2,464 2010 or later 1,952 2000 to 2009 1,830 1990 to 1999 1,117 1980 to 1989 725 1970 to 1979 477 Before 1970
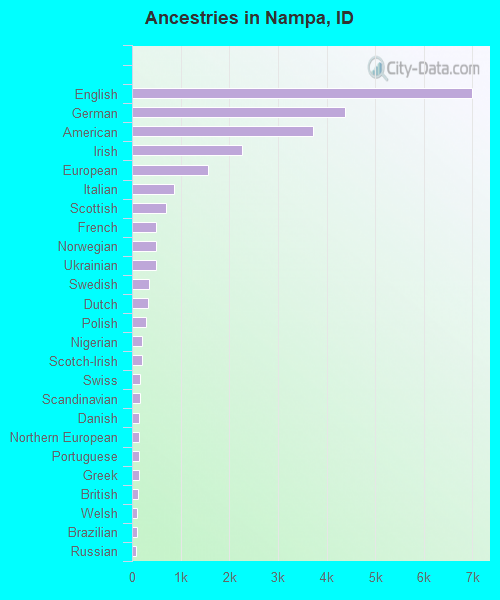
First ancestries reported:
English: 6,991 (14.7%)
German: 4,383 (9.2%)
American: 3,723 (7.8%)
Irish: 2,263 (4.8%)
European: 1,556 (3.3%)
Italian: 855 (1.8%)
Scottish: 709 (1.5%)
French: 490 (1.0%)
Norwegian: 489 (1.0%)
Ukrainian: 488 (1.0%)
Swedish: 345 (0.7%)
Dutch: 322 (0.7%)
Polish: 295 (0.6%)
Nigerian: 213 (0.4%)
Scotch-Irish: 211 (0.4%)
Swiss: 169 (0.4%)
Scandinavian: 160 (0.3%)
Danish: 152 (0.3%)
Northern European: 149 (0.3%)
Portuguese: 148 (0.3%)
Greek: 138 (0.3%)
British: 131 (0.3%)
Welsh: 98 (0.2%)
Brazilian: 94 (0.2%)
Russian: 91 (0.2%)
Arab: 88 (0.2%)
Canadian: 84 (0.2%)
French Canadian: 72 (0.2%)
Hungarian: 67 (0.1%)
Finnish: 40 (0.08%)
Basque: 33 (0.07%)
Yugoslavian: 30 (0.06%)
Czechoslovakian: 29 (0.06%)
Austrian: 27 (0.06%)
Slovak: 22 (0.05%)
African: 20 (0.04%)
Iranian: 19 (0.04%)
Czech: 19 (0.04%)
Eastern European: 17 (0.04%)
West Indian: 16 (0.03%)
Croatian: 14 (0.03%)
Armenian: 10 (0.02%)
Belgian: 7 (0.01%)
Moroccan: 7 (0.01%)
Pennsylvania German: 5 (0.01%)
Serbian: 4 (0.01%)
Most common places of birth for foreign-born residents (%): Mexico Nampa:
61.5% (5,011)Idaho:
49.9% (53,107)
Ukraine Nampa:
4.6% (375)Idaho:
1.2% (1,274)
Colombia Nampa:
2.7% (223)Idaho:
1.2% (1,289)
Germany Nampa:
2.6% (211)Idaho:
2.4% (2,535)
Iraq Nampa:
2.5% (203)Idaho:
1.5% (1,626)
Vietnam Nampa:
2.1% (168)Idaho:
1.2% (1,257)
Guatemala Nampa:
1.5% (126)Idaho:
1.9% (2,023)
Place of birth for U.S.-born residents:
This state: 49,752Other state: 52,664Northeast: 2,793Midwest: 6,985South: 6,672West: 36,214 83.8% of Nampa residents lived in the same house 1 years ago.
Out of people who lived in different houses, 31.7% lived in this county.
Out of people who lived in different counties, 52.6% lived in Idaho.
Nampa:
83.8%State average:
85.1%
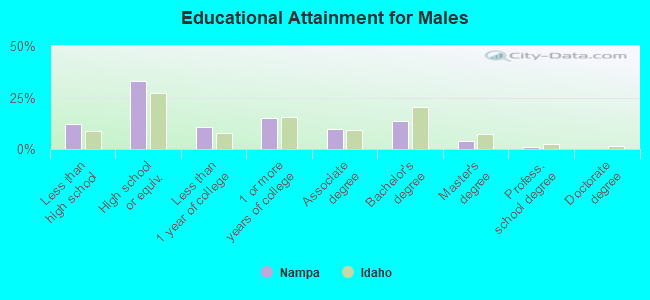
Education attainment for males 25 years and older:
No schooling: 703Nursery to 4th grade: 1205th and 6th grade: 8057th and 8th grade: 1859th grade: 13810th grade: 10711th grade: 34412th grade, no diploma: 1,937High school graduate (or equivalency): 11,704Less than 1 year of college: 3,837Some college more than 1 year, no degree: 5,362Associate degree: 3,448Bachelor's degree: 4,872Master's degree: 1,420Professional school degree: 357Doctorate degree: 81
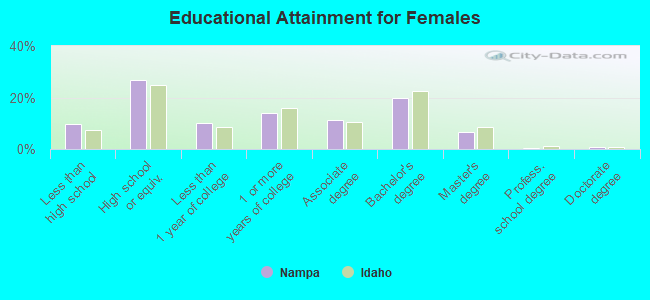
Education attainment for females 25 years and older:
No schooling: 169Nursery to 4th grade: 615th and 6th grade: 1,0577th and 8th grade: 4739th grade: 17910th grade: 12311th grade: 68112th grade, no diploma: 685High school graduate (or equivalency): 9,442Less than 1 year of college: 3,576Some college more than 1 year, no degree: 4,922Associate degree: 3,979Bachelor's degree: 6,929Master's degree: 2,330Professional school degree: 162Doctorate degree: 229
Housing units in structures:
One, detached: 30,226One, attached: 1,552Two: 9693 or 4: 3,1965 to 9: 94710 to 19: 72320 to 49: 14050 or more: 422Mobile homes: 2,154Median worth of mobile homes: $44,200
Housing units lacking complete plumbing facilities in 2022: 0.4%Housing units lacking complete kitchen facilities in 2022: 0.5%House/condo owner moved in on average 7 years ago
Renter moved in on average 2 years ago
Private vs. public school enrollment:
Students in private schools in grades 1 to 8 (elementary and middle school): 1,026 Students in private schools in grades 9 to 12 (high school): 488 Students in private undergraduate colleges: 897