Norman, OK (Oklahoma) Houses and Residents
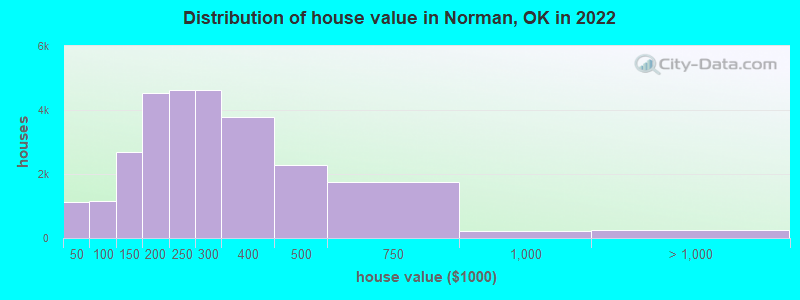
Estimated median house or condo value in 2022: $244,700 (it was $93,700 in 2000 )
Norman:
$244,700Oklahoma:
$191,700
Lower value quartile - upper value quartile: $170,000 - $342,200Mean price in 2022: Detached houses: $314,923 Here:
$314,923State:
$255,409
Townhouses or other attached units: $460,671 Here:
$460,671State:
$206,466
In 2-unit structures: $197,625 Here:
$197,625State:
$195,100
In 3-to-4-unit structures: $119,993 Here:
$119,993State:
$140,612
In 5-or-more-unit structures: $199,017 Here:
$199,017State:
$233,805
Mobile homes: $118,009 Here:
$118,009State:
$110,804
Total population: 118,040 (Urban population: 81,443, Rural population: 14,250 (484 farm, 13,766 nonfarm ))
Houses: 56,702 (52,844 occupied: 26,832 owner occupied, 26,012 renter occupied )
% of renters here:
49%State:
35%
Housing density: 320 houses/condos per square mile
Median price asked for vacant for-sale houses and condos in 2022: $196,975.
Median contract rent in 2022: $806 (lower quartile is $666, upper quartile is $1,128)
Median rent asked for vacant for-rent units in 2022: $1,245
Median gross rent in Norman, OK in 2022: $1,020
Housing units in Norman with a mortgage: 16,159 (614 second mortgage, 0 home equity loan, 393 both second mortgage and home equity loan )Houses without a mortgage: 292
Median household income for houses/condos with a mortgage: $111,697
Median household income for apartments without a mortgage: $70,781
Median monthly housing costs: $1,066
Data:
Median house or condo value ($)
Median house or condo value ($ change since 2000)
Median house or condo value ($) - White
Median house or condo value ($) - Black or African American
Median house or condo value ($) - Asian
Median house or condo value ($) - Hispanic or Latino
Median house or condo value ($) - American Indian and Alaska Native
Median house or condo value ($) - Multirace
Median house or condo value ($) - Other Race
Median price asked for mobile homes ($)
Household density (households per square mile)
Mean house or condo value by units in structure - 1, detached ($)
Mean house or condo value by units in structure - 1, attached ($)
Mean house or condo value by units in structure - 2 ($)
Mean house or condo value by units in structure by units in structure - 3 or 4 ($)
Mean house or condo value by units in structure - 5 or more ($)
Mean house or condo value by units in structure - Boat, RV, van, etc. ($)
Mean house or condo value by units in structure - Mobile home ($)
Median contract rent ($)
Median contract rent - Lower quartile ($)
Median contract rent - Upper quartile ($)
Median gross rent ($)
Urban houses (%)
Rural houses (%)
Houses occupied (%)
Houses occupied (% change since 2000)
Houses owner occupied (%)
Houses owner occupied (% change since 2000)
Houses renter occupied (%)
Houses renter occupied (% change since 2000)
Vacant housing units - For rent (%)
Vacant housing units - For rent (% change since 2000)
Vacant housing units - For sale only (%)
Vacant housing units - For sale only (% change since 2000)
Vacant housing units - Rented or sold, not occupied (%)
Vacant housing units - Rented or sold, not occupied (% change since 2000)
Vacant housing units - For seasonal, recreational, or occasional use (%)
Vacant housing units - For seasonal, recreational, or occasional use (% change since 2000)
Vacant housing units - For migrant workers (%)
Vacant housing units - For migrant workers (% change since 2000)
Vacant housing units - Other vacant (%)
Vacant housing units - Other vacant (% change since 2000)
Median monthly housing costs ($)
Median household income for houses/condos with a mortgage ($)
Median household income for houses/condos without a mortgage ($)
Median household income ($)
Median household income ($) - White
Median household income ($) - Black or African American
Median household income ($) - Asian
Median household income ($) - Hispanic or Latino
Median household income ($) - American Indian and Alaska Native
Median household income ($) - Multirace
Median household income ($) - Other Race
Mortgage status - with mortgage (%)
Mortgage status - with second mortgage (%)
Mortgage status - with home equity loan (%)
Mortgage status - with both second mortgage and home equity loan (%)
Mortgage status - without a mortgage (%)
Median year house/condo built
Median year apartment built
Household type by relationship - Male householder living alone (%)
Household type by relationship - Male householder not living alone (%)
Household type by relationship - Female householder living alone (%)
Household type by relationship - Female householder not living alone (%)
Household type by relationship - Opposite-Sex spouse (%)
Household type by relationship - Same-Sex spouse (%)
Household type by relationship - Opposite-Sex unmarried partner (%)
Household type by relationship - Same-Sex unmarried partner (%)
Household type by relationship - In group quarters (%)
Size of family households - 2-person household (%)
Size of family households - 3-person household (%)
Size of family households - 4-person household (%)
Size of family households - 5-person household (%)
Size of family households - 6-person household (%)
Size of family households - 7-or-more-person household (%)
Size of nonfamily households - 1-person household (%)
Size of nonfamily households - 2-person household (%)
Size of nonfamily households - 3-person household (%)
Size of nonfamily households - 4-person household (%)
Size of nonfamily households - 5-person household (%)
Size of nonfamily households - 6-person household (%)
Size of nonfamily households - 7-or-moreperson household (%)
Year house built - Built 2010 or later (%)
Year house built - Built 2000 to 2009 (%)
Year house built - Built 1990 to 1999 (%)
Year house built - Built 1980 to 1989 (%)
Year house built - Built 1970 to 1979 (%)
Year house built - Built 1960 to 1969 (%)
Year house built - Built 1950 to 1959 (%)
Year house built - Built 1940 to 1949 (%)
Year house built - Built 1939 or earlier (%)
Median number of rooms in houses and condos
Median number of rooms in apartments
Median number of bedrooms in owner occupied houses
Mean number of bedrooms in owner occupied houses
Median number of bedrooms in renter occupied houses
Mean number of bedrooms in renter occupied houses
Median number of vehichles in owner occupied houses
Mean number of vehichles in owner occupied houses
Median number of vehichles in renter occupied houses
Mean number of vehichles in renter occupied houses
Rooms in owner-occupied houses - 1 room (%)
Rooms in owner-occupied houses - 2 rooms (%)
Rooms in owner-occupied houses - 3 rooms (%)
Rooms in owner-occupied houses - 4 rooms (%)
Rooms in owner-occupied houses - 5 rooms (%)
Rooms in owner-occupied houses - 6 rooms (%)
Rooms in owner-occupied houses - 7 rooms (%)
Rooms in owner-occupied houses - 8 rooms (%)
Rooms in owner-occupied houses - 9+ rooms (%)
Rooms in renter-occupied houses - 1 room (%)
Rooms in renter-occupied houses - 2 rooms (%)
Rooms in renter-occupied houses - 3 rooms (%)
Rooms in renter-occupied houses - 4 rooms (%)
Rooms in renter-occupied houses - 5 rooms (%)
Rooms in renter-occupied houses - 6 rooms (%)
Rooms in renter-occupied houses - 7 rooms (%)
Rooms in renter-occupied houses - 8 rooms (%)
Rooms in renter-occupied houses - 9+ rooms (%)
Bedrooms in owner-occupied houses - no bedrooms (%)
Bedrooms in owner-occupied houses - 1 bedroom (%)
Bedrooms in owner-occupied houses - 2 bedrooms (%)
Bedrooms in owner-occupied houses - 3 bedrooms (%)
Bedrooms in owner-occupied houses - 4 bedrooms (%)
Bedrooms in owner-occupied houses - 5+ bedrooms (%)
Bedrooms in renter-occupied houses - no bedrooms (%)
Bedrooms in renter-occupied houses - 1 bedroom (%)
Bedrooms in renter-occupied houses - 2 bedrooms (%)
Bedrooms in renter-occupied houses - 3 bedrooms (%)
Bedrooms in renter-occupied houses - 4 bedrooms (%)
Bedrooms in renter-occupied houses - 5+ bedrooms (%)
Vehicles available in owner-occupied houses - no vehicle available (%)
Vehicles available in owner-occupied houses - 1 vehicle available(%)
Vehicles available in owner-occupied houses - 2 Vehicles available (%)
Vehicles available in owner-occupied houses - 3 Vehicles available (%)
Vehicles available in owner-occupied houses - 4 Vehicles available (%)
Vehicles available in owner-occupied houses - 5+ Vehicles available (%)
Vehicles available in renter-occupied houses - no vehicle available (%)
Vehicles available in renter-occupied houses - 1 vehicle available (%)
Vehicles available in renter-occupied houses - 2 Vehicles available (%)
Vehicles available in renter-occupied houses - 3 Vehicles available (%)
Vehicles available in renter-occupied houses - 4 Vehicles available (%)
Vehicles available in renter-occupied houses - 5+ Vehicles available (%)
Housing units in structures - 1, detached (%)
Housing units in structures - 1, attached (%)
Housing units in structures - 2 (%)
Housing units in structures - 3 or 4 (%)
Housing units in structures - 5 to 9 (%)
Housing units in structures - 10 to 19 (%)
Housing units in structures - 20 to 49 (%)
Housing units in structures - 50 or more (%)
Housing units in structures - Mobile home (%)
Housing units in structures - Boat, RV, van, etc. (%)
Housing units in structures - Owners - 1, detached (%)
Housing units in structures - Owners - 1, attached (%)
Housing units in structures - Owners - 2 (%)
Housing units in structures - Owners - 3 or 4 (%)
Housing units in structures - Owners - 5 to 9 (%)
Housing units in structures - Owners - 10 to 19 (%)
Housing units in structures - Owners - 20 to 49 (%)
Housing units in structures - Owners - 50 or more (%)
Housing units in structures - Owners - Mobile home (%)
Housing units in structures - Owners - Boat, RV, van, etc. (%)
Housing units in structures - Renters - 1, detached (%)
Housing units in structures - Renters - 1, attached (%)
Housing units in structures - Renters - 2 (%)
Housing units in structures - Renters - 3 or 4 (%)
Housing units in structures - Renters - 5 to 9 (%)
Housing units in structures - Renters - 10 to 19 (%)
Housing units in structures - Renters - 20 to 49 (%)
Housing units in structures - Renters - 50 or more (%)
Housing units in structures - Renters - Mobile home (%)
Housing units in structures - Renters - Boat, RV, van, etc. (%)
House/condo owner moved in on average (years ago)
Renter moved in on average (years ago)
Year householder moved into unit - Moved in 1999 to March 2000 (%)
Year householder moved into unit - Moved in 1999 to March 2000 (%) - White
Year householder moved into unit - Moved in 1999 to March 2000 (%) - Black or African American
Year householder moved into unit - Moved in 1999 to March 2000 (%) - Asian
Year householder moved into unit - Moved in 1999 to March 2000 (%) - Hispanic or Latino
Year householder moved into unit - Moved in 1999 to March 2000 (%) - American Indian and Alaska Native
Year householder moved into unit - Moved in 1999 to March 2000 (%) - Multirace
Year householder moved into unit - Moved in 1999 to March 2000 (%) - Other Race
Year householder moved into unit - Moved in 1995 to 1998 (%)
Year householder moved into unit - Moved in 1995 to 1998 (%) - White
Year householder moved into unit - Moved in 1995 to 1998 (%) - Black or African American
Year householder moved into unit - Moved in 1995 to 1998 (%) - Asian
Year householder moved into unit - Moved in 1995 to 1998 (%) - Hispanic or Latino
Year householder moved into unit - Moved in 1995 to 1998 (%) - American Indian and Alaska Native
Year householder moved into unit - Moved in 1995 to 1998 (%) - Multirace
Year householder moved into unit - Moved in 1995 to 1998 (%) - Other Race
Year householder moved into unit - Moved in 1990 to 1994 (%)
Year householder moved into unit - Moved in 1990 to 1994 (%) - White
Year householder moved into unit - Moved in 1990 to 1994 (%) - Black or African American
Year householder moved into unit - Moved in 1990 to 1994 (%) - Asian
Year householder moved into unit - Moved in 1990 to 1994 (%) - Hispanic or Latino
Year householder moved into unit - Moved in 1990 to 1994 (%) - American Indian and Alaska Native
Year householder moved into unit - Moved in 1990 to 1994 (%) - Multirace
Year householder moved into unit - Moved in 1990 to 1994 (%) - Other Race
Year householder moved into unit - Moved in 1980 to 1989 (%)
Year householder moved into unit - Moved in 1980 to 1989 (%) - White
Year householder moved into unit - Moved in 1980 to 1989 (%) - Black or African American
Year householder moved into unit - Moved in 1980 to 1989 (%) - Asian
Year householder moved into unit - Moved in 1980 to 1989 (%) - Hispanic or Latino
Year householder moved into unit - Moved in 1980 to 1989 (%) - American Indian and Alaska Native
Year householder moved into unit - Moved in 1980 to 1989 (%) - Multirace
Year householder moved into unit - Moved in 1980 to 1989 (%) - Other Race
Year householder moved into unit - Moved in 1970 to 1979 (%)
Year householder moved into unit - Moved in 1970 to 1979 (%) - White
Year householder moved into unit - Moved in 1970 to 1979 (%) - Black or African American
Year householder moved into unit - Moved in 1970 to 1979 (%) - Asian
Year householder moved into unit - Moved in 1970 to 1979 (%) - Hispanic or Latino
Year householder moved into unit - Moved in 1970 to 1979 (%) - American Indian and Alaska Native
Year householder moved into unit - Moved in 1970 to 1979 (%) - Multirace
Year householder moved into unit - Moved in 1970 to 1979 (%) - Other Race
Year householder moved into unit - Moved in 1969 or earlier (%)
Year householder moved into unit - Moved in 1969 or earlier (%) - White
Year householder moved into unit - Moved in 1969 or earlier (%) - Black or African American
Year householder moved into unit - Moved in 1969 or earlier (%) - Asian
Year householder moved into unit - Moved in 1969 or earlier (%) - Hispanic or Latino
Year householder moved into unit - Moved in 1969 or earlier (%) - American Indian and Alaska Native
Year householder moved into unit - Moved in 1969 or earlier (%) - Multirace
Year householder moved into unit - Moved in 1969 or earlier (%) - Other Race
Housing units lacking complete plumbing facilities (%)
Housing units lacking complete kitchen facilities (%)
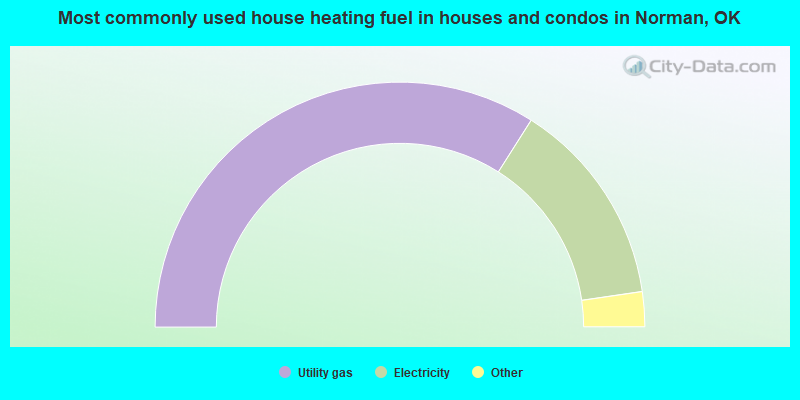
House heating fuel used in houses and condos - Utility gas (%)
House heating fuel used in houses and condos - Bottled, tank, or LP gas (%)
House heating fuel used in houses and condos - Electricity (%)
House heating fuel used in houses and condos - Fuel oil, kerosene, etc. (%)
House heating fuel used in houses and condos - Coal or coke (%)
House heating fuel used in houses and condos - Wood (%)
House heating fuel used in houses and condos - Solar energy (%)
House heating fuel used in houses and condos - Other fuel (%)
House heating fuel used in houses and condos - No fuel used (%)
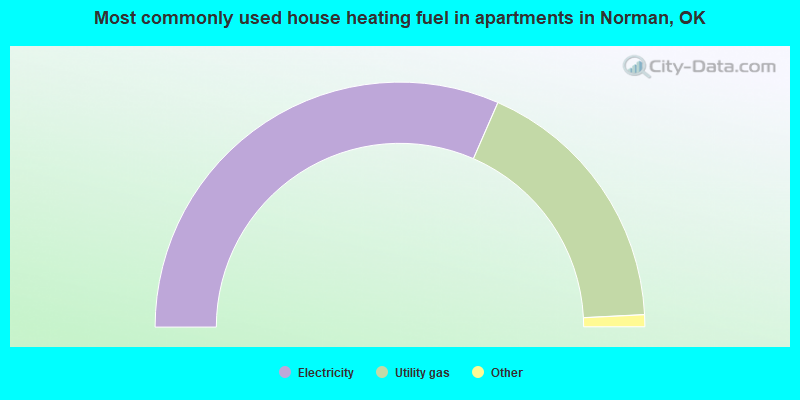
House heating fuel used in apartments - Utility gas (%)
House heating fuel used in apartments - Bottled, tank, or LP gas (%)
House heating fuel used in apartments - Electricity (%)
House heating fuel used in apartments - Fuel oil, kerosene, etc. (%)
House heating fuel used in apartments - Coal or coke (%)
House heating fuel used in apartments - Wood (%)
House heating fuel used in apartments - Solar energy (%)
House heating fuel used in apartments - Other fuel (%)
House heating fuel used in apartments - No fuel used (%)
Latest news about housing in Norman, OK collected exclusively by city-data.com from local newspapers, TV, and radio stations
Median year house/condo built: 1991Median year apartment built: 1983Household type by relationship:
Households: 129,624
Male householders: 26,376 (7,500 living alone ), Female householders: 26,468 (7,824 living alone )23,067 spouses (22,759 opposite-sex spouses ), 3,372 unmarried partners , (2,851 opposite-sex unmarried partners ), 27,936 children (26,189 natural , 521 adopted , 1,226 stepchildren ), 944 grandchildren , 1,527 brothers or sisters , 1,176 parents , 129 foster children , 566 other relatives , 10,075 non-relatives In group quarters: 7,988
Size of family households: 15,775 2-persons , 5,671 3-persons , 6,178 4-persons , 2,067 5-persons , 735 6-persons , 338 7-or-more-persons .
Size of nonfamily households: 15,324 1-person , 4,106 2-persons , 544 3-persons , 1,216 4-persons , 890 5-persons .
15,770 married couples with children. single-parent households (1,140 men , 3,540 women ).
88.5% of residents of Norman speak English at home. of residents speak Spanish at home (75% speak English very well , 12% speak English well , 11% speak English not well , 2% don't speak English at all ).of residents speak other Indo-European language at home (81% speak English very well , 14% speak English well , 5% speak English not well ).of residents speak Asian or Pacific Island language at home (68% speak English very well , 25% speak English well , 7% speak English not well ).of residents speak other language at home (88% speak English very well , 9% speak English well , 3% speak English not well ).
Foreign born population: 8,573 (6.6%)of them are naturalized citizens )
Median number of rooms in houses and condos:
Median number of rooms in apartments
Owner-occupied Renter-occupied
Bedrooms in owner-occupied houses and condos in Norman, Oklahoma
62 no bedroom 577 1 bedroom 2,415 2 bedrooms 15,490 3 bedrooms 7,269 4 bedrooms 1,019 5+ bedrooms
Bedrooms in renter-occupied apartments in Norman, Oklahoma
978 no bedroom 5,795 1 bedroom 8,631 2 bedrooms 8,360 3 bedrooms 1,974 4 bedrooms 274 5+ bedrooms
Owner-occupied Renter-occupied
Rooms in owner-occupied houses in Norman, Oklahoma
62 1 room 27 2 rooms 494 3 rooms 1,095 4 rooms 6,313 5 rooms 7,159 6 rooms 4,895 7 rooms 2,725 8 rooms 4,062 9+ rooms
Rooms in renter-occupied apartments in Norman, Oklahoma
915 1 room 2,637 2 rooms 3,828 3 rooms 6,498 4 rooms 5,320 5 rooms 4,260 6 rooms 1,624 7 rooms 555 8 rooms 375 9+ rooms
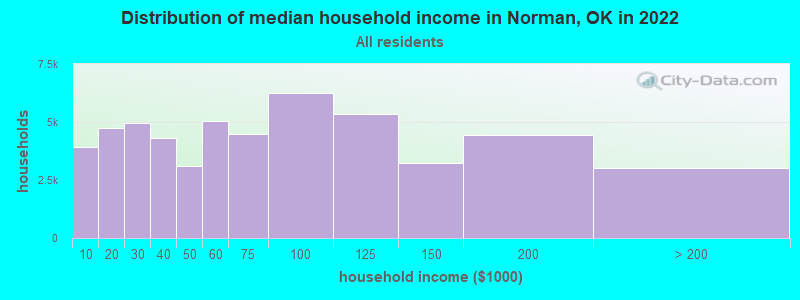
Norman, OK household income distribution 3,936 Less than $10,0004,758 $10,000 to $19,9994,950 $20,000 to $29,9994,299 $30,000 to $39,9993,113 $40,000 to $49,9995,036 $50,000 to $59,9994,477 $60,000 to $74,9996,237 $75,000 to $99,9995,338 $100,000 to $124,9993,224 $125,000 to $149,9994,445 $150,000 to $199,9993,031 $200,000 or more
Home value of owner - occupied houses in 2022 in Norman, OK 53 Less than $10,000119 $10,000 to $14,999381 $15,000 to $19,99945 $20,000 to $24,99984 $25,000 to $29,99938 $30,000 to $34,999179 $35,000 to $39,999215 $40,000 to $49,99946 $50,000 to $59,99955 $60,000 to $69,999397 $70,000 to $79,999302 $80,000 to $89,999134 $90,000 to $99,9991,502 $100,000 to $124,9991,200 $125,000 to $149,9992,446 $150,000 to $174,9992,074 $175,000 to $199,9994,637 $200,000 to $249,9994,615 $250,000 to $299,9993,793 $300,000 to $399,9992,284 $400,000 to $499,9991,754 $500,000 to $749,999230 $750,000 to $999,999221 $1,000,000 to $1,499,99911 $1,500,000 to $1,999,99917 $2,000,000 or moreRent paid by renters in 2022 in Norman, OK 85 $150 to $199260 $200 to $249477 $250 to $2991,069 $300 to $349195 $350 to $399233 $400 to $449316 $450 to $499818 $500 to $5491,080 $550 to $5991,051 $600 to $6492,127 $650 to $6991,608 $700 to $7493,052 $750 to $7992,764 $800 to $8991,735 $900 to $9993,775 $1,000 to $1,2491,573 $1,250 to $1,4991,943 $1,500 to $1,999284 $2,000 to $2,499372 $2,500 to $2,999254 $3,000 to $3,499941 No cash rent
Percentage of workers working in this county: 70.2%Number of people working at home: 7,826 (12.0% of all workers )
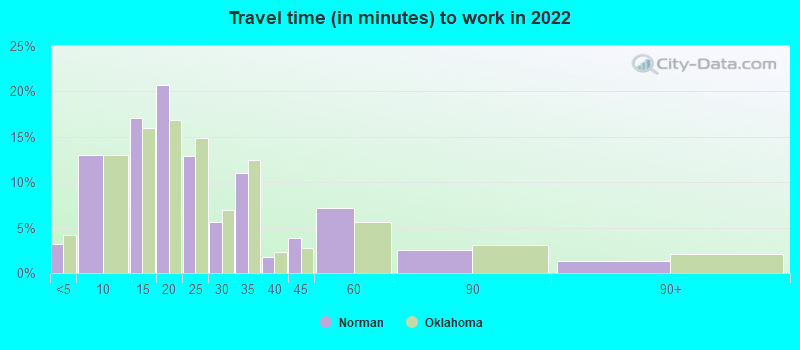
Travel time to work (commute)
Less than 5 minutes: 1,6855 to 9 minutes: 7,81310 to 14 minutes: 10,23715 to 19 minutes: 9,87420 to 24 minutes: 5,96225 to 29 minutes: 2,29930 to 34 minutes: 9,15235 to 39 minutes: 2,29440 to 44 minutes: 2,32845 to 59 minutes: 5,49360 to 89 minutes: 1,11490 or more minutes: 734
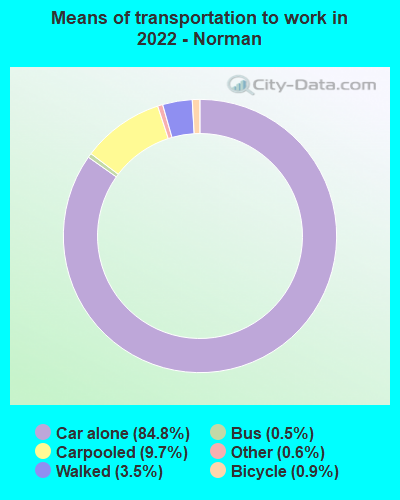
Means of transportation to work:
Drove a car alone: 44,177 (73.8%)Carpooled: 5,277 (8.8%)Bus : 277 (0.5%)Ferryboat: 2 (0.0%)Taxi: 295 (0.5%)Bicycle: 282 (0.5%)Walked: 1,655 (2.8%)Worked at home: 7,826 (13.1%)
Unemployment by race in 2022
Unemployment rate for White non-Hispanic residents 4.6% Males5.9% FemalesUnemployment rate for Black residents 5.0% Males16.9% FemalesUnemployment rate for American Indian and Alaska Native residents 4.9% Males3.4% FemalesUnemployment rate for Asian residents 7.4% Males1.8% FemalesUnemployment rate for other race residents 3.0% Males1.0% FemalesUnemployment rate for two or more race residents 6.3% Males6.3% FemalesUnemployment rate for Hispanic or Latino residents 1.2% Males8.5% Females
Year of entry for the foreign-born population in Norman, Oklahoma
4,566 2010 or later 2,215 2000 to 2009 1,230 1990 to 1999 959 1980 to 1989 761 1970 to 1979 583 Before 1970
First ancestries reported:
English: 8,831 (14.9%)
German: 5,851 (9.9%)
American: 4,625 (7.8%)
Irish: 4,382 (7.4%)
European: 2,696 (4.5%)
Scottish: 1,059 (1.8%)
Iranian: 586 (1.0%)
Italian: 580 (1.0%)
French: 493 (0.8%)
Scotch-Irish: 491 (0.8%)
Polish: 472 (0.8%)
British: 450 (0.8%)
African: 363 (0.6%)
Dutch: 271 (0.5%)
Scandinavian: 246 (0.4%)
Eastern European: 242 (0.4%)
Swedish: 223 (0.4%)
Norwegian: 221 (0.4%)
Northern European: 205 (0.3%)
Welsh: 171 (0.3%)
Czech: 151 (0.3%)
Finnish: 144 (0.2%)
French Canadian: 141 (0.2%)
Russian: 116 (0.2%)
Kenyan: 113 (0.2%)
Turkish: 105 (0.2%)
Slovene: 98 (0.2%)
Portuguese: 89 (0.2%)
Lebanese: 86 (0.1%)
Ghanaian: 83 (0.1%)
Canadian: 82 (0.1%)
Danish: 71 (0.1%)
Haitian: 69 (0.1%)
Iraqi: 62 (0.1%)
Hungarian: 58 (0.10%)
Belgian: 53 (0.09%)
Celtic: 50 (0.08%)
Moroccan: 49 (0.08%)
Bahamian: 48 (0.08%)
Afghan: 35 (0.06%)
Greek: 34 (0.06%)
Swiss: 34 (0.06%)
Ugandan: 33 (0.06%)
Ukrainian: 30 (0.05%)
West Indian: 24 (0.04%)
Macedonian: 23 (0.04%)
Jamaican: 22 (0.04%)
Czechoslovakian: 18 (0.03%)
Belizean: 15 (0.03%)
Dutch West Indian: 15 (0.03%)
Romanian: 14 (0.02%)
Alsatian: 13 (0.02%)
Cajun: 12 (0.02%)
Pennsylvania German: 11 (0.02%)
Croatian: 10 (0.02%)
Israeli: 9 (0.02%)
Armenian: 8 (0.01%)
Slovak: 7 (0.01%)
Zimbabwean: 7 (0.01%)
German Russian: 6 (0.01%)
Lithuanian: 5 (0.01%)
Most common places of birth for foreign-born residents (%): China, excluding Hong Kong and Taiwan Norman:
20.8% (1,875)Oklahoma:
3.2% (7,698)
Mexico Norman:
15.9% (1,434)Oklahoma:
42.4% (103,425)
India Norman:
5.7% (515)Oklahoma:
4.1% (10,034)
El Salvador Norman:
5.3% (477)Oklahoma:
1.6% (3,824)
Iran Norman:
3.0% (274)Oklahoma:
0.9% (2,098)
Korea Norman:
2.9% (263)Oklahoma:
1.7% (4,140)
Philippines Norman:
2.5% (227)Oklahoma:
2.3% (5,671)
Germany Norman:
2.4% (220)Oklahoma:
2.3% (5,498)
Thailand Norman:
2.4% (219)Oklahoma:
1.0% (2,465)
Laos Norman:
1.9% (174)Oklahoma:
1.2% (2,834)
Canada Norman:
1.8% (158)Oklahoma:
2.0% (4,771)
Bangladesh Norman:
1.6% (145)Oklahoma:
0.5% (1,320)
Kenya Norman:
1.6% (144)Oklahoma:
0.5% (1,331)
Colombia Norman:
1.6% (140)Oklahoma:
0.8% (1,892)
Place of birth for U.S.-born residents:
This state: 70,686Other state: 48,544Northeast: 2,687Midwest: 12,754South: 21,754West: 11,349 77.0% of Norman residents lived in the same house 1 years ago.
Out of people who lived in different houses, 32.7% lived in this county.
Out of people who lived in different counties, 64.2% lived in Oklahoma.
Norman:
77.0%State average:
85.5%
Education attainment for males 25 years and older:
No schooling: 240Nursery to 4th grade: 05th and 6th grade: 4107th and 8th grade: 1399th grade: 15610th grade: 57311th grade: 98312th grade, no diploma: 735High school graduate (or equivalency): 7,268Less than 1 year of college: 2,956Some college more than 1 year, no degree: 4,392Associate degree: 2,707Bachelor's degree: 8,755Master's degree: 4,411Professional school degree: 1,495Doctorate degree: 2,326
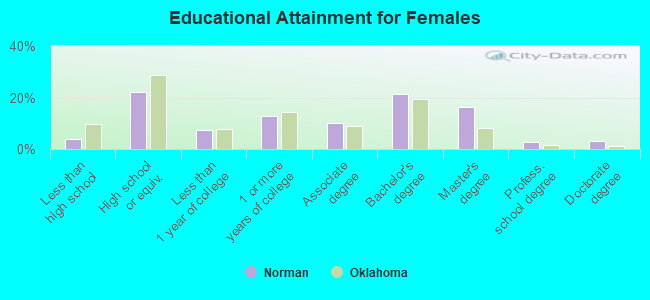
Education attainment for females 25 years and older:
No schooling: 251Nursery to 4th grade: 05th and 6th grade: 1417th and 8th grade: 669th grade: 2610th grade: 41911th grade: 77512th grade, no diploma: 124High school graduate (or equivalency): 6,777Less than 1 year of college: 3,300Some college more than 1 year, no degree: 5,842Associate degree: 2,686Bachelor's degree: 9,541Master's degree: 7,105Professional school degree: 710Doctorate degree: 1,461
Housing units in structures:
One, detached: 35,770One, attached: 1,616Two: 2,0333 or 4: 3,9325 to 9: 4,75910 to 19: 2,29620 to 49: 2,00850 or more: 2,232Mobile homes: 2,056Median worth of mobile homes: $101,100
Housing units lacking complete plumbing facilities in 2022: 1.0%Housing units lacking complete kitchen facilities in 2022: 1.4%House/condo owner moved in on average 9 years ago
Renter moved in on average 1 years ago
Private vs. public school enrollment:
Students in private schools in grades 1 to 8 (elementary and middle school): 1,347 Students in private schools in grades 9 to 12 (high school): 448 Students in private undergraduate colleges: 695