Round Lake Beach, IL (Illinois) Houses and Residents
| Round Lake Beach: | $179,731 |
| Illinois: | $251,600 |
Total population: 28,012 (Urban population: 25,659, Rural population: 0)
Houses: 8,689 (8,297 occupied: 6,749 owner occupied, 1,705 renter occupied)
| % of renters here: | 20% |
| State: | 33% |
Housing density: 1,739 houses/condos per square mile
Median price asked for vacant for-sale houses and condos in 2022: $1,794,298.
Median contract rent in 2022: $1,193 (lower quartile is $967, upper quartile is $1,410)
Median rent asked for vacant for-rent units in 2022: $2,113
Median gross rent in Round Lake Beach, IL in 2022: $1,427
Housing units in Round Lake Beach with a mortgage: 4,212 (300 second mortgage, 0 home equity loan, 245 both second mortgage and home equity loan)
Houses without a mortgage: 27
Median household income for houses/condos with a mortgage: $93,277
Median household income for apartments without a mortgage: $93,155
Median monthly housing costs: $1,301
Compare current foreclosures near Round Lake Beach, IL:
| Photo | Address | Area | Beds / Baths | Price | Details |
|---|---|---|---|---|---|

|
#1
Elisha Ave
Zion, IL 60099
|
2,545 sq. feet
|
3 baths 3 beds |
$189,900
|
show details |

|
#2
Wisconsin Ave
Barrington, IL 60010
|
1,297 sq. feet
|
2 baths 3 beds |
$489,900
|
show details |

|
#3
Clover Ct
Round Lake, IL 60073
|
1,682 sq. feet
|
1 baths 3 beds |
$273,000
|
show details |

|
#4
N Indian Ln
Grayslake, IL 60030
|
896 sq. feet
|
2 baths 3 beds |
show details | |

|
#5
W Pamela Pl
Gurnee, IL 60031
|
1,489 sq. feet
|
2 baths 3 beds |
show details | |

|
#6
Neubauer Cir
Lake Villa, IL 60046
|
1,620 sq. feet
|
3 baths 3 beds |
show details | |

|
#7
Teal Rd
Lake Villa, IL 60046
|
1,700 sq. feet
|
3 baths 3 beds |
show details | |

|
#8
N Jackson St
Waukegan, IL 60085
|
1,624 sq. feet
|
3 baths 5 beds |
show details | |

|
#9
Fairview Ln
Woodstock, IL 60098
|
2,215 sq. feet
|
3 baths 3 beds |
show details | |

|
#10
Grove Ave
North Chicago, IL 60064
|
2,180 sq. feet
|
2 baths 4 beds |
show details |
| Photo | Address | Area | Beds / Baths | Price | Details |
|---|---|---|---|---|---|

|
#11
Linden Ave
Waukegan, IL 60087
|
1,414 sq. feet
|
2 baths 3 beds |
show details | |

|
#12
W Sterling Ct
Grayslake, IL 60030
|
1,240 sq. feet
|
2 baths 2 beds |
show details | |

|
#13
Elisha Ave
Zion, IL 60099
|
1,764 sq. feet
|
2 baths 5 beds |
show details | |

|
#14
Pheasant Run
Zion, IL 60099
|
1,104 sq. feet
|
2 baths 3 beds |
show details | |

|
#15
N Jackson St
Waukegan, IL 60085
|
1,320 sq. feet
|
2 baths 3 beds |
show details | |

|
#16
W Elm St
Silver Lake, WI 53170
|
1,554 sq. feet
|
2 baths 3 beds |
show details | |

|
#17
Eshcol Ave
Zion, IL 60099
|
816 sq. feet
|
1 baths 2 beds |
show details | |

|
#18
Linden Ave
Waukegan, IL 60087
|
1,136 sq. feet
|
2 baths 2 beds |
show details | |

|
#19
N Idlewild Ave
Mundelein, IL 60060
|
1,218 sq. feet
|
2 baths 4 beds |
show details | |

|
#20
Bedford Ln
Round Lake, IL 60073
|
3,209 sq. feet
|
4 baths 4 beds |
show details |
| Photo | Address | Area | Beds / Baths | Price | Details |
|---|---|---|---|---|---|

|
#21
Savannah Ln
Crystal Lake, IL 60014
|
1,316 sq. feet
|
6 baths 2 beds |
show details | |

|
#22
S Prairie Ave
Mundelein, IL 60060
|
936 sq. feet
|
2 baths 3 beds |
show details | |

|
#23
Wildwood Trl
Cary, IL 60013
|
1,140 sq. feet
|
2 baths 2 beds |
show details | |

|
#24
236th Ave
Salem, WI 53168
|
1,008 sq. feet
|
2 baths 3 beds |
show details | |

|
#25
Ezekiel Ave
Zion, IL 60099
|
1,620 sq. feet
|
3 baths 3 beds |
show details | |

|
#26
Elisha Ave
Zion, IL 60099
|
1,404 sq. feet
|
2 baths 4 beds |
show details | |

|
#27
Walnut St
Waukegan, IL 60085
|
1,050 sq. feet
|
1 baths 3 beds |
show details | |

|
#28
N Autumn Cir
Lake Villa, IL 60046
|
2,240 sq. feet
|
3 baths 3 beds |
show details | |

|
#29
245th Ave
Salem, WI 53168
|
980 sq. feet
|
1 baths 2 beds |
show details | |

|
#30
Luke Ave
Zion, IL 60099
|
1,524 sq. feet
|
2 baths 3 beds |
show details |
| Photo | Address | Area | Beds / Baths | Price | Details |
|---|---|---|---|---|---|

|
#31
Hazel Ct
Island Lake, IL 60042
|
708 sq. feet
|
3 baths 2 beds |
show details | |

|
#32
Shelby Ct
Gurnee, IL 60031
|
1,044 sq. feet
|
2 baths 3 beds |
show details | |

|
#33
N Victory St
Waukegan, IL 60085
|
1,038 sq. feet
|
1 baths 2 beds |
show details | |

|
#34
Cherry Dr
Wonder Lake, IL 60097
|
1,176 sq. feet
|
3 baths 2 beds |
show details | |

|
#35
W Michigan Blvd
Antioch, IL 60002
|
2,386 sq. feet
|
3 baths 3 beds |
show details | |

|
#36
Linden Ave
Zion, IL 60099
|
1,563 sq. feet
|
2 baths 3 beds |
show details | |

|
#37
N Augusta Dr
Wadsworth, IL 60083
|
1,040 sq. feet
|
2 baths 2 beds |
show details | |

|
#38
Toccoa Ln
Round Lake, IL 60073
|
2,032 sq. feet
|
3 baths 3 beds |
show details | |

|
#39
Bittersweet Dr
Gurnee, IL 60031
|
3,002 sq. feet
|
3 baths 4 beds |
show details | |

|
#40
Wild Plum Rd
Crystal Lake, IL 60014
|
3,336 sq. feet
|
6 baths 4 beds |
show details |
| Photo | Address | Area | Beds / Baths | Price | Details |
|---|---|---|---|---|---|

|
#41
Gilead Ave
Zion, IL 60099
|
1,489 sq. feet
|
2 baths 4 beds |
show details | |

|
#42
Harrisburg Ct
Lake Villa, IL 60046
|
2,278 sq. feet
|
3 baths 3 beds |
show details | |

|
#43
Woodbury Cir
Gurnee, IL 60031
|
2,072 sq. feet
|
3 baths 3 beds |
show details | |

|
#44
Cedar Rd
Wonder Lake, IL 60097
|
1,177 sq. feet
|
2 baths 3 beds |
show details | |

|
#45
Woodbury Cir
Gurnee, IL 60031
|
1,873 sq. feet
|
3 baths 3 beds |
show details | |

|
#46
W Schlosser Ct
Wadsworth, IL 60083
|
1,558 sq. feet
|
3 baths 3 beds |
show details | |

|
#47
Bradford Ln
Mundelein, IL 60060
|
1,576 sq. feet
|
2 baths 3 beds |
show details | |

|
#48
N Sheridan Rd
Waukegan, IL 60087
|
1,401 sq. feet
|
1 baths 1 beds |
show details | |

|
#49
N Idlewild Dr
Grayslake, IL 60030
|
1,158 sq. feet
|
2 baths 3 beds |
show details | |

|
Check over 1 million property listings on Foreclosure.com!
|
browse all offers | |||


Median year apartment built: 1988
Household type by relationship:
Households: 27,075- Male householders: 4,614 (915 living alone), Female householders: 3,597 (694 living alone)
4,300 spouses (4,267 opposite-sex spouses), 829 unmarried partners, (824 opposite-sex unmarried partners), 10,129 children (9,622 natural, 94 adopted, 412 stepchildren), 889 grandchildren, 656 brothers or sisters, 408 parents, 0 foster children, 1,085 other relatives, 429 non-relatives
- In group quarters: 133
Size of family households: 1,616 2-persons, 1,496 3-persons, 1,482 4-persons, 1,082 5-persons, 392 6-persons, 432 7-or-more-persons.
Size of nonfamily households: 1,699 1-person, 175 2-persons, 16 3-persons.
4,231 married couples with children.
1,831 single-parent households (669 men, 1,162 women).
49.9% of residents of Round Lake Beach speak English at home.
45.4% of residents speak Spanish at home (58% speak English very well, 24% speak English well, 15% speak English not well, 3% don't speak English at all).
2.9% of residents speak other Indo-European language at home (71% speak English very well, 23% speak English well, 6% speak English not well).
0.9% of residents speak Asian or Pacific Island language at home (59% speak English very well, 34% speak English well, 7% speak English not well).
0.5% of residents speak other language at home (67% speak English very well, 33% speak English well).
Foreign born population: 6,627 (24.5%)
(40.4% of them are naturalized citizens)
| Here: | 6.3 |
| State: | 6.4 |
| Here: | 5.0 |
| State: | 4.1 |

- Bedrooms in owner-occupied houses and condos in Round Lake Beach, Illinois
- 31no bedroom
- 1331 bedroom
- 9202 bedrooms
- 3,4263 bedrooms
- 1,7794 bedrooms
- 4615+ bedrooms

- Bedrooms in renter-occupied apartments in Round Lake Beach, Illinois
- 0no bedroom
- 2221 bedroom
- 4822 bedrooms
- 7693 bedrooms
- 1964 bedrooms
- 375+ bedrooms

- Cars and other vehicles available in Round Lake Beach in owner-occupied houses/condos
- 90no vehicle
- 1,5051 vehicle
- 2,7542 vehicles
- 1,4423 vehicles
- 5854 vehicles
- 3755+ vehicles

- Cars and other vehicles available in Round Lake Beach in renter-occupied apartments
- 131no vehicle
- 5261 vehicle
- 6382 vehicles
- 2713 vehicles
- 1134 vehicles
- 275+ vehicles

- Rooms in owner-occupied houses in Round Lake Beach, Illinois
- 241 room
- 72 rooms
- 1883 rooms
- 4114 rooms
- 1,4335 rooms
- 1,6056 rooms
- 1,1717 rooms
- 1,1348 rooms
- 7769+ rooms

- Rooms in renter-occupied apartments in Round Lake Beach, Illinois
- 01 room
- 882 rooms
- 3393 rooms
- 2074 rooms
- 4705 rooms
- 2226 rooms
- 2027 rooms
- 118 rooms
- 1679+ rooms


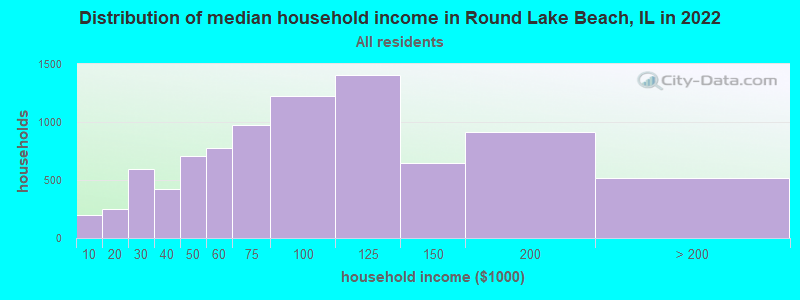
Round Lake Beach, IL household income distribution

- 195Less than $10,000
- 249$10,000 to $19,999
- 598$20,000 to $29,999
- 424$30,000 to $39,999
- 703$40,000 to $49,999
- 778$50,000 to $59,999
- 975$60,000 to $74,999
- 1,224$75,000 to $99,999
- 1,401$100,000 to $124,999
- 649$125,000 to $149,999
- 918$150,000 to $199,999
- 514$200,000 or more
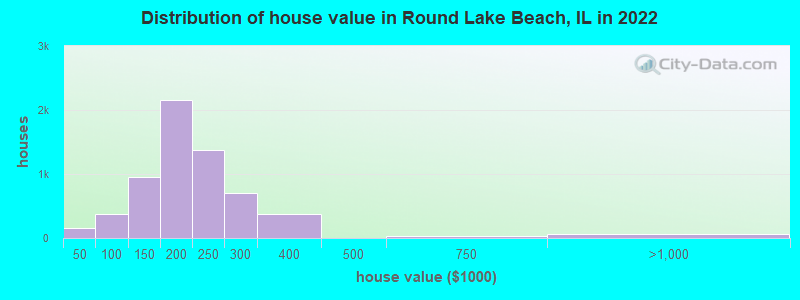
Home value of owner - occupied houses in 2022 in Round Lake Beach, IL
-
- 47Less than $10,000
- 17$10,000 to $14,999
- 5$15,000 to $19,999
- 55$20,000 to $24,999
- 16$25,000 to $29,999
- 9$40,000 to $49,999
- 35$50,000 to $59,999
- 12$60,000 to $69,999
- 90$70,000 to $79,999
- 152$80,000 to $89,999
- 81$90,000 to $99,999
- 429$100,000 to $124,999
- 525$125,000 to $149,999
- 1,550$150,000 to $174,999
- 602$175,000 to $199,999
- 1,378$200,000 to $249,999
- 704$250,000 to $299,999
- 370$300,000 to $399,999
- 4$400,000 to $499,999
- 36$500,000 to $749,999
- 38$750,000 to $999,999
- 15$1,000,000 to $1,499,999
Rent paid by renters in 2022 in Round Lake Beach, IL
-
- 1$150 to $199
- 7$200 to $249
- 48$300 to $349
- 36$350 to $399
- 14$400 to $449
- 12$450 to $499
- 19$700 to $749
- 93$750 to $799
- 39$800 to $899
- 335$900 to $999
- 327$1,000 to $1,249
- 483$1,250 to $1,499
- 216$1,500 to $1,999
- 24$2,000 to $2,499
- 4$3,500 or more
- 114No cash rent


Percentage of workers working in this county: 77.5%
Number of people working at home: 1,128 (8.0% of all workers)
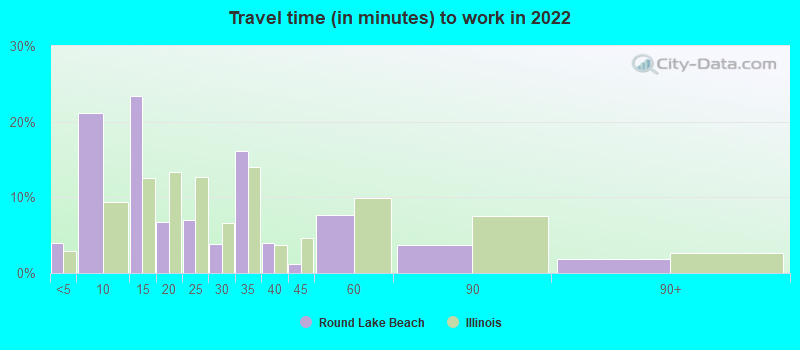
Travel time to work (commute)
- Less than 5 minutes: 231
- 5 to 9 minutes: 1,091
- 10 to 14 minutes: 735
- 15 to 19 minutes: 1,295
- 20 to 24 minutes: 1,787
- 25 to 29 minutes: 1,561
- 30 to 34 minutes: 1,690
- 35 to 39 minutes: 680
- 40 to 44 minutes: 750
- 45 to 59 minutes: 1,689
- 60 to 89 minutes: 814
- 90 or more minutes: 247
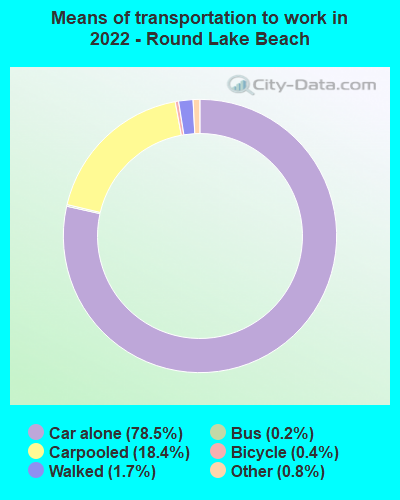
Means of transportation to work:
- Drove a car alone: 2,393 (58.5%)
- Carpooled: 571 (14.0%)
- Bus: 7 (0.2%)
- Taxi: 25 (0.6%)
- Bicycle: 15 (0.4%)
- Walked: 51 (1.2%)
- Worked at home: 1,128 (27.6%)

- Unemployment by race in 2022
- Unemployment rate for White non-Hispanic residents
- 5.1%Males
- 6.1%Females
- Unemployment rate for Black residents
- 10.6%Males
- Unemployment rate for Asian residents
- 3.1%Males
- 37.4%Females
- Unemployment rate for other race residents
- 2.4%Males
- 4.9%Females
- Unemployment rate for two or more race residents
- 1.3%Males
- Unemployment rate for Hispanic or Latino residents
- 1.3%Males
- 5.4%Females

- Year of entry for the foreign-born population in Round Lake Beach, Illinois
- 8842010 or later
- 1,2182000 to 2009
- 2,3881990 to 1999
- 1,4011980 to 1989
- 8131970 to 1979
- 289Before 1970

First ancestries reported:
- German: 809 (5.1%)
- Polish: 657 (4.2%)
- American: 512 (3.3%)
- English: 439 (2.8%)
- Irish: 382 (2.4%)
- Italian: 377 (2.4%)
- European: 188 (1.2%)
- Arab: 68 (0.4%)
- Norwegian: 44 (0.3%)
- Lithuanian: 40 (0.3%)
- Hungarian: 38 (0.2%)
- Scandinavian: 38 (0.2%)
- Eastern European: 34 (0.2%)
- Haitian: 33 (0.2%)
- British: 32 (0.2%)
- Russian: 32 (0.2%)
- Yugoslavian: 32 (0.2%)
- Belizean: 30 (0.2%)
- Maltese: 25 (0.2%)
- Welsh: 24 (0.2%)
- French Canadian: 20 (0.1%)
- Kenyan: 20 (0.1%)
- Czech: 20 (0.1%)
- Portuguese: 17 (0.1%)
- Greek: 16 (0.1%)
- Nigerian: 16 (0.1%)
- Swedish: 16 (0.1%)
- Jamaican: 15 (0.10%)
- Brazilian: 13 (0.08%)
- Scotch-Irish: 9 (0.06%)
- Slovak: 9 (0.06%)
- African: 9 (0.06%)
- Croatian: 8 (0.05%)
- Belgian: 7 (0.04%)
- Romanian: 7 (0.04%)
- Danish: 7 (0.04%)
- Austrian: 6 (0.04%)
- Northern European: 2 (0.01%)
Most common places of birth for foreign-born residents (%):
| Round Lake Beach: | 75.6% (4,803) |
| Illinois: | 34.7% (626,958) |
| Round Lake Beach: | 4.3% (272) |
| Illinois: | 0.6% (10,762) |
| Round Lake Beach: | 3.9% (250) |
| Illinois: | 6.9% (124,474) |
| Round Lake Beach: | 2.0% (130) |
| Illinois: | 5.2% (93,003) |
| Round Lake Beach: | 2.0% (126) |
| Illinois: | 0.9% (16,553) |
| Round Lake Beach: | 1.7% (106) |
| Illinois: | 9.2% (166,409) |
Place of birth for U.S.-born residents:
- This state: 17,162
- Other state: 3,011
- Northeast: 275
- Midwest: 915
- South: 1,035
- West: 828
94.1% of Round Lake Beach residents lived in the same house 1 years ago.
Out of people who lived in different houses, 38.5% lived in this county.
Out of people who lived in different counties, 78.0% lived in Illinois.
| Round Lake Beach: | 94.1% |
| State average: | 88.3% |
Education attainment for males 25 years and older:
- No schooling: 416
- Nursery to 4th grade: 106
- 5th and 6th grade: 314
- 7th and 8th grade: 372
- 9th grade: 148
- 10th grade: 236
- 11th grade: 65
- 12th grade, no diploma: 399
- High school graduate (or equivalency): 3,403
- Less than 1 year of college: 468
- Some college more than 1 year, no degree: 1,150
- Associate degree: 460
- Bachelor's degree: 858
- Master's degree: 300
- Professional school degree: 38
- Doctorate degree: 40

Education attainment for females 25 years and older:
- No schooling: 299
- Nursery to 4th grade: 65
- 5th and 6th grade: 184
- 7th and 8th grade: 235
- 9th grade: 134
- 10th grade: 105
- 11th grade: 128
- 12th grade, no diploma: 491
- High school graduate (or equivalency): 2,255
- Less than 1 year of college: 634
- Some college more than 1 year, no degree: 1,022
- Associate degree: 724
- Bachelor's degree: 1,045
- Master's degree: 471
- Professional school degree: 16
- Doctorate degree: 42


Housing units in structures:
- One, detached: 6,770
- One, attached: 907
- 3 or 4: 294
- 5 to 9: 197
- 10 to 19: 205
- 20 to 49: 37
- 50 or more: 216
- Mobile homes: 59
Housing units lacking complete kitchen facilities in 2022: 2.0%
House/condo owner moved in on average 11 years ago
Renter moved in on average 6 years ago

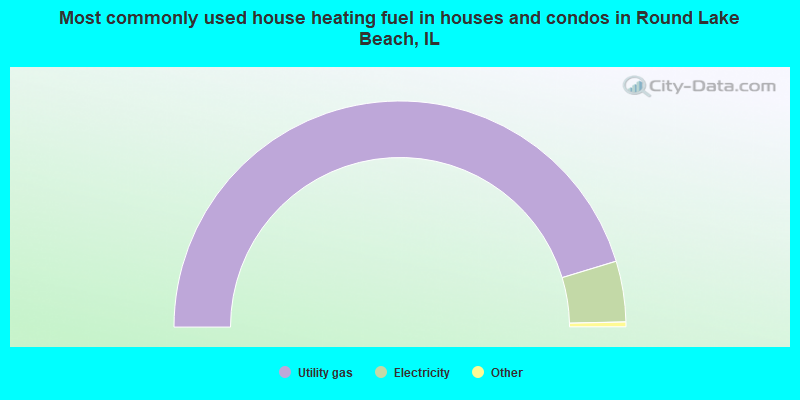
- 90.6%Utility gas
- 8.7%Electricity
- 0.6%Bottled, tank, or LP gas
- 0.1%No fuel used
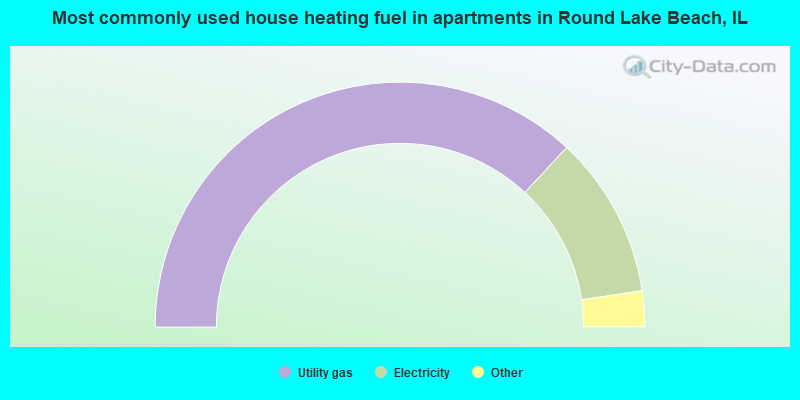
- 73.9%Utility gas
- 21.5%Electricity
- 3.9%Bottled, tank, or LP gas
- 0.7%No fuel used
Private vs. public school enrollment:
| Here: | 4.8% |
| Illinois: | 13.3% |
| Here: | 2.6% |
| Illinois: | 9.9% |
| Here: | 13.0% |
| Illinois: | 27.4% |


