Salinas, CA (California) Houses and Residents
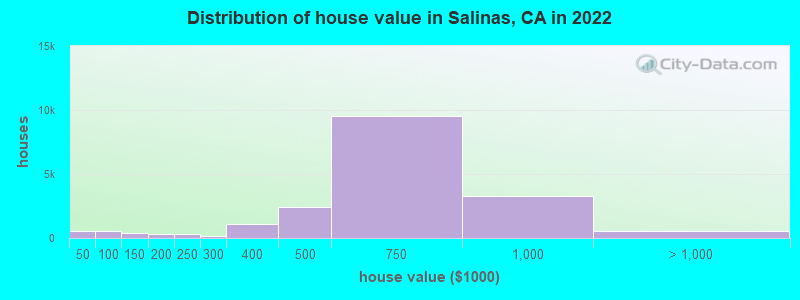
Estimated median house or condo value in 2022: $590,400 (it was $189,500 in 2000 )
Salinas:
$590,400California:
$715,900
Lower value quartile - upper value quartile: $432,200 - $733,900Mean price in 2022: Detached houses: $653,001 Here:
$653,001State:
$988,808
Townhouses or other attached units: $487,288 Here:
$487,288State:
$838,546
In 3-to-4-unit structures: $445,078 Here:
$445,078State:
$824,253
In 5-or-more-unit structures: $296,430 Here:
$296,430State:
$730,996
Mobile homes: $180,817 Here:
$180,817State:
$184,506
Total population: 156,677 (Urban population: 150,709, Rural population: 15 (all nonfarm) )
Houses: 47,681 (45,815 occupied: 20,576 owner occupied, 25,239 renter occupied )
% of renters here:
55%State:
44%
Housing density: 2,509 houses/condos per square mile
Median price asked for vacant for-sale houses and condos in 2022: $551,827.
Median contract rent in 2022: $1,712 (lower quartile is $1,310, upper quartile is over $2,000)
Median rent asked for vacant for-rent units in 2022: $2,076
Median gross rent in Salinas, CA in 2022: $1,838
Housing units in Salinas with a mortgage: 12,702 (852 second mortgage, 23 home equity loan, 820 both second mortgage and home equity loan )Houses without a mortgage: 159
Median household income for houses/condos with a mortgage: $120,841
Median household income for apartments without a mortgage: $75,270
Median monthly housing costs: $1,746
Data:
Median house or condo value ($)
Median house or condo value ($ change since 2000)
Median house or condo value ($) - White
Median house or condo value ($) - Black or African American
Median house or condo value ($) - Asian
Median house or condo value ($) - Hispanic or Latino
Median house or condo value ($) - American Indian and Alaska Native
Median house or condo value ($) - Multirace
Median house or condo value ($) - Other Race
Median price asked for mobile homes ($)
Household density (households per square mile)
Mean house or condo value by units in structure - 1, detached ($)
Mean house or condo value by units in structure - 1, attached ($)
Mean house or condo value by units in structure - 2 ($)
Mean house or condo value by units in structure by units in structure - 3 or 4 ($)
Mean house or condo value by units in structure - 5 or more ($)
Mean house or condo value by units in structure - Boat, RV, van, etc. ($)
Mean house or condo value by units in structure - Mobile home ($)
Median contract rent ($)
Median contract rent - Lower quartile ($)
Median contract rent - Upper quartile ($)
Median gross rent ($)
Urban houses (%)
Rural houses (%)
Houses occupied (%)
Houses occupied (% change since 2000)
Houses owner occupied (%)
Houses owner occupied (% change since 2000)
Houses renter occupied (%)
Houses renter occupied (% change since 2000)
Vacant housing units - For rent (%)
Vacant housing units - For rent (% change since 2000)
Vacant housing units - For sale only (%)
Vacant housing units - For sale only (% change since 2000)
Vacant housing units - Rented or sold, not occupied (%)
Vacant housing units - Rented or sold, not occupied (% change since 2000)
Vacant housing units - For seasonal, recreational, or occasional use (%)
Vacant housing units - For seasonal, recreational, or occasional use (% change since 2000)
Vacant housing units - For migrant workers (%)
Vacant housing units - For migrant workers (% change since 2000)
Vacant housing units - Other vacant (%)
Vacant housing units - Other vacant (% change since 2000)
Median monthly housing costs ($)
Median household income for houses/condos with a mortgage ($)
Median household income for houses/condos without a mortgage ($)
Median household income ($)
Median household income ($) - White
Median household income ($) - Black or African American
Median household income ($) - Asian
Median household income ($) - Hispanic or Latino
Median household income ($) - American Indian and Alaska Native
Median household income ($) - Multirace
Median household income ($) - Other Race
Mortgage status - with mortgage (%)
Mortgage status - with second mortgage (%)
Mortgage status - with home equity loan (%)
Mortgage status - with both second mortgage and home equity loan (%)
Mortgage status - without a mortgage (%)
Median year house/condo built
Median year apartment built
Household type by relationship - Male householder living alone (%)
Household type by relationship - Male householder not living alone (%)
Household type by relationship - Female householder living alone (%)
Household type by relationship - Female householder not living alone (%)
Household type by relationship - Opposite-Sex spouse (%)
Household type by relationship - Same-Sex spouse (%)
Household type by relationship - Opposite-Sex unmarried partner (%)
Household type by relationship - Same-Sex unmarried partner (%)
Household type by relationship - In group quarters (%)
Size of family households - 2-person household (%)
Size of family households - 3-person household (%)
Size of family households - 4-person household (%)
Size of family households - 5-person household (%)
Size of family households - 6-person household (%)
Size of family households - 7-or-more-person household (%)
Size of nonfamily households - 1-person household (%)
Size of nonfamily households - 2-person household (%)
Size of nonfamily households - 3-person household (%)
Size of nonfamily households - 4-person household (%)
Size of nonfamily households - 5-person household (%)
Size of nonfamily households - 6-person household (%)
Size of nonfamily households - 7-or-moreperson household (%)
Year house built - Built 2010 or later (%)
Year house built - Built 2000 to 2009 (%)
Year house built - Built 1990 to 1999 (%)
Year house built - Built 1980 to 1989 (%)
Year house built - Built 1970 to 1979 (%)
Year house built - Built 1960 to 1969 (%)
Year house built - Built 1950 to 1959 (%)
Year house built - Built 1940 to 1949 (%)
Year house built - Built 1939 or earlier (%)
Median number of rooms in houses and condos
Median number of rooms in apartments
Median number of bedrooms in owner occupied houses
Mean number of bedrooms in owner occupied houses
Median number of bedrooms in renter occupied houses
Mean number of bedrooms in renter occupied houses
Median number of vehichles in owner occupied houses
Mean number of vehichles in owner occupied houses
Median number of vehichles in renter occupied houses
Mean number of vehichles in renter occupied houses
Rooms in owner-occupied houses - 1 room (%)
Rooms in owner-occupied houses - 2 rooms (%)
Rooms in owner-occupied houses - 3 rooms (%)
Rooms in owner-occupied houses - 4 rooms (%)
Rooms in owner-occupied houses - 5 rooms (%)
Rooms in owner-occupied houses - 6 rooms (%)
Rooms in owner-occupied houses - 7 rooms (%)
Rooms in owner-occupied houses - 8 rooms (%)
Rooms in owner-occupied houses - 9+ rooms (%)
Rooms in renter-occupied houses - 1 room (%)
Rooms in renter-occupied houses - 2 rooms (%)
Rooms in renter-occupied houses - 3 rooms (%)
Rooms in renter-occupied houses - 4 rooms (%)
Rooms in renter-occupied houses - 5 rooms (%)
Rooms in renter-occupied houses - 6 rooms (%)
Rooms in renter-occupied houses - 7 rooms (%)
Rooms in renter-occupied houses - 8 rooms (%)
Rooms in renter-occupied houses - 9+ rooms (%)
Bedrooms in owner-occupied houses - no bedrooms (%)
Bedrooms in owner-occupied houses - 1 bedroom (%)
Bedrooms in owner-occupied houses - 2 bedrooms (%)
Bedrooms in owner-occupied houses - 3 bedrooms (%)
Bedrooms in owner-occupied houses - 4 bedrooms (%)
Bedrooms in owner-occupied houses - 5+ bedrooms (%)
Bedrooms in renter-occupied houses - no bedrooms (%)
Bedrooms in renter-occupied houses - 1 bedroom (%)
Bedrooms in renter-occupied houses - 2 bedrooms (%)
Bedrooms in renter-occupied houses - 3 bedrooms (%)
Bedrooms in renter-occupied houses - 4 bedrooms (%)
Bedrooms in renter-occupied houses - 5+ bedrooms (%)
Vehicles available in owner-occupied houses - no vehicle available (%)
Vehicles available in owner-occupied houses - 1 vehicle available(%)
Vehicles available in owner-occupied houses - 2 Vehicles available (%)
Vehicles available in owner-occupied houses - 3 Vehicles available (%)
Vehicles available in owner-occupied houses - 4 Vehicles available (%)
Vehicles available in owner-occupied houses - 5+ Vehicles available (%)
Vehicles available in renter-occupied houses - no vehicle available (%)
Vehicles available in renter-occupied houses - 1 vehicle available (%)
Vehicles available in renter-occupied houses - 2 Vehicles available (%)
Vehicles available in renter-occupied houses - 3 Vehicles available (%)
Vehicles available in renter-occupied houses - 4 Vehicles available (%)
Vehicles available in renter-occupied houses - 5+ Vehicles available (%)
Housing units in structures - 1, detached (%)
Housing units in structures - 1, attached (%)
Housing units in structures - 2 (%)
Housing units in structures - 3 or 4 (%)
Housing units in structures - 5 to 9 (%)
Housing units in structures - 10 to 19 (%)
Housing units in structures - 20 to 49 (%)
Housing units in structures - 50 or more (%)
Housing units in structures - Mobile home (%)
Housing units in structures - Boat, RV, van, etc. (%)
Housing units in structures - Owners - 1, detached (%)
Housing units in structures - Owners - 1, attached (%)
Housing units in structures - Owners - 2 (%)
Housing units in structures - Owners - 3 or 4 (%)
Housing units in structures - Owners - 5 to 9 (%)
Housing units in structures - Owners - 10 to 19 (%)
Housing units in structures - Owners - 20 to 49 (%)
Housing units in structures - Owners - 50 or more (%)
Housing units in structures - Owners - Mobile home (%)
Housing units in structures - Owners - Boat, RV, van, etc. (%)
Housing units in structures - Renters - 1, detached (%)
Housing units in structures - Renters - 1, attached (%)
Housing units in structures - Renters - 2 (%)
Housing units in structures - Renters - 3 or 4 (%)
Housing units in structures - Renters - 5 to 9 (%)
Housing units in structures - Renters - 10 to 19 (%)
Housing units in structures - Renters - 20 to 49 (%)
Housing units in structures - Renters - 50 or more (%)
Housing units in structures - Renters - Mobile home (%)
Housing units in structures - Renters - Boat, RV, van, etc. (%)
House/condo owner moved in on average (years ago)
Renter moved in on average (years ago)
Year householder moved into unit - Moved in 1999 to March 2000 (%)
Year householder moved into unit - Moved in 1999 to March 2000 (%) - White
Year householder moved into unit - Moved in 1999 to March 2000 (%) - Black or African American
Year householder moved into unit - Moved in 1999 to March 2000 (%) - Asian
Year householder moved into unit - Moved in 1999 to March 2000 (%) - Hispanic or Latino
Year householder moved into unit - Moved in 1999 to March 2000 (%) - American Indian and Alaska Native
Year householder moved into unit - Moved in 1999 to March 2000 (%) - Multirace
Year householder moved into unit - Moved in 1999 to March 2000 (%) - Other Race
Year householder moved into unit - Moved in 1995 to 1998 (%)
Year householder moved into unit - Moved in 1995 to 1998 (%) - White
Year householder moved into unit - Moved in 1995 to 1998 (%) - Black or African American
Year householder moved into unit - Moved in 1995 to 1998 (%) - Asian
Year householder moved into unit - Moved in 1995 to 1998 (%) - Hispanic or Latino
Year householder moved into unit - Moved in 1995 to 1998 (%) - American Indian and Alaska Native
Year householder moved into unit - Moved in 1995 to 1998 (%) - Multirace
Year householder moved into unit - Moved in 1995 to 1998 (%) - Other Race
Year householder moved into unit - Moved in 1990 to 1994 (%)
Year householder moved into unit - Moved in 1990 to 1994 (%) - White
Year householder moved into unit - Moved in 1990 to 1994 (%) - Black or African American
Year householder moved into unit - Moved in 1990 to 1994 (%) - Asian
Year householder moved into unit - Moved in 1990 to 1994 (%) - Hispanic or Latino
Year householder moved into unit - Moved in 1990 to 1994 (%) - American Indian and Alaska Native
Year householder moved into unit - Moved in 1990 to 1994 (%) - Multirace
Year householder moved into unit - Moved in 1990 to 1994 (%) - Other Race
Year householder moved into unit - Moved in 1980 to 1989 (%)
Year householder moved into unit - Moved in 1980 to 1989 (%) - White
Year householder moved into unit - Moved in 1980 to 1989 (%) - Black or African American
Year householder moved into unit - Moved in 1980 to 1989 (%) - Asian
Year householder moved into unit - Moved in 1980 to 1989 (%) - Hispanic or Latino
Year householder moved into unit - Moved in 1980 to 1989 (%) - American Indian and Alaska Native
Year householder moved into unit - Moved in 1980 to 1989 (%) - Multirace
Year householder moved into unit - Moved in 1980 to 1989 (%) - Other Race
Year householder moved into unit - Moved in 1970 to 1979 (%)
Year householder moved into unit - Moved in 1970 to 1979 (%) - White
Year householder moved into unit - Moved in 1970 to 1979 (%) - Black or African American
Year householder moved into unit - Moved in 1970 to 1979 (%) - Asian
Year householder moved into unit - Moved in 1970 to 1979 (%) - Hispanic or Latino
Year householder moved into unit - Moved in 1970 to 1979 (%) - American Indian and Alaska Native
Year householder moved into unit - Moved in 1970 to 1979 (%) - Multirace
Year householder moved into unit - Moved in 1970 to 1979 (%) - Other Race
Year householder moved into unit - Moved in 1969 or earlier (%)
Year householder moved into unit - Moved in 1969 or earlier (%) - White
Year householder moved into unit - Moved in 1969 or earlier (%) - Black or African American
Year householder moved into unit - Moved in 1969 or earlier (%) - Asian
Year householder moved into unit - Moved in 1969 or earlier (%) - Hispanic or Latino
Year householder moved into unit - Moved in 1969 or earlier (%) - American Indian and Alaska Native
Year householder moved into unit - Moved in 1969 or earlier (%) - Multirace
Year householder moved into unit - Moved in 1969 or earlier (%) - Other Race
Housing units lacking complete plumbing facilities (%)
Housing units lacking complete kitchen facilities (%)
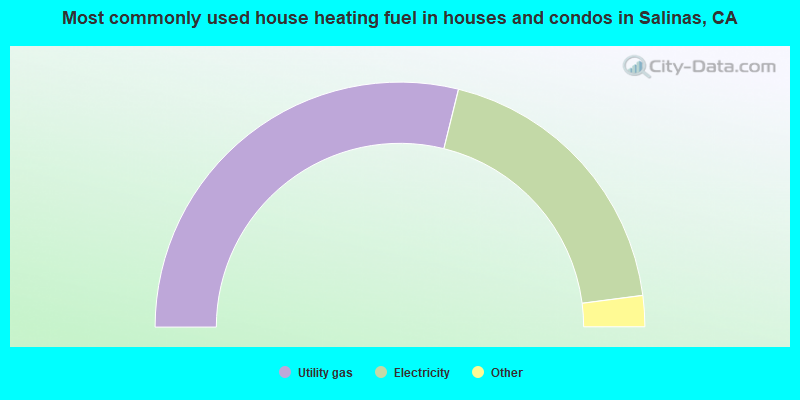
House heating fuel used in houses and condos - Utility gas (%)
House heating fuel used in houses and condos - Bottled, tank, or LP gas (%)
House heating fuel used in houses and condos - Electricity (%)
House heating fuel used in houses and condos - Fuel oil, kerosene, etc. (%)
House heating fuel used in houses and condos - Coal or coke (%)
House heating fuel used in houses and condos - Wood (%)
House heating fuel used in houses and condos - Solar energy (%)
House heating fuel used in houses and condos - Other fuel (%)
House heating fuel used in houses and condos - No fuel used (%)
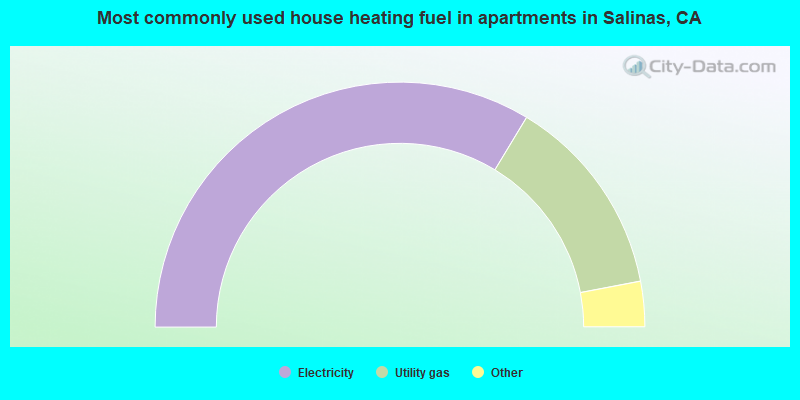
House heating fuel used in apartments - Utility gas (%)
House heating fuel used in apartments - Bottled, tank, or LP gas (%)
House heating fuel used in apartments - Electricity (%)
House heating fuel used in apartments - Fuel oil, kerosene, etc. (%)
House heating fuel used in apartments - Coal or coke (%)
House heating fuel used in apartments - Wood (%)
House heating fuel used in apartments - Solar energy (%)
House heating fuel used in apartments - Other fuel (%)
House heating fuel used in apartments - No fuel used (%)
Latest news about housing in Salinas, CA collected exclusively by city-data.com from local newspapers, TV, and radio stations
Median year house/condo built: 1977Median year apartment built: 1980Household type by relationship:
Households: 161,019
Male householders: 20,936 (3,237 living alone ), Female householders: 24,879 (5,023 living alone )22,117 spouses (21,301 opposite-sex spouses ), 5,179 unmarried partners , (5,179 opposite-sex unmarried partners ), 57,356 children (54,988 natural , 296 adopted , 2,072 stepchildren ), 6,255 grandchildren , 2,549 brothers or sisters , 5,064 parents , 67 foster children , 7,517 other relatives , 6,641 non-relatives In group quarters: 2,459
Size of family households: 7,636 2-persons , 6,045 3-persons , 9,655 4-persons , 6,199 5-persons , 2,742 6-persons , 3,064 7-or-more-persons .
Size of nonfamily households: 8,260 1-person , 2,038 2-persons , 51 3-persons , 80 6-persons , 45 7-or-more-persons .
21,035 married couples with children. single-parent households (4,343 men , 10,346 women ).
27.2% of residents of Salinas speak English at home. of residents speak Spanish at home (48% speak English very well , 15% speak English well , 16% speak English not well , 22% don't speak English at all ).of residents speak other Indo-European language at home (75% speak English very well , 14% speak English well , 10% speak English not well , 1% don't speak English at all ).of residents speak Asian or Pacific Island language at home (56% speak English very well , 26% speak English well , 18% speak English not well ).of residents speak other language at home (46% speak English very well , 23% speak English well , 17% speak English not well , 13% don't speak English at all ).
Foreign born population: 60,751 (37.7%)of them are naturalized citizens )
Median number of rooms in houses and condos:
Median number of rooms in apartments
Owner-occupied Renter-occupied
Bedrooms in owner-occupied houses and condos in Salinas, California
130 no bedroom 410 1 bedroom 3,489 2 bedrooms 10,173 3 bedrooms 5,364 4 bedrooms 1,010 5+ bedrooms
Bedrooms in renter-occupied apartments in Salinas, California
2,106 no bedroom 5,846 1 bedroom 9,108 2 bedrooms 6,500 3 bedrooms 1,566 4 bedrooms 113 5+ bedrooms
Owner-occupied Renter-occupied
Cars and other vehicles available in Salinas in owner-occupied houses/condos
1,249 no vehicle 2,917 1 vehicle 6,616 2 vehicles 4,950 3 vehicles 3,623 4 vehicles 1,221 5+ vehicles
Cars and other vehicles available in Salinas in renter-occupied apartments
2,774 no vehicle 7,170 1 vehicle 9,241 2 vehicles 3,512 3 vehicles 2,092 4 vehicles 450 5+ vehicles
Owner-occupied Renter-occupied
Rooms in owner-occupied houses in Salinas, California
90 1 room 183 2 rooms 620 3 rooms 3,367 4 rooms 5,328 5 rooms 5,128 6 rooms 2,187 7 rooms 2,027 8 rooms 1,646 9+ rooms
Rooms in renter-occupied apartments in Salinas, California
2,028 1 room 1,378 2 rooms 5,047 3 rooms 8,552 4 rooms 5,190 5 rooms 2,135 6 rooms 584 7 rooms 207 8 rooms 118 9+ rooms
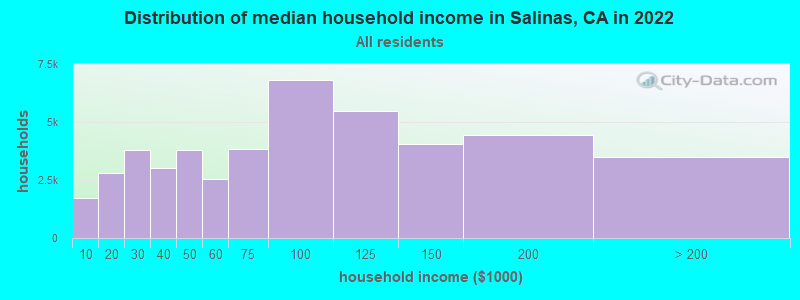
Salinas, CA household income distribution 1,729 Less than $10,0002,812 $10,000 to $19,9993,793 $20,000 to $29,9993,030 $30,000 to $39,9993,808 $40,000 to $49,9992,538 $50,000 to $59,9993,846 $60,000 to $74,9996,828 $75,000 to $99,9995,474 $100,000 to $124,9994,040 $125,000 to $149,9994,443 $150,000 to $199,9993,474 $200,000 or more
Home value of owner - occupied houses in 2022 in Salinas, CA 300 Less than $10,0006 $20,000 to $24,99919 $25,000 to $29,99918 $30,000 to $34,99946 $35,000 to $39,999121 $40,000 to $49,999172 $50,000 to $59,99949 $60,000 to $69,99982 $70,000 to $79,99998 $80,000 to $89,99916 $90,000 to $99,999204 $100,000 to $124,999172 $125,000 to $149,999258 $150,000 to $174,99929 $175,000 to $199,999337 $200,000 to $249,999140 $250,000 to $299,9991,091 $300,000 to $399,9992,442 $400,000 to $499,9999,529 $500,000 to $749,9993,294 $750,000 to $999,99993 $1,000,000 to $1,499,99934 $1,500,000 to $1,999,999384 $2,000,000 or moreRent paid by renters in 2022 in Salinas, CA 128 Less than $100223 $150 to $19984 $200 to $249128 $250 to $29996 $300 to $349724 $350 to $399167 $400 to $449133 $450 to $499420 $500 to $549298 $600 to $649264 $700 to $749145 $750 to $799457 $800 to $899376 $900 to $9991,908 $1,000 to $1,2492,793 $1,250 to $1,4999,597 $1,500 to $1,9994,926 $2,000 to $2,499875 $2,500 to $2,999881 $3,000 to $3,499252 $3,500 or more364 No cash rent
Percentage of workers working in this county: 86.5%Number of people working at home: 3,384 (5.0% of all workers )
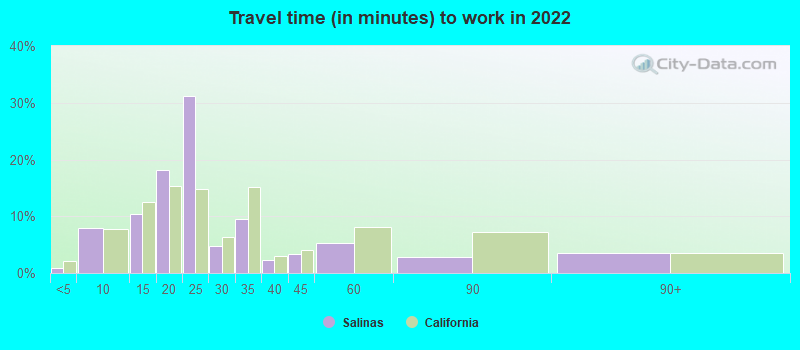
Travel time to work (commute)
Less than 5 minutes: 5785 to 9 minutes: 4,43110 to 14 minutes: 4,65415 to 19 minutes: 8,29420 to 24 minutes: 21,85825 to 29 minutes: 1,99030 to 34 minutes: 4,98535 to 39 minutes: 2,13940 to 44 minutes: 6,21745 to 59 minutes: 4,57960 to 89 minutes: 2,19190 or more minutes: 2,443
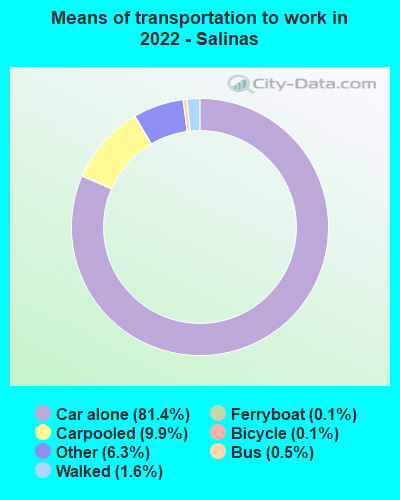
Means of transportation to work:
Drove a car alone: 38,189 (75.0%)Carpooled: 4,197 (8.2%)Bus : 452 (0.9%)Subway or elevated rail : 10 (0.0%)Ferryboat: 58 (0.1%)Taxi: 2,317 (4.6%)Bicycle: 94 (0.2%)Walked: 902 (1.8%)Worked at home: 3,401 (6.7%)
Unemployment by race in 2022
Unemployment rate for White non-Hispanic residents 3.9% Males2.8% FemalesUnemployment rate for Black residents 1.4% Males17.8% FemalesUnemployment rate for American Indian and Alaska Native residents 16.2% Males6.0% FemalesUnemployment rate for Asian residents 3.8% FemalesUnemployment rate for other race residents 4.2% Males6.1% FemalesUnemployment rate for two or more race residents 3.8% Males1.3% FemalesUnemployment rate for Hispanic or Latino residents 4.0% Males5.3% Females
Year of entry for the foreign-born population in Salinas, California
15,250 2010 or later 15,856 2000 to 2009 12,940 1990 to 1999 15,349 1980 to 1989 9,540 1970 to 1979 5,513 Before 1970
First ancestries reported:
English: 1,596 (1.4%)
American: 1,466 (1.3%)
Italian: 1,077 (0.9%)
German: 830 (0.7%)
Portuguese: 677 (0.6%)
Irish: 648 (0.6%)
European: 343 (0.3%)
Dutch: 210 (0.2%)
Russian: 209 (0.2%)
Norwegian: 189 (0.2%)
Eastern European: 135 (0.1%)
French: 122 (0.1%)
Brazilian: 118 (0.1%)
African: 111 (0.09%)
Scottish: 111 (0.09%)
Polish: 98 (0.08%)
Iranian: 96 (0.08%)
Scandinavian: 64 (0.05%)
Swiss: 60 (0.05%)
Swedish: 54 (0.05%)
French Canadian: 53 (0.05%)
Romanian: 43 (0.04%)
Scotch-Irish: 32 (0.03%)
British: 24 (0.02%)
Assyrian: 22 (0.02%)
Syrian: 21 (0.02%)
Belizean: 21 (0.02%)
Northern European: 20 (0.02%)
Arab: 19 (0.02%)
Finnish: 14 (0.01%)
Luxembourger: 14 (0.01%)
South African: 14 (0.01%)
Czech: 13 (0.01%)
Welsh: 12 (0.01%)
Basque: 10 (0.01%)
Celtic: 8 (0.01%)
Moroccan: 8 (0.01%)
Australian: 7 (0.01%)
Somali: 7 (0.01%)
Egyptian: 7 (0.01%)
Greek: 7 (0.01%)
Bulgarian: 6 (0.01%) Most common places of birth for foreign-born residents (%): Mexico Salinas:
81.5% (48,307)California:
37.2% (3,881,193)
El Salvador Salinas:
5.2% (3,064)California:
4.2% (440,287)
Philippines Salinas:
4.3% (2,571)California:
7.8% (818,297)
Place of birth for U.S.-born residents:
This state: 88,649Other state: 9,453Northeast: 1,597Midwest: 1,779South: 3,877West: 2,200 90.2% of Salinas residents lived in the same house 1 years ago.
Out of people who lived in different houses, 42.8% lived in this county.
Out of people who lived in different counties, 77.5% lived in California.
Salinas:
90.2%State average:
88.9%
Education attainment for males 25 years and older:
No schooling: 4,244Nursery to 4th grade: 1,6105th and 6th grade: 5,9547th and 8th grade: 1,0049th grade: 3,81310th grade: 78411th grade: 2,73412th grade, no diploma: 1,878High school graduate (or equivalency): 11,743Less than 1 year of college: 2,367Some college more than 1 year, no degree: 4,779Associate degree: 2,397Bachelor's degree: 5,031Master's degree: 1,178Professional school degree: 311Doctorate degree: 306
Education attainment for females 25 years and older:
No schooling: 4,751Nursery to 4th grade: 1,3315th and 6th grade: 5,5037th and 8th grade: 1,1839th grade: 3,02210th grade: 41011th grade: 1,06612th grade, no diploma: 1,733High school graduate (or equivalency): 11,559Less than 1 year of college: 3,310Some college more than 1 year, no degree: 5,775Associate degree: 3,864Bachelor's degree: 5,682Master's degree: 704Professional school degree: 335Doctorate degree: 0
Housing units in structures:
One, detached: 25,937One, attached: 2,670Two: 1,0403 or 4: 3,8275 to 9: 3,99910 to 19: 3,70520 to 49: 2,29150 or more: 1,574Mobile homes: 2,419Boats, RVs, vans, etc.: 219Median worth of mobile homes: $158,500
Housing units lacking complete plumbing facilities in 2022: 0.8%Housing units lacking complete kitchen facilities in 2022: 1.0%House/condo owner moved in on average 15 years ago
Renter moved in on average 4 years ago
Private vs. public school enrollment:
Students in private schools in grades 1 to 8 (elementary and middle school): 120 Here:
0.6%California:
10.5%
Students in private schools in grades 9 to 12 (high school): 214 Students in private undergraduate colleges: 279 Here:
3.8%California:
15.9%