Valley Center, CA (California) Houses and Residents
| Valley Center: | $882,206 |
| California: | $715,900 |
Mean price in 2022:
Detached houses: $886,491
Here: $886,491 State: $988,808 Mobile homes: $165,383
Here: $165,383 State: $184,506
Total population: 9,277 (Urban population: 0, Rural population: 7,213 (958 farm, 6,255 nonfarm))
Houses: 3,379 (3,163 occupied: 2,708 owner occupied, 475 renter occupied)
| % of renters here: | 15% |
| State: | 44% |
Housing density: 115 houses/condos per square mile
Median price asked for vacant for-sale houses and condos in 2022: $10,012,195.
Median contract rent in 2022: $1,170 (lower quartile is $1,053, upper quartile is $1,621)
Median rent asked for vacant for-rent units in 2022: $4,272
Median gross rent in Valley Center, CA in 2022: $1,223
Housing units in Valley Center with a mortgage: 1,922 (214 second mortgage, 0 home equity loan, 222 both second mortgage and home equity loan)
Houses without a mortgage: 40
Median household income for houses/condos with a mortgage: $124,597
Median household income for apartments without a mortgage: $88,137
Median monthly housing costs: $2,438
Compare current foreclosures near Valley Center, CA:
| Photo | Address | Area | Beds / Baths | Price | Details |
|---|---|---|---|---|---|

|
#1
Palomar Vista Dr
Valley Center, CA 92082
|
3,154 sq. feet
|
3 baths 3 beds |
show details | |

|
#2
Queensbridge Rd
Valley Center, CA 92082
|
2,325 sq. feet
|
3 baths 4 beds |
show details | |

|
#3
Engelmann Rd
Valley Center, CA 92082
|
3,487 sq. feet
|
3 baths 4 beds |
show details | |

|
#4
Queensbridge Rd
Valley Center, CA 92082
|
6,691 sq. feet
|
7 baths 7 beds |
show details | |

|
#5
Calle De Encinas
Valley Center, CA 92082
|
3,770 sq. feet
|
4 baths 5 beds |
show details | |

|
#6
Dorothy Ln
Valley Center, CA 92082
|
3,107 sq. feet
|
3 baths 3 beds |
show details | |

|
#7
Vernie Vista Ln
Valley Center, CA 92082
|
2,032 sq. feet
|
2 baths 3 beds |
show details | |

|
#8
Valley Center Rd
Valley Center, CA 92082
|
1,128 sq. feet
|
2 baths 2 beds |
show details | |

|
#9
Anthony Rd
Valley Center, CA 92082
|
1,456 sq. feet
|
2 baths 3 beds |
show details | |

|
#10
Lilac Knolls Rd
Valley Center, CA 92082
|
2,004 sq. feet
|
2 baths 3 beds |
show details |
| Photo | Address | Area | Beds / Baths | Price | Details |
|---|---|---|---|---|---|

|
#11
Banbury Dr
Valley Center, CA 92082
|
2,772 sq. feet
|
2 baths 4 beds |
show details | |

|
#12
Valley Center Rd
Valley Center, CA 92082
|
2,042 sq. feet
|
2 baths 3 beds |
show details | |

|
#13
Sage Brush Trl
Valley Center, CA 92082
|
3,960 sq. feet
|
4 baths 5 beds |
show details | |

|
#14
Rolling Hills Dr
Valley Center, CA 92082
|
2,368 sq. feet
|
2 baths 3 beds |
show details | |

|
#15
Mcnally Rd
Valley Center, CA 92082
|
2,521 sq. feet
|
2 baths 3 beds |
show details | |

|
#16
Villa Sierra Rd
Valley Center, CA 92082
|
2,432 sq. feet
|
2 baths 3 beds |
show details | |

|
#17
W Lilac Rd
Valley Center, CA 92082
|
1,376 sq. feet
|
2 baths 2 beds |
show details | |

|
#18
Gordon Hill Rd
Valley Center, CA 92082
|
- sq. feet
|
- baths - beds |
show details | |

|
#19
Paradise Mountain Rd Spc 135
Valley Center, CA 92082
|
- sq. feet
|
- baths - beds |
show details | |

|
#20
Lilac Rd
Valley Center, CA 92082
|
- sq. feet
|
- baths - beds |
show details |
| Photo | Address | Area | Beds / Baths | Price | Details |
|---|---|---|---|---|---|

|
#21
Lilac Rd
Valley Center, CA 92082
|
- sq. feet
|
- baths - beds |
show details | |

|
#22
Sunrise Dr E
Vista, CA 92084
|
3,811 sq. feet
|
5 baths 4 beds |
show details | |

|
#23
Arrow Wood Ln
Vista, CA 92084
|
2,744 sq. feet
|
4 baths 4 beds |
show details | |

|
#24
Fairview Dr
Vista, CA 92084
|
3,167 sq. feet
|
3 baths 4 beds |
show details | |

|
#25
Luna Way
Bonsall, CA 92003
|
- sq. feet
|
3 baths 4 beds |
show details | |

|
#26
Summerholly Dr
San Marcos, CA 92078
|
1,177 sq. feet
|
3 baths 3 beds |
show details | |

|
#27
Via Oeste Dr
Fallbrook, CA 92028
|
4,650 sq. feet
|
3 baths 5 beds |
show details | |

|
#28
Calle Quinn
Vista, CA 92083
|
2,503 sq. feet
|
3 baths 3 beds |
show details | |

|
#29
Marlin Dr
Vista, CA 92084
|
1,322 sq. feet
|
2 baths 3 beds |
show details | |

|
#30
Cypress Dr
Vista, CA 92084
|
1,803 sq. feet
|
2 baths 3 beds |
show details |
| Photo | Address | Area | Beds / Baths | Price | Details |
|---|---|---|---|---|---|

|
#31
First Light Rd
San Marcos, CA 92078
|
2,499 sq. feet
|
3 baths 3 beds |
show details | |

|
#32
Canonita Dr
Fallbrook, CA 92028
|
4,328 sq. feet
|
4 baths 4 beds |
show details | |

|
#33
Newport Dr
Vista, CA 92084
|
1,657 sq. feet
|
3 baths 4 beds |
show details | |

|
#34
Margie Pl
San Marcos, CA 92078
|
957 sq. feet
|
2 baths 2 beds |
show details | |

|
#35
Prestwick Ct
Vista, CA 92081
|
1,097 sq. feet
|
2 baths 2 beds |
show details | |

|
#36
1st St
San Marcos, CA 92078
|
918 sq. feet
|
1 baths 2 beds |
show details | |

|
#37
Bartlett Dr
Vista, CA 92084
|
792 sq. feet
|
1 baths 2 beds |
show details | |

|
#38
Mapleleaf Dr
Vista, CA 92081
|
1,876 sq. feet
|
2 baths 3 beds |
show details | |

|
#39
Lemonwood Ln
Vista, CA 92081
|
1,701 sq. feet
|
2 baths 2 beds |
show details | |

|
#40
La Habra Dr
San Marcos, CA 92078
|
1,463 sq. feet
|
2 baths 2 beds |
show details |
| Photo | Address | Area | Beds / Baths | Price | Details |
|---|---|---|---|---|---|

|
#41
Arboles Pl
Escondido, CA 92029
|
1,625 sq. feet
|
2 baths 3 beds |
show details | |

|
#42
Su Siempre Pl
Escondido, CA 92025
|
2,339 sq. feet
|
3 baths 3 beds |
show details | |

|
#43
Canyon Rd
Escondido, CA 92025
|
3,229 sq. feet
|
3 baths 3 beds |
show details | |

|
#44
Citracado Pkwy
Escondido, CA 92029
|
- sq. feet
|
2 baths 3 beds |
show details | |

|
#45
Amparo Dr
Escondido, CA 92025
|
4,084 sq. feet
|
4 baths 5 beds |
show details | |

|
#46
Encino Dr
Escondido, CA 92025
|
3,338 sq. feet
|
3 baths 3 beds |
show details | |

|
#47
W 2nd Ave Unit 1109
Escondido, CA 92025
|
1,487 sq. feet
|
3 baths 3 beds |
show details | |

|
#48
Palomar Dr
San Marcos, CA 92069
|
1,515 sq. feet
|
2 baths 4 beds |
show details | |

|
#49
Richland Rd
San Marcos, CA 92069
|
1,580 sq. feet
|
3 baths 3 beds |
show details | |

|
Check over 1 million property listings on Foreclosure.com!
|
browse all offers | |||


 | GET REAL About San Diego Rental and Real Estate Prices (751 replies) |
| San Marcos - land + 2 homes (11 replies) |
| Want to retire on a homestead 10 years from now ...where can I buy an acre now (39 replies) |
| Model Homes tour in SD County (8 replies) |
| Valley Center to Las Cruces NM (12 replies) |
| House in the middle of an Orange Grove (13 replies) |

Median year apartment built: 1978
Household type by relationship:
Households: 10,884- Male householders: 1,603 (129 living alone), Female householders: 1,504 (269 living alone)
1,976 spouses (1,962 opposite-sex spouses), 183 unmarried partners, (183 opposite-sex unmarried partners), 3,252 children (3,099 natural, 70 adopted, 82 stepchildren), 446 grandchildren, 54 brothers or sisters, 117 parents, 0 foster children, 512 other relatives, 1,168 non-relatives
- In group quarters: 63
Size of family households: 900 2-persons, 483 3-persons, 397 4-persons, 322 5-persons, 261 6-persons, 147 7-or-more-persons.
Size of nonfamily households: 410 1-person, 195 2-persons, 24 3-persons, 14 4-persons.
1,306 married couples with children.
407 single-parent households (145 men, 262 women).
74.2% of residents of Valley Center speak English at home.
23.0% of residents speak Spanish at home (75% speak English very well, 13% speak English well, 6% speak English not well, 6% don't speak English at all).
0.9% of residents speak other Indo-European language at home (100% speak English very well).
1.8% of residents speak Asian or Pacific Island language at home (65% speak English very well, 24% speak English well, 11% speak English not well).
Foreign born population: 1,972 (18.1%)
(66.6% of them are naturalized citizens)
| Here: | 6.4 |
| State: | 6.0 |
| Here: | 4.1 |
| State: | 3.9 |

- Bedrooms in owner-occupied houses and condos in Valley Center, California
- 0no bedroom
- 381 bedroom
- 4502 bedrooms
- 1,0393 bedrooms
- 8574 bedrooms
- 3255+ bedrooms

- Bedrooms in renter-occupied apartments in Valley Center, California
- 0no bedroom
- 1481 bedroom
- 1962 bedrooms
- 993 bedrooms
- 334 bedrooms
- 05+ bedrooms

- Cars and other vehicles available in Valley Center in owner-occupied houses/condos
- 0no vehicle
- 2771 vehicle
- 8262 vehicles
- 7043 vehicles
- 2514 vehicles
- 6505+ vehicles

- Cars and other vehicles available in Valley Center in renter-occupied apartments
- 0no vehicle
- 1531 vehicle
- 1972 vehicles
- 823 vehicles
- 54 vehicles
- 395+ vehicles

- Rooms in owner-occupied houses in Valley Center, California
- 01 room
- 02 rooms
- 193 rooms
- 1714 rooms
- 6685 rooms
- 5606 rooms
- 3887 rooms
- 5228 rooms
- 3809+ rooms

- Rooms in renter-occupied apartments in Valley Center, California
- 01 room
- 972 rooms
- 723 rooms
- 1064 rooms
- 465 rooms
- 1196 rooms
- 07 rooms
- 158 rooms
- 199+ rooms


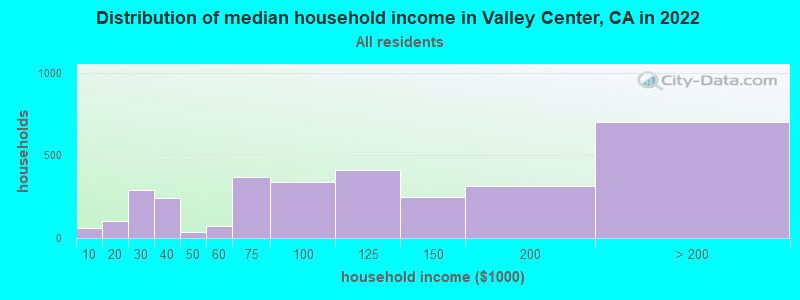
Valley Center, CA household income distribution

- 60Less than $10,000
- 102$10,000 to $19,999
- 292$20,000 to $29,999
- 241$30,000 to $39,999
- 38$40,000 to $49,999
- 74$50,000 to $59,999
- 370$60,000 to $74,999
- 341$75,000 to $99,999
- 412$100,000 to $124,999
- 247$125,000 to $149,999
- 317$150,000 to $199,999
- 703$200,000 or more
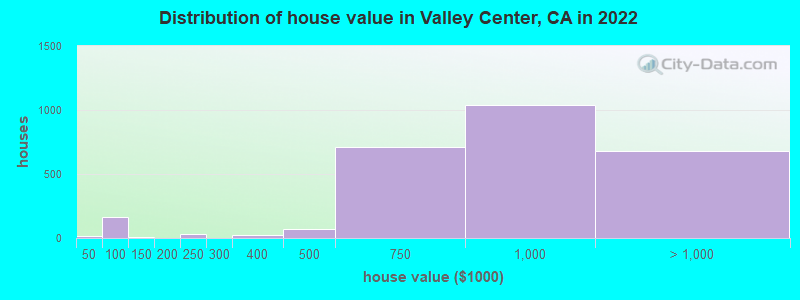
Home value of owner - occupied houses in 2022 in Valley Center, CA
-
- 2Less than $10,000
- 1$20,000 to $24,999
- 9$40,000 to $49,999
- 39$50,000 to $59,999
- 34$60,000 to $69,999
- 1$70,000 to $79,999
- 35$80,000 to $89,999
- 44$90,000 to $99,999
- 5$100,000 to $124,999
- 2$150,000 to $174,999
- 33$200,000 to $249,999
- 0$250,000 to $299,999
- 25$300,000 to $399,999
- 66$400,000 to $499,999
- 708$500,000 to $749,999
- 1,036$750,000 to $999,999
- 576$1,000,000 to $1,499,999
- 88$1,500,000 to $1,999,999
- 14$2,000,000 or more
Rent paid by renters in 2022 in Valley Center, CA
-
- 3$200 to $249
- 1$450 to $499
- 0$550 to $599
- 11$750 to $799
- 33$800 to $899
- 4$900 to $999
- 180$1,000 to $1,249
- 13$1,250 to $1,499
- 17$1,500 to $1,999
- 49$2,000 to $2,499
- 19$2,500 to $2,999
- 144No cash rent


Percentage of workers working in this county: 95.4%
Number of people working at home: 841 (17.8% of all workers)
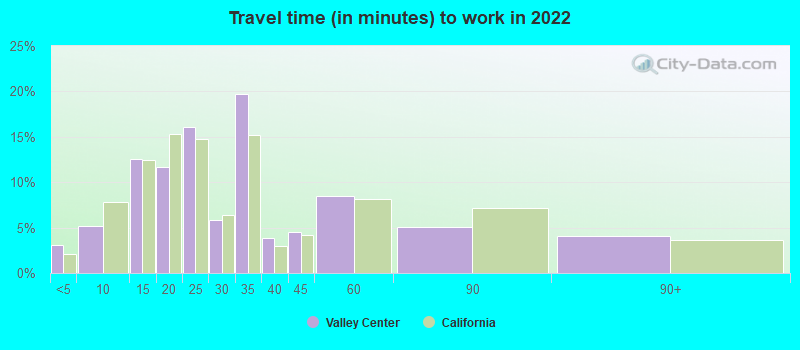
Travel time to work (commute)
- Less than 5 minutes: 96
- 5 to 9 minutes: 145
- 10 to 14 minutes: 315
- 15 to 19 minutes: 358
- 20 to 24 minutes: 206
- 25 to 29 minutes: 105
- 30 to 34 minutes: 1,059
- 35 to 39 minutes: 122
- 40 to 44 minutes: 277
- 45 to 59 minutes: 781
- 60 to 89 minutes: 239
- 90 or more minutes: 91

Means of transportation to work:
- Drove a car alone: 2,465 (70.0%)
- Carpooled: 154 (4.4%)
- Bus: 22 (0.6%)
- Taxi: 17 (0.5%)
- Walked: 58 (1.6%)
- Worked at home: 841 (23.9%)

- Unemployment by race in 2022
- Unemployment rate for White non-Hispanic residents
- 2.0%Males
- 3.1%Females
- Unemployment rate for Black residents
- 13.8%Males
- Unemployment rate for American Indian and Alaska Native residents
- 2.2%Males
- Unemployment rate for two or more race residents
- 2.5%Males
- Unemployment rate for Hispanic or Latino residents
- 0.2%Males

- Year of entry for the foreign-born population in Valley Center, California
- 3872010 or later
- 5432000 to 2009
- 2471990 to 1999
- 2301980 to 1989
- 2251970 to 1979
- 146Before 1970

First ancestries reported:
- English: 465 (6.9%)
- German: 434 (6.4%)
- American: 384 (5.7%)
- Irish: 344 (5.1%)
- Italian: 138 (2.0%)
- Norwegian: 110 (1.6%)
- Russian: 99 (1.5%)
- Danish: 76 (1.1%)
- Swedish: 67 (1.0%)
- French Canadian: 62 (0.9%)
- Polish: 45 (0.7%)
- European: 41 (0.6%)
- Scotch-Irish: 41 (0.6%)
- Scottish: 39 (0.6%)
- British: 34 (0.5%)
- Iranian: 28 (0.4%)
- Greek: 22 (0.3%)
- Hungarian: 21 (0.3%)
- French: 16 (0.2%)
- Welsh: 15 (0.2%)
- Syrian: 13 (0.2%)
- Portuguese: 11 (0.2%)
- Lithuanian: 8 (0.1%)
Most common places of birth for foreign-born residents (%):
| Valley Center: | 66.2% (1,306) |
| California: | 37.2% (3,881,193) |
| Valley Center: | 7.2% (141) |
| California: | 7.8% (818,297) |
| Valley Center: | 5.7% (112) |
| California: | 0.1% (5,330) |
| Valley Center: | 4.8% (94) |
| California: | 0.6% (60,582) |
| Valley Center: | 4.4% (86) |
| California: | 1.2% (127,477) |
| Valley Center: | 2.9% (58) |
| California: | 0.7% (71,932) |
| Valley Center: | 2.1% (42) |
| California: | 6.6% (684,672) |
| Valley Center: | 1.8% (36) |
| California: | 0.0% (3,677) |
| Valley Center: | 1.7% (34) |
| California: | 0.1% (10,538) |
Place of birth for U.S.-born residents:
- This state: 6,357
- Other state: 2,331
- Northeast: 425
- Midwest: 800
- South: 608
- West: 485
92.9% of Valley Center residents lived in the same house 1 years ago.
Out of people who lived in different houses, 45.5% lived in this county.
Out of people who lived in different counties, 76.1% lived in California.
| Valley Center: | 92.9% |
| State average: | 88.9% |
Education attainment for males 25 years and older:
- No schooling: 21
- Nursery to 4th grade: 5
- 5th and 6th grade: 21
- 7th and 8th grade: 37
- 9th grade: 1
- 10th grade: 3
- 11th grade: 34
- 12th grade, no diploma: 198
- High school graduate (or equivalency): 761
- Less than 1 year of college: 524
- Some college more than 1 year, no degree: 732
- Associate degree: 209
- Bachelor's degree: 636
- Master's degree: 181
- Professional school degree: 70
- Doctorate degree: 135

Education attainment for females 25 years and older:
- No schooling: 144
- Nursery to 4th grade: 29
- 5th and 6th grade: 165
- 7th and 8th grade: 47
- 9th grade: 0
- 10th grade: 21
- 11th grade: 94
- 12th grade, no diploma: 105
- High school graduate (or equivalency): 653
- Less than 1 year of college: 250
- Some college more than 1 year, no degree: 552
- Associate degree: 244
- Bachelor's degree: 1,113
- Master's degree: 291
- Professional school degree: 72
- Doctorate degree: 0


Housing units in structures:
- One, detached: 2,981
- One, attached: 101
- 3 or 4: 18
- Mobile homes: 277
- Boats, RVs, vans, etc.: 1
Median worth of mobile homes: $133,908
Housing units lacking complete kitchen facilities in 2022: 0.1%
House/condo owner moved in on average 11 years ago
Renter moved in on average 8 years ago

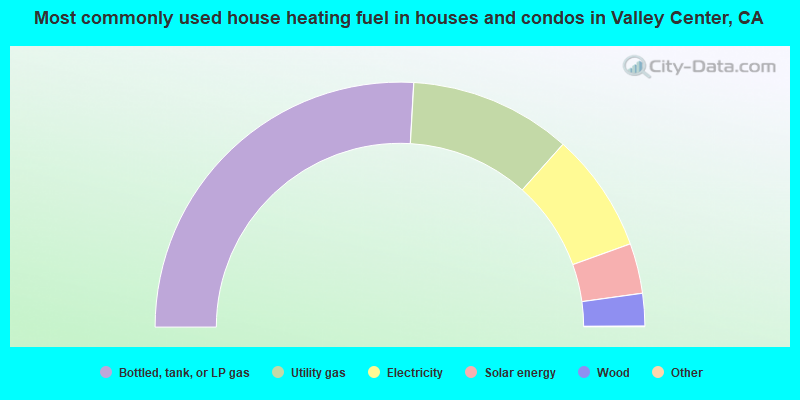
- 51.8%Bottled, tank, or LP gas
- 21.4%Utility gas
- 15.8%Electricity
- 6.6%Solar energy
- 4.3%Wood
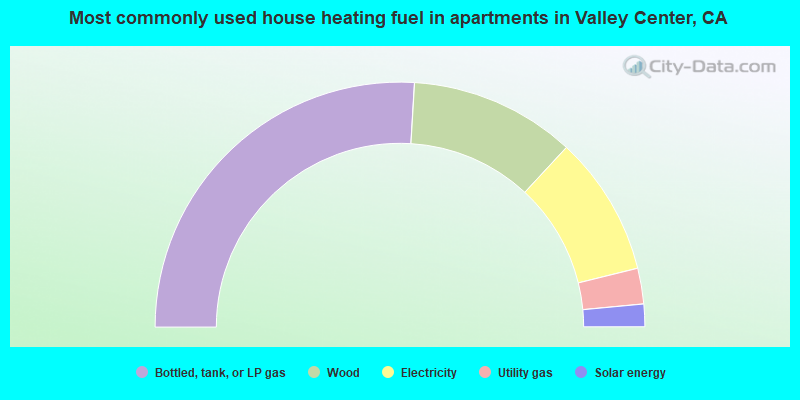
- 51.9%Bottled, tank, or LP gas
- 21.9%Wood
- 18.5%Electricity
- 4.7%Utility gas
- 3.0%Solar energy
Private vs. public school enrollment:
| Here: | 9.0% |
| California: | 10.5% |
| Here: | 7.5% |
| California: | 8.5% |
| Here: | 25.7% |
| California: | 15.9% |


