Cedar Green neighborhood in Cleveland, Santa Fe, Ohio (OH), 44121, 44118, 44122 detailed profile
Settings
X


Business Search - 14 Million verified businesses
Area: 0.958 square miles
Population: 5,061
Population density:
| Cedar Green: | 5,282 people per square mile |
| Cleveland: | 4,662 people per square mile |

- 3,37663.9%White
- 1,17422.2%Black
- 1903.6%Asian
- 1813.4%Some other race
- 1773.3%Hispanic or Latino
- 1412.7%Two or more races
- 460.9%American Indian

Median household income in 2022:
| Cedar Green: | $89,870 |
| Cleveland: | $37,351 |
Distribution of median household income
![Distribution of median household income]()
- 51Less than $10,000
- 211$10,000 to $19,999
- 216$20,000 to $29,999
- 317$30,000 to $39,999
- 248$40,000 to $49,999
- 194$50,000 to $59,999
- 270$60,000 to $74,999
- 165$75,000 to $99,999
- 349$100,000 to $124,999
- 264$125,000 to $149,999
- 199$150,000 to $199,999
- 149$200,000 or more

Distribution of owner-occupied house/condo value
![Distribution of owner-occupied house/condo value]()
- 383Less than $50,000
- 461$50,000 to $99,999
- 620$100,000 to $149,999
- 583$150,000 to $199,999
- 232$200,000 to $249,999
- 241$250,000 to $299,999
- 182$300,000 to $399,999
- 101$400,000 to $499,999
- 37$500,000 to $749,999
- 17$750,000 to $999,999
- 26$1,000,000 or more

Distribution of rent paid by renters
![Distribution of rent paid by renters]()
- 291$200 to $299
- 103$300 to $399
- 98$400 to $499
- 93$500 to $599
- 72$600 to $699
- 252$700 to $799
- 85$800 to $899
- 483$900 to $999
- 245$1,000 to $1,249
- 125$1,250 to $1,499
- 53$1,500 to $1,999
- 409$2,000 or more

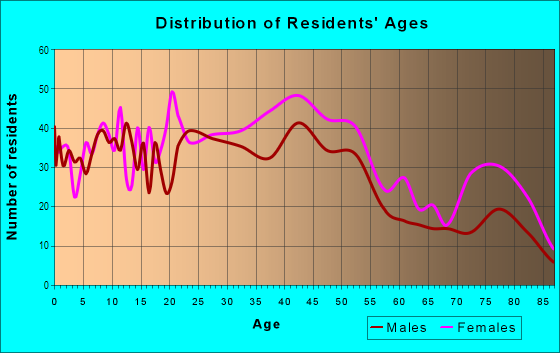
| Males: | 2,239 |
| Females: | 2,821 |
Males:
| This neighborhood: | 38.6 years |
| Whole city: | 35.6 years |
| This neighborhood: | 40.6 years |
| Whole city: | 38.1 years |
Average household size:
| Cedar Green: | 2.1 people |
| Cleveland: | 27.0 people |
Percentage of family households:
| Cedar Green: | 41.5% |
| Cleveland: | 32.3% |
| Here: | 45.1% |
| Cleveland: | 18.6% |
Percentage of married-couple families with children (among all households):
| Cedar Green: | 32.4% |
| Cleveland: | 10.0% |
Percentage of single-mother households (among all households):
| Cedar Green: | 8.1% |
| Cleveland: | 30.3% |
Percentage of never married males 15 years old and over:
Percentage of never married females 15 years old and over:
| Cedar Green: | 15.6% |
| Cleveland: | 27.7% |
Percentage of never married females 15 years old and over:
| Cedar Green: | 21.3% |
| city: | 26.3% |
Percentage of people that speak English not well or not at all:
| Cedar Green: | 0.8% |
| Cleveland: | 2.7% |
Percentage of people born in this state:
Percentage of people born in another U.S. state:
Percentage of native residents but born outside the U.S.:
Percentage of foreign born residents:
| Here: | 70.5% |
| Cleveland: | 71.5% |
Percentage of people born in another U.S. state:
| Cedar Green: | 22.8% |
| Cleveland: | 17.9% |
Percentage of native residents but born outside the U.S.:
| Here: | 1.7% |
| city: | 4.3% |
Percentage of foreign born residents:
| Here: | 5.4% |
| Cleveland: | 6.3% |

Owner-occupied
Renter-occupied


- Rooms in owner-occupied houses and condos in Cedar Green
- 01 room
- 72 rooms
- 303 rooms
- 524 rooms
- 995 rooms
- 2766 rooms
- 3807 rooms
- 3618 rooms
- 5219+ rooms

- Rooms in renter-occupied apartments in Cedar Green
- 791 room
- 482 rooms
- 2633 rooms
- 1794 rooms
- 1765 rooms
- 1126 rooms
- 537 rooms
- 318 rooms
- 389+ rooms
Owner-occupied
Renter-occupied

- Bedrooms in owner-occupied houses and condos in Cedar Green
- 0no bedroom
- 311 bedroom
- 4272 bedrooms
- 9043 bedrooms
- 4554 bedrooms
- 945+ bedrooms

- Bedrooms in renter-occupied apartments in Cedar Green
- 79no bedroom
- 2491 bedroom
- 3322 bedrooms
- 1093 bedrooms
- 944 bedrooms
- 85+ bedrooms
Average number of cars or other vehicles available in houses/condos:
Average number of cars or other vehicles available in apartments:
| This neighborhood: | 1.6 |
| Cleveland: | 1.6 |
Average number of cars or other vehicles available in apartments:
| Here: | 1.6 |
| city: | 1.0 |
Percentage of units with a mortgage:
| Cedar Green: | 60.7% |
| Cleveland: | 50.7% |
Average estimated value of detached houses in 2022 (81.3% of all units):
| Cedar Green: | $176,256 |
| Ohio: | $254,366 |

- Year house built in Cedar Green
- 02020 or later
- 662010 to 2019
- 662000 to 2009
- 981990 to 1999
- 2291980 to 1989
- 2071970 to 1979
- 1621960 to 1969
- 9941950 to 1959
- 2871940 to 1949
- 3081939 or earlier

City-data.com crime index for city in 2020 (higher means more crime):
| City: | 735.3 |
| U.S. average: | 219.5 |
Travel time to work (commute)
![Travel time to work (commute)]()
- 79Less than 5 minutes
- 2935 to 9 minutes
- 23810 to 14 minutes
- 38215 to 19 minutes
- 40620 to 24 minutes
- 24625 to 29 minutes
- 33830 to 34 minutes
- 8835 to 39 minutes
- 4640 to 44 minutes
- 7745 to 59 minutes
- 4160 to 89 minutes
- 790 or more minutes

Means of transportation to work
![Means of transportation to work]()
- 68.4%1,815Drove a car alone
- 14.1%373Carpooled
- 3.5%92Bus
- 4.5%119Subway or elevated rail
- 0.3%9Long-distance train or commuter rail
- 2.8%75Light rail, streetcar or trolley
- 0.5%14Taxi
- 1.6%42Bicycle
- 12.4%330Walked
- 2.3%60Other means
- 12.0%317Worked at home

Time leaving home to go to work
![Time leaving home to go to work]()
- 13112:00 a.m. to 4:59 a.m.
- 155:00 a.m. to 5:29 a.m.
- 595:30 a.m. to 5:59 a.m.
- 916:00 a.m. to 6:29 a.m.
- 1566:30 a.m. to 6:59 a.m.
- 2177:00 a.m. to 7:29 a.m.
- 3337:30 a.m. to 7:59 a.m.
- 4058:00 a.m. to 8:29 a.m.
- 1398:30 a.m. to 8:59 a.m.
- 2789:00 a.m. to 9:59 a.m.
- 6110:00 a.m. to 10:59 a.m.
- 3911:00 a.m. to 11:59 a.m.
- 14112:00 p.m. to 3:59 p.m.
- 2104:00 p.m. to 11:59 p.m.

Occupations of males:
- Percentage of males in management occupations (except farmers):
Here: 16.2% city: 7.3%
- Percentage of males in business and financial operations occupations:
Here: 5.4% city: 4.6%
- Percentage of males in computer and mathematical occupations:
Here: 10.7% city: 3.6%
- Percentage of males in architecture and engineering occupations:
Here: 5.8% city: 1.8%
- Percentage of males in community and social services occupations:
Here: 4.5% city: 1.4%
- Percentage of males in legal occupations:
Here: 1.6% city: 1.2%
- Percentage of males in education, training, and library occupations:
Here: 2.7% city: 2.1%
- Percentage of males in arts, design, entertainment, sports, and media occupations:
Here: 3.0% city: 1.7%
- Percentage of males in healthcare practitioners and technical occupations:
Here: 4.2% city: 3.5%
- Percentage of males in service occupations:
Here: 10.0% city: 20.2%
- Percentage of males in sales and office occupations:
Here: 23.4% city: 14.2%
- Percentage of males in farming, fishing, and forestry occupations:
Here: 4.8% city: 0.3%
- Percentage of males in production occupations:
Here: 1.6% city: 10.8%
- Percentage of males in material moving occupations:
Here: 4.7% city: 9.1%
Occupations of females:
- Percentage of females in management occupations (except farmers):
Here: 17.1% city: 6.9%
- Percentage of females in business and financial operations occupations:
Here: 4.4% city: 5.8%
- Percentage of females in community and social services occupations:
Here: 5.7% city: 2.8%
- Percentage of females in education, training, and library occupations:
Here: 4.6% city: 5.8%
- Percentage of females in arts, design, entertainment, sports, and media occupations:
Here: 1.7% city: 1.2%
- Percentage of females in healthcare practitioners and technical occupations:
Here: 15.0% city: 9.3%
- Percentage of females in service occupations:
Here: 28.6% city: 26.3%
- Percentage of females in sales and office occupations:
Here: 18.0% city: 27.0%
- Percentage of females in material moving occupations:
Here: 2.0% city: 2.6%
Percentage of people 16-64 in Armed Forces:
| Cedar Green: | 0.2% |
| Cleveland: | 0.3% |
Education in this neighborhood (subdivision or community):
- Percentage of people 3 years and older in K-12 schools:
Cedar Green: 21.9% Cleveland: 15.5%
- Percentage of people 3 years and older in undergraduate colleges:
Cedar Green: 22.3% Cleveland: 5.1%
- Percentage of people 3 years and older in grad. or professional schools:
Cedar Green: 5.1% Cleveland: 1.7%
- Percentage of students K-12 enrolled in private schools:
Cedar Green: 53.4% Cleveland: 22.4%
Percentage of population below poverty level:
| Cedar Green: | 11.3% |
| Cleveland: | 31.8% |
Median year owner moved in (as recorded in 2022):
| Cedar Green: | 2006 |
| Cleveland: | 2004 |
Percentage of married-couple families with both working:
| Cedar Green: | 104.7% |
| Cleveland: | 72.0% |

- 75.3%Utility gas
- 14.4%Electricity
- 6.2%Bottled, tank, or LP gas
- 3.1%Other fuel
- 0.9%Coal or coke
Roads and streets:
Cedar Rd
Length: 1.62 miles
Directions: E-W, SW-NE
Address range: 14000 to 23598
Directions: E-W, SW-NE
Address range: 14000 to 23598
Laurel Hill Dr (Langerdale Rd)
Length: 0.60 miles
Directions: E-W, N-S, SE-NW
Address range: 1862 to 2143
Directions: E-W, N-S, SE-NW
Address range: 1862 to 2143
Verona Rd
Length: 0.59 miles
Direction: E-W
Address range: 4080 to 4399
Direction: E-W
Address range: 4080 to 4399
Miramar Blvd
Length: 0.58 miles
Directions: N-S, SE-NW, SW-NE
Address range: 1850 to 2147
Directions: N-S, SE-NW, SW-NE
Address range: 1850 to 2147
Lyndway Rd
Length: 0.57 miles
Directions: N-S, SE-NW
Address range: 1900 to 2149
Directions: N-S, SE-NW
Address range: 1900 to 2149
Wrenford Rd
Length: 0.55 miles
Direction: N-S
Address range: 1843 to 2199
Direction: N-S
Address range: 1843 to 2199
Temblethurst Rd
Length: 0.50 miles
Directions: N-S, SE-NW, SW-NE
Address range: 1850 to 2099
Directions: N-S, SE-NW, SW-NE
Address range: 1850 to 2099
College Rd
Length: 0.47 miles
Direction: E-W
Address range: 4470 to 4630
Direction: E-W
Address range: 4470 to 4630
Birchwold Rd
Length: 0.47 miles
Direction: E-W
Address range: 4400 to 4717
Direction: E-W
Address range: 4400 to 4717
Mackall Rd
Length: 0.47 miles
Direction: E-W
Address range: 4460 to 4719
Direction: E-W
Address range: 4460 to 4719
Greenwold Rd
Length: 0.46 miles
Direction: E-W
Address range: 4475 to 4699
Direction: E-W
Address range: 4475 to 4699
S Green Rd
Length: 0.46 miles
Direction: N-S
Address range: 1900 to 2137
Direction: N-S
Address range: 1900 to 2137
Stilmore Rd
Length: 0.45 miles
Direction: E-W
Address range: 4082 to 4299
Direction: E-W
Address range: 4082 to 4299
Wyncote Rd
Length: 0.42 miles
Direction: E-W
Address range: 4083 to 4259
Direction: E-W
Address range: 4083 to 4259
Wilmington Rd
Length: 0.41 miles
Direction: E-W
Address range: 4086 to 4299
Direction: E-W
Address range: 4086 to 4299
Stonehaven Rd
Length: 0.37 miles
Direction: E-W
Address range: 4101 to 4299
Direction: E-W
Address range: 4101 to 4299
Eastway Rd
Length: 0.37 miles
Direction: E-W
Address range: 4100 to 4299
Direction: E-W
Address range: 4100 to 4299
Acacia Dr
Length: 0.36 miles
Direction: E-W
Address range: 4260 to 4499
Direction: E-W
Address range: 4260 to 4499
Colony Rd
Length: 0.33 miles
Direction: E-W
Address range: 4142 to 4299
Direction: E-W
Address range: 4142 to 4299
S Belvoir Blvd
Length: 0.33 miles
Directions: N-S, SE-NW, SW-NE
Address range: 1913 to 2155
Directions: N-S, SE-NW, SW-NE
Address range: 1913 to 2155
Okalona Rd
Length: 0.33 miles
Direction: E-W
Address range: 4141 to 4299
Direction: E-W
Address range: 4141 to 4299
Campus Rd
Length: 0.29 miles
Direction: N-S
Address range: 1900 to 2125
Direction: N-S
Address range: 1900 to 2125
Division Rd
Length: 0.17 miles
Direction: E-W
Address range: 4500 to 4599
Direction: E-W
Address range: 4500 to 4599
Temblett Ter
Length: 0.16 miles
Direction: E-W
Address range: 4400 to 4499
Direction: E-W
Address range: 4400 to 4499
Milton Rd
Length: 0.12 miles
Directions: E-W, N-S, SE-NW
Address range: 2100 to 2207
Directions: E-W, N-S, SE-NW
Address range: 2100 to 2207
Warrensville Center Rd
Length: 0.12 miles
Direction: N-S
Address range: 2147 to 2200
Direction: N-S
Address range: 2147 to 2200
Kerwin Rd
Length: 0.11 miles
Direction: N-S
Address range: 2160 to 2219
Direction: N-S
Address range: 2160 to 2219
W Claire Dr
Length: 0.09 miles
Direction: E-W
Address range: 4350 to 4401
Direction: E-W
Address range: 4350 to 4401
Fenway Dr
Length: 0.05 miles
Direction: N-S
Address range: 2101 to 2133
Direction: N-S
Address range: 2101 to 2133