Center City neighborhood in Los Angeles, California (CA), 90046 detailed profile
Settings
X

Business Search - 14 Million verified businesses
Area: 0.162 square miles
Population: 1,818
Population density:
| Center City: | 11,189 people per square mile |
| Los Angeles: | 8,148 people per square mile |

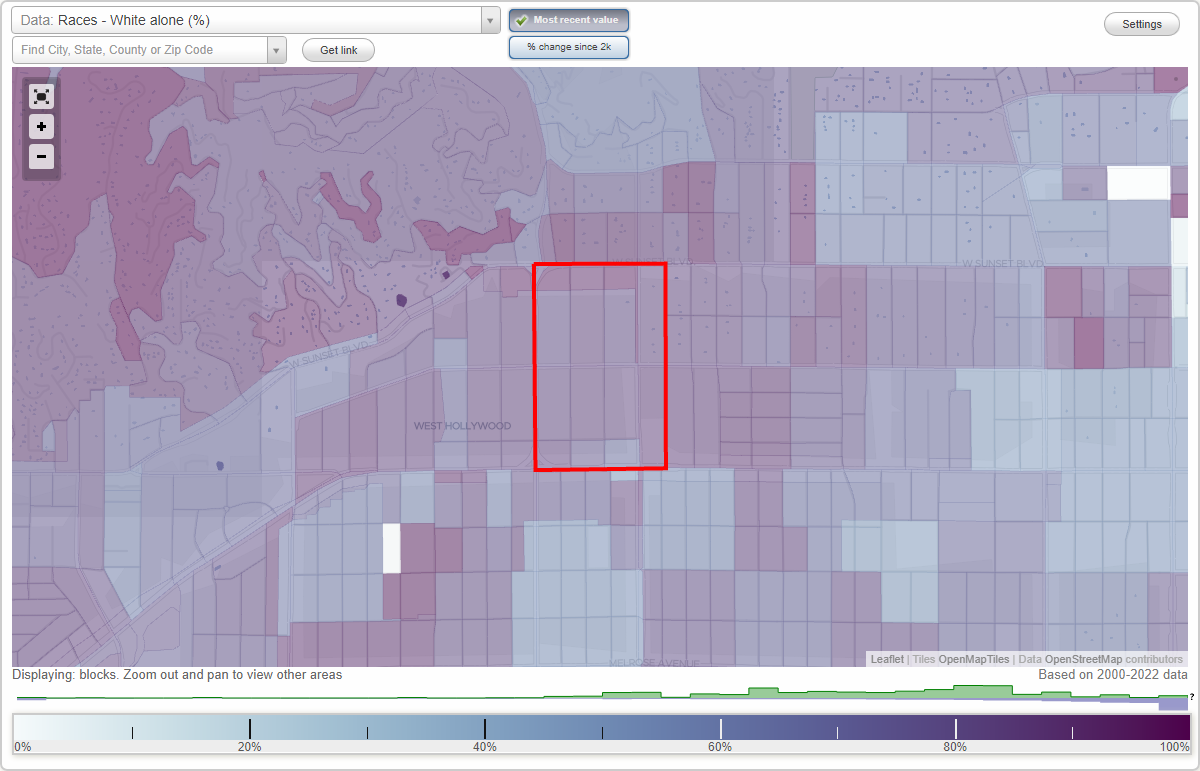
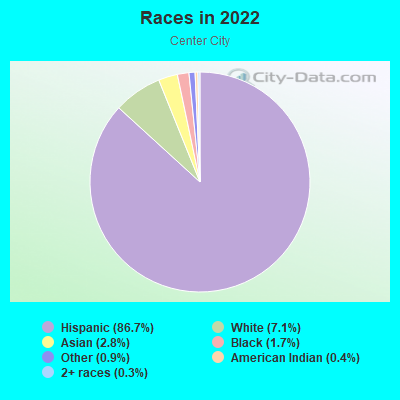
- 1,40952.5%White
- 63523.6%Black
- 1666.2%Hispanic or Latino
- 1575.8%Two or more races
- 1525.7%American Indian
- 1234.6%Asian
- 441.6%Some other race
Distribution of median household income
![Distribution of median household income]()
- 38Less than $10,000
- 148$10,000 to $19,999
- 139$20,000 to $29,999
- 445$30,000 to $39,999
- 377$40,000 to $49,999
- 43$50,000 to $59,999
- 54$60,000 to $74,999
- 240$75,000 to $99,999
- 274$100,000 to $124,999
- 299$125,000 to $149,999
- 78$150,000 to $199,999
- 810$200,000 or more

Distribution of owner-occupied house/condo value
![Distribution of owner-occupied house/condo value]()
- 24Less than $50,000
- 2$300,000 to $399,999
- 32$500,000 to $749,999
- 165$750,000 to $999,999
- 753$1,000,000 or more

Distribution of rent paid by renters
![Distribution of rent paid by renters]()
- 108$200 to $299
- 144$400 to $499
- 171$500 to $599
- 54$700 to $799
- 53$800 to $899
- 38$900 to $999
- 88$1,000 to $1,249
- 164$1,250 to $1,499
- 216$1,500 to $1,999
- 1,132$2,000 or more

Median rent in 2022:
| Center City: | $1,518 |
| Los Angeles: | $1,648 |
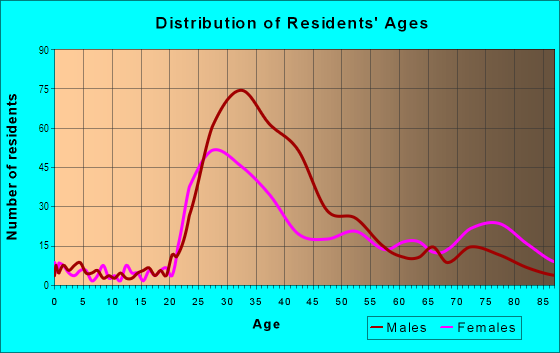
| Males: | 1,046 |
| Females: | 771 |
Males:
| This neighborhood: | 46.0 years |
| Whole city: | 36.5 years |
| This neighborhood: | 43.6 years |
| Whole city: | 37.9 years |
Average household size:
| Center City: | 1.7 people |
| Los Angeles: | 2.6 people |
Percentage of family households:
| Center City: | 21.9% |
| Los Angeles: | 40.1% |
| Here: | 24.1% |
| Los Angeles: | 36.7% |
Percentage of married-couple families with children (among all households):
| Center City: | 53.1% |
| Los Angeles: | 24.3% |
Percentage of single-mother households (among all households):
| Center City: | 7.3% |
| Los Angeles: | 9.9% |
Percentage of never married males 15 years old and over:
Percentage of never married females 15 years old and over:
| Center City: | 35.8% |
| Los Angeles: | 24.7% |
Percentage of never married females 15 years old and over:
| Center City: | 13.8% |
| city: | 22.0% |
Percentage of people that speak English not well or not at all:
| Center City: | 3.7% |
| Los Angeles: | 13.8% |
Percentage of people born in this state:
Percentage of people born in another U.S. state:
Percentage of native residents but born outside the U.S.:
Percentage of foreign born residents:
| Here: | 38.4% |
| Los Angeles: | 46.9% |
Percentage of people born in another U.S. state:
| Center City: | 45.0% |
| Los Angeles: | 15.7% |
Percentage of native residents but born outside the U.S.:
| Here: | 0.2% |
| city: | 1.6% |
Percentage of foreign born residents:
| Here: | 16.5% |
| Los Angeles: | 35.7% |
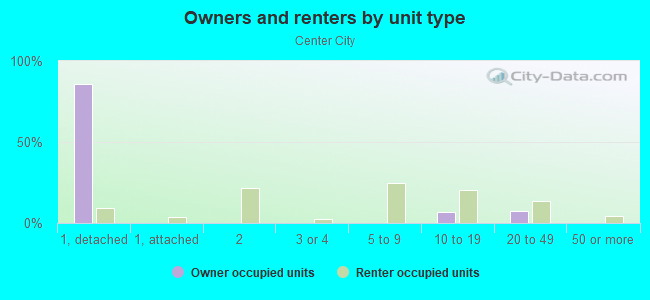
Owner-occupied
Renter-occupied

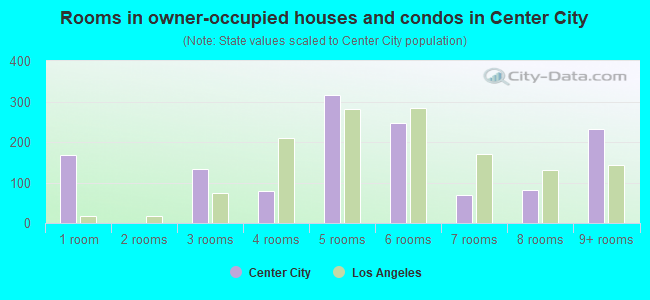
- Rooms in owner-occupied houses and condos in Center City
- 1691 room
- 02 rooms
- 1343 rooms
- 794 rooms
- 3155 rooms
- 2466 rooms
- 697 rooms
- 828 rooms
- 2339+ rooms
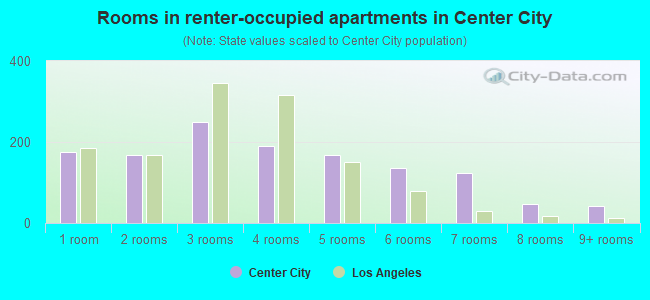
- Rooms in renter-occupied apartments in Center City
- 1751 room
- 1682 rooms
- 2503 rooms
- 1904 rooms
- 1685 rooms
- 1376 rooms
- 1247 rooms
- 488 rooms
- 439+ rooms
Owner-occupied
Renter-occupied
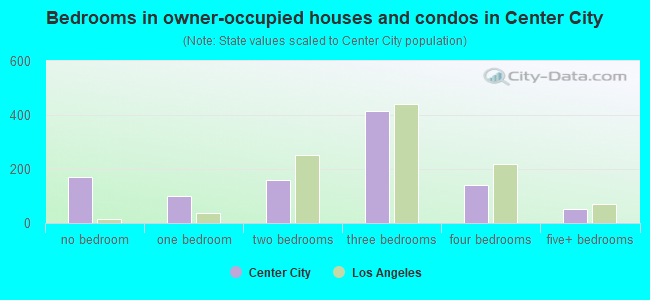
- Bedrooms in owner-occupied houses and condos in Center City
- 169no bedroom
- 991 bedroom
- 1592 bedrooms
- 4153 bedrooms
- 1414 bedrooms
- 535+ bedrooms
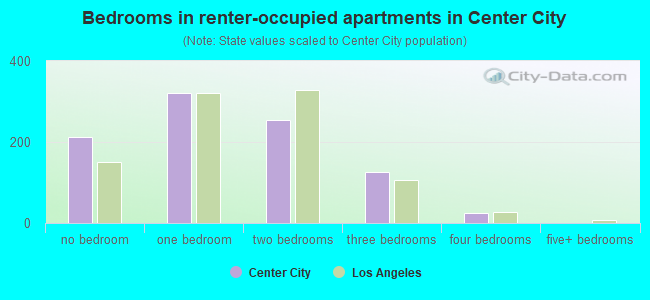
- Bedrooms in renter-occupied apartments in Center City
- 212no bedroom
- 3221 bedroom
- 2552 bedrooms
- 1273 bedrooms
- 244 bedrooms
- 15+ bedrooms
Average number of cars or other vehicles available in houses/condos:
Average number of cars or other vehicles available in apartments:
| This neighborhood: | 4.6 |
| Los Angeles: | 2.1 |
Average number of cars or other vehicles available in apartments:
| Here: | 2.6 |
| city: | 1.3 |
Percentage of units with a mortgage:
| Center City: | 80.7% |
| Los Angeles: | 68.9% |
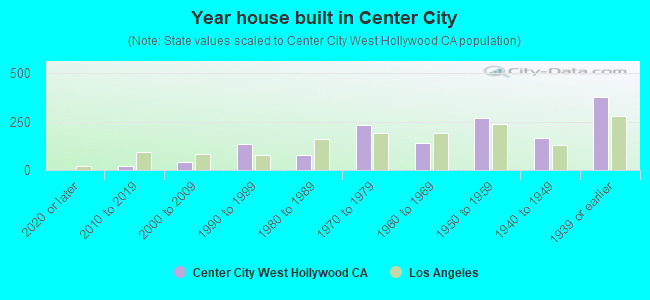
- Year house built in Center City
- 02020 or later
- 232010 to 2019
- 402000 to 2009
- 1351990 to 1999
- 771980 to 1989
- 2351970 to 1979
- 1401960 to 1969
- 2681950 to 1959
- 1631940 to 1949
- 3761939 or earlier
City-data.com crime index for city in 2020 (higher means more crime):
| City: | 327.4 |
| U.S. average: | 219.5 |
Travel time to work (commute)
![Travel time to work (commute)]()
- 87Less than 5 minutes
- 1075 to 9 minutes
- 38710 to 14 minutes
- 17315 to 19 minutes
- 20420 to 24 minutes
- 25225 to 29 minutes
- 84330 to 34 minutes
- 11435 to 39 minutes
- 3040 to 44 minutes
- 12745 to 59 minutes
- 27260 to 89 minutes

Means of transportation to work
![Means of transportation to work]()
- 68.8%787Drove a car alone
- 15.1%173Carpooled
- 16.3%187Bus
- 5.2%59Taxi
- 4.5%51Motorcycle
- 16.2%185Bicycle
- 4.5%51Walked
- 3.5%40Other means
- 19.3%221Worked at home

Time leaving home to go to work
![Time leaving home to go to work]()
- 6612:00 a.m. to 4:59 a.m.
- 115:00 a.m. to 5:29 a.m.
- 475:30 a.m. to 5:59 a.m.
- 626:00 a.m. to 6:29 a.m.
- 536:30 a.m. to 6:59 a.m.
- 4517:00 a.m. to 7:29 a.m.
- 4867:30 a.m. to 7:59 a.m.
- 3768:00 a.m. to 8:29 a.m.
- 2358:30 a.m. to 8:59 a.m.
- 3739:00 a.m. to 9:59 a.m.
- 28010:00 a.m. to 10:59 a.m.
- 11111:00 a.m. to 11:59 a.m.
- 11312:00 p.m. to 3:59 p.m.
- 1954:00 p.m. to 11:59 p.m.

Occupations of males:
- Percentage of males in management occupations (except farmers):
Here: 9.4% city: 10.6%
- Percentage of males in business and financial operations occupations:
Here: 8.0% city: 5.0%
- Percentage of males in life, physical, and social science occupations:
Here: 3.7% city: 0.7%
- Percentage of males in community and social services occupations:
Here: 1.7% city: 1.0%
- Percentage of males in legal occupations:
Here: 5.1% city: 1.8%
- Percentage of males in education, training, and library occupations:
Here: 4.6% city: 3.2%
- Percentage of males in arts, design, entertainment, sports, and media occupations:
Here: 21.1% city: 8.0%
- Percentage of males in healthcare practitioners and technical occupations:
Here: 15.5% city: 2.9%
- Percentage of males in sales and office occupations:
Here: 19.9% city: 15.1%
- Percentage of males in production occupations:
Here: 1.2% city: 5.9%
- Percentage of males in transportation occupations:
Here: 3.8% city: 5.6%
- Percentage of males in material moving occupations:
Here: 4.0% city: 4.4%
Occupations of females:
- Percentage of females in management occupations (except farmers):
Here: 10.1% city: 10.5%
- Percentage of females in business and financial operations occupations:
Here: 34.7% city: 6.5%
- Percentage of females in computer and mathematical occupations:
Here: 3.7% city: 1.5%
- Percentage of females in community and social services occupations:
Here: 4.7% city: 2.3%
- Percentage of females in legal occupations:
Here: 1.7% city: 2.1%
- Percentage of females in education, training, and library occupations:
Here: 4.0% city: 7.1%
- Percentage of females in arts, design, entertainment, sports, and media occupations:
Here: 16.8% city: 6.3%
- Percentage of females in healthcare practitioners and technical occupations:
Here: 3.6% city: 6.5%
- Percentage of females in service occupations:
Here: 11.1% city: 23.6%
- Percentage of females in sales and office occupations:
Here: 9.7% city: 24.7%
- Percentage of females in production occupations:
Here: 9.4% city: 3.5%
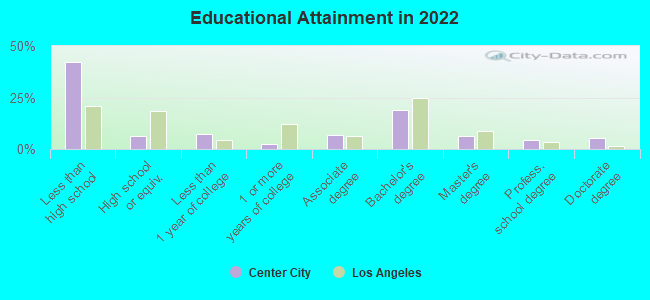
Education in this neighborhood (subdivision or community):
- Percentage of people 3 years and older in K-12 schools:
Center City: 24.4% Los Angeles: 14.4%
- Percentage of people 3 years and older in undergraduate colleges:
Center City: 15.3% Los Angeles: 6.0%
- Percentage of people 3 years and older in grad. or professional schools:
Center City: 5.7% Los Angeles: 2.1%
- Percentage of students K-12 enrolled in private schools:
Center City: 16.9% Los Angeles: 12.1%
Percentage of population below poverty level:
| Center City: | 10.1% |
| Los Angeles: | 16.8% |
Median year renter moved in (as recorded in 2022):
| Center City: | 2015 |
| Los Angeles: | 2018 |
Percentage of married-couple families with both working:
| Center City: | 85.1% |
| Los Angeles: | 63.8% |
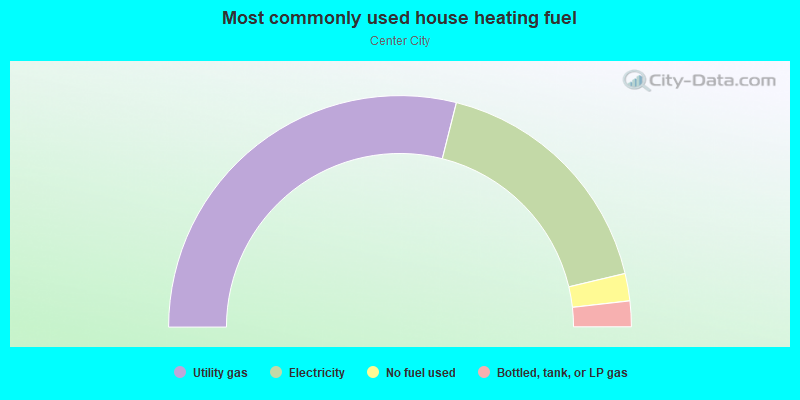
- 57.8%Utility gas
- 34.7%Electricity
- 3.8%No fuel used
- 3.6%Bottled, tank, or LP gas
Highways in this neighborhood:
State Rte 2 (Santa Monica Blvd)
Length: 0.33 miles
Direction: E-W
Address range: 7832 to 8076
Direction: E-W
Address range: 7832 to 8076
W Sunset Blvd (Sunset Blvd)
Length: 0.15 miles
Direction: E-W
Address range: 7946 to 8110
Direction: E-W
Address range: 7946 to 8110
Roads and streets:
N Hayworth Ave
Length: 0.50 miles
Direction: N-S
Address range: 1100 to 1499
Direction: N-S
Address range: 1100 to 1499
N Laurel Ave
Length: 0.50 miles
Direction: N-S
Address range: 1100 to 1499
Direction: N-S
Address range: 1100 to 1499
N Fairfax Ave
Length: 0.46 miles
Direction: N-S
Address range: 1100 to 1494
Direction: N-S
Address range: 1100 to 1494
N Orange Grove Ave
Length: 0.37 miles
Direction: N-S
Address range: 1100 to 1399
Direction: N-S
Address range: 1100 to 1399
Fountain Ave
Length: 0.28 miles
Direction: E-W
Address range: 7850 to 7999
Direction: E-W
Address range: 7850 to 7999
Norton Ave
Length: 0.20 miles
Direction: E-W
Address range: 7900 to 7999
Direction: E-W
Address range: 7900 to 7999