City Center neighborhood in Richmond, California (CA), 94801, 94804 detailed profile
Settings
X


Business Search - 14 Million verified businesses
Area: 0.128 square miles
Population: 2,553
Population density:
| City Center: | 19,947 people per square mile |
| Richmond: | 3,812 people per square mile |

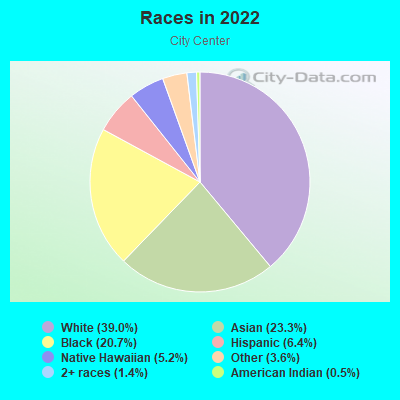
- 1,49254.0%Hispanic or Latino
- 76427.7%Black
- 1906.9%Asian
- 1806.5%White
- 642.3%Native Hawaiian and Other
Pacific Islander - 451.6%Two or more races
- 150.5%Some other race
- 110.4%American Indian
Distribution of median household income
![Distribution of median household income]()
- 120Less than $10,000
- 69$10,000 to $19,999
- 132$20,000 to $29,999
- 182$30,000 to $39,999
- 127$40,000 to $49,999
- 162$50,000 to $59,999
- 95$60,000 to $74,999
- 69$75,000 to $99,999
- 54$100,000 to $124,999
- 87$125,000 to $149,999
- 103$150,000 to $199,999
- 52$200,000 or more

Distribution of owner-occupied house/condo value
![Distribution of owner-occupied house/condo value]()
- 4Less than $50,000
- 79$50,000 to $99,999
- 31$100,000 to $149,999
- 5$150,000 to $199,999
- 11$200,000 to $249,999
- 76$250,000 to $299,999
- 45$300,000 to $399,999
- 127$400,000 to $499,999
- 89$500,000 to $749,999
- 21$750,000 to $999,999

Distribution of rent paid by renters
![Distribution of rent paid by renters]()
- 13$100 to $199
- 102$200 to $299
- 36$300 to $399
- 8$400 to $499
- 13$500 to $599
- 50$600 to $699
- 6$700 to $799
- 18$800 to $899
- 8$900 to $999
- 173$1,000 to $1,249
- 94$1,250 to $1,499
- 81$1,500 to $1,999
- 226$2,000 or more

Median rent in 2022:
| City Center: | $1,314 |
| Richmond: | $1,601 |
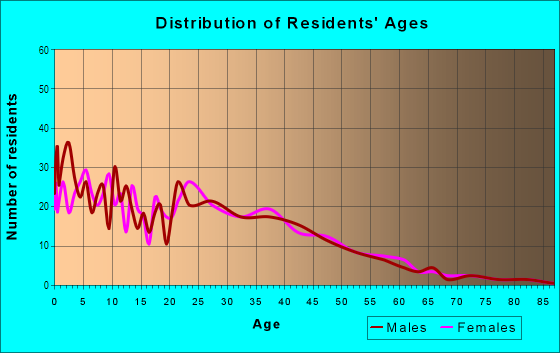
| Males: | 1,298 |
| Females: | 1,255 |
Males:
| This neighborhood: | 30.8 years |
| Whole city: | 35.3 years |
| This neighborhood: | 29.9 years |
| Whole city: | 43.0 years |
Average household size:
| City Center: | 4.0 people |
| Richmond: | 2.8 people |
Percentage of family households:
| City Center: | 57.1% |
| Richmond: | 42.7% |
| Here: | 30.6% |
| Richmond: | 40.5% |
Percentage of married-couple families with children (among all households):
| City Center: | 23.7% |
| Richmond: | 21.6% |
Percentage of single-mother households (among all households):
| City Center: | 11.3% |
| Richmond: | 9.9% |
Percentage of never married males 15 years old and over:
Percentage of never married females 15 years old and over:
| City Center: | 26.5% |
| Richmond: | 25.4% |
Percentage of never married females 15 years old and over:
| City Center: | 24.3% |
| city: | 19.6% |
Percentage of people that speak English not well or not at all:
| City Center: | 27.7% |
| Richmond: | 12.7% |
Percentage of people born in this state:
Percentage of people born in another U.S. state:
Percentage of native residents but born outside the U.S.:
Percentage of foreign born residents:
| Here: | 50.3% |
| Richmond: | 47.4% |
Percentage of people born in another U.S. state:
| City Center: | 8.7% |
| Richmond: | 14.0% |
Percentage of native residents but born outside the U.S.:
| Here: | 1.3% |
| city: | 2.3% |
Percentage of foreign born residents:
| Here: | 39.6% |
| Richmond: | 36.3% |

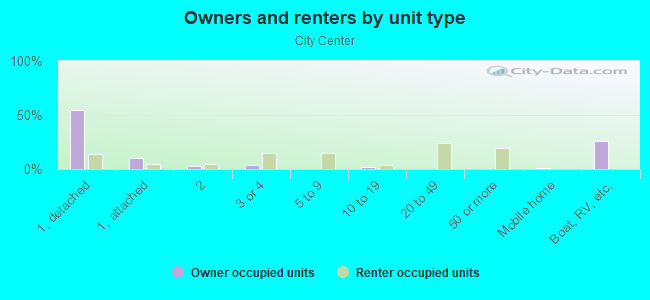
Owner-occupied
Renter-occupied

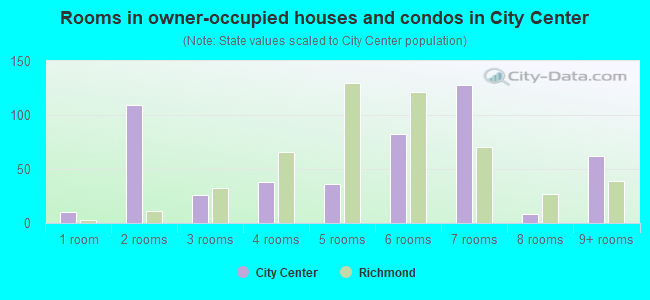
- Rooms in owner-occupied houses and condos in City Center
- 101 room
- 1092 rooms
- 263 rooms
- 384 rooms
- 365 rooms
- 826 rooms
- 1287 rooms
- 88 rooms
- 629+ rooms
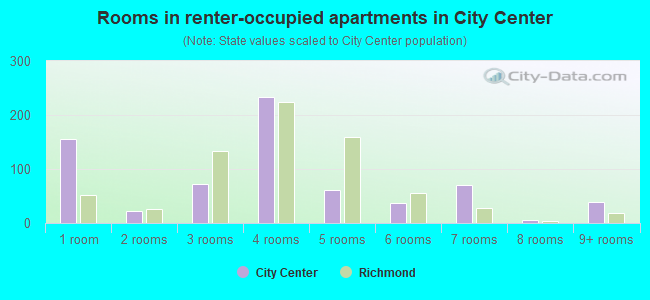
- Rooms in renter-occupied apartments in City Center
- 1561 room
- 232 rooms
- 733 rooms
- 2344 rooms
- 625 rooms
- 376 rooms
- 707 rooms
- 68 rooms
- 399+ rooms
Owner-occupied
Renter-occupied
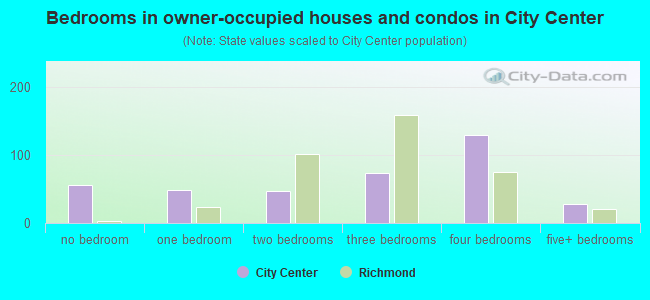
- Bedrooms in owner-occupied houses and condos in City Center
- 56no bedroom
- 491 bedroom
- 472 bedrooms
- 733 bedrooms
- 1304 bedrooms
- 285+ bedrooms
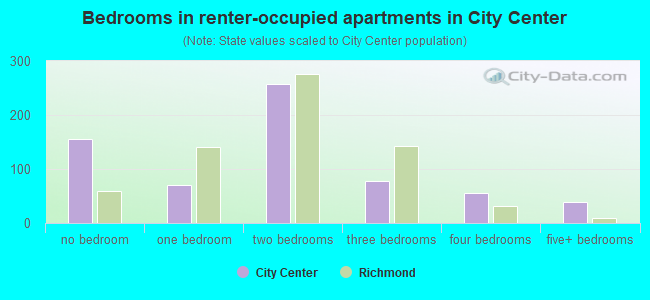
- Bedrooms in renter-occupied apartments in City Center
- 156no bedroom
- 711 bedroom
- 2572 bedrooms
- 783 bedrooms
- 564 bedrooms
- 395+ bedrooms
Average number of cars or other vehicles available in houses/condos:
Average number of cars or other vehicles available in apartments:
| This neighborhood: | 2.6 |
| Richmond: | 2.2 |
Average number of cars or other vehicles available in apartments:
| Here: | 1.2 |
| city: | 1.7 |
Percentage of units with a mortgage:
| City Center: | 73.4% |
| Richmond: | 67.4% |
Average estimated value of detached houses in 2022 (47.6% of all units):
| City Center: | $469,312 |
| Richmond: | $610,033 |
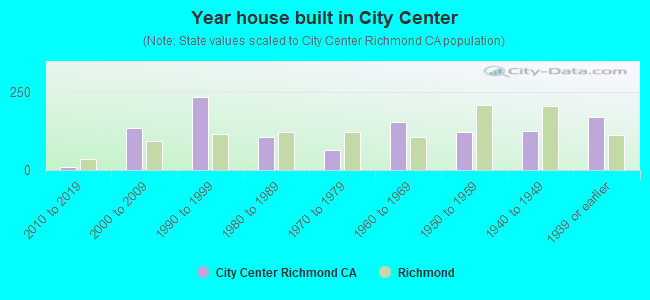
- Year house built in City Center
- 02020 or later
- 92010 to 2019
- 1342000 to 2009
- 2341990 to 1999
- 1071980 to 1989
- 651970 to 1979
- 1541960 to 1969
- 1211950 to 1959
- 1261940 to 1949
- 1721939 or earlier
City-data.com crime index for city in 2020 (higher means more crime):
| City: | 461.7 |
| U.S. average: | 219.5 |
Travel time to work (commute)
![Travel time to work (commute)]()
- 20Less than 5 minutes
- 985 to 9 minutes
- 10010 to 14 minutes
- 9115 to 19 minutes
- 9020 to 24 minutes
- 6625 to 29 minutes
- 12930 to 34 minutes
- 2935 to 39 minutes
- 1540 to 44 minutes
- 8545 to 59 minutes
- 11560 to 89 minutes
- 2990 or more minutes

Means of transportation to work
![Means of transportation to work]()
- 45.6%475Drove a car alone
- 30.3%316Carpooled
- 1.9%20Bus
- 12.8%133Subway or elevated rail
- 0.2%2Long-distance train or commuter rail
- 4.0%42Light rail, streetcar or trolley
- 13.5%141Taxi
- 0.4%4Bicycle
- 0.9%9Walked
- 3.2%33Other means
- 8.3%86Worked at home

Time leaving home to go to work
![Time leaving home to go to work]()
- 5512:00 a.m. to 4:59 a.m.
- 825:00 a.m. to 5:29 a.m.
- 305:30 a.m. to 5:59 a.m.
- 266:00 a.m. to 6:29 a.m.
- 786:30 a.m. to 6:59 a.m.
- 1277:00 a.m. to 7:29 a.m.
- 1237:30 a.m. to 7:59 a.m.
- 468:00 a.m. to 8:29 a.m.
- 308:30 a.m. to 8:59 a.m.
- 349:00 a.m. to 9:59 a.m.
- 4410:00 a.m. to 10:59 a.m.
- 1511:00 a.m. to 11:59 a.m.
- 9412:00 p.m. to 3:59 p.m.
- 404:00 p.m. to 11:59 p.m.

Occupations of males:
- Percentage of males in architecture and engineering occupations:
Here: 3.8% city: 2.9%
- Percentage of males in legal occupations:
Here: 1.5% city: 0.6%
- Percentage of males in education, training, and library occupations:
Here: 2.4% city: 3.6%
- Percentage of males in service occupations:
Here: 23.2% city: 18.4%
- Percentage of males in sales and office occupations:
Here: 2.9% city: 13.4%
- Percentage of males in construction, extraction, and maintenance occupations:
Here: 43.4% city: 14.7%
- Percentage of males in production occupations:
Here: 1.7% city: 4.8%
- Percentage of males in transportation occupations:
Here: 9.9% city: 8.9%
- Percentage of males in material moving occupations:
Here: 8.1% city: 5.0%
Occupations of females:
- Percentage of females in community and social services occupations:
Here: 7.4% city: 3.3%
- Percentage of females in education, training, and library occupations:
Here: 19.3% city: 8.3%
- Percentage of females in healthcare practitioners and technical occupations:
Here: 1.3% city: 4.9%
- Percentage of females in service occupations:
Here: 27.1% city: 28.3%
- Percentage of females in sales and office occupations:
Here: 22.3% city: 25.4%
- Percentage of females in farming, fishing, and forestry occupations:
Here: 8.1% city: 0.5%
- Percentage of females in production occupations:
Here: 7.7% city: 2.6%
- Percentage of females in transportation occupations:
Here: 5.5% city: 1.9%
- Percentage of females in material moving occupations:
Here: 5.7% city: 3.0%
Percentage of people 16-64 in Armed Forces:
| City Center: | 0.0% |
| Richmond: | 0.2% |
Education in this neighborhood (subdivision or community):
- Percentage of people 3 years and older in K-12 schools:
City Center: 28.8% Richmond: 17.8%
- Percentage of people 3 years and older in undergraduate colleges:
City Center: 14.5% Richmond: 4.5%
- Percentage of people 3 years and older in grad. or professional schools:
City Center: 4.8% Richmond: 0.8%
- Percentage of students K-12 enrolled in private schools:
City Center: 18.4% Richmond: 7.3%
Percentage of population below poverty level:
| City Center: | 22.5% |
| Richmond: | 16.2% |
Median year owner moved in (as recorded in 2022):
Median year renter moved in (as recorded in 2022):
| City Center: | 2006 |
| Richmond: | 2006 |
Median year renter moved in (as recorded in 2022):
| City Center: | 2014 |
| Richmond: | 2016 |
Percentage of married-couple families with both working:
| City Center: | 95.9% |
| Richmond: | 68.0% |
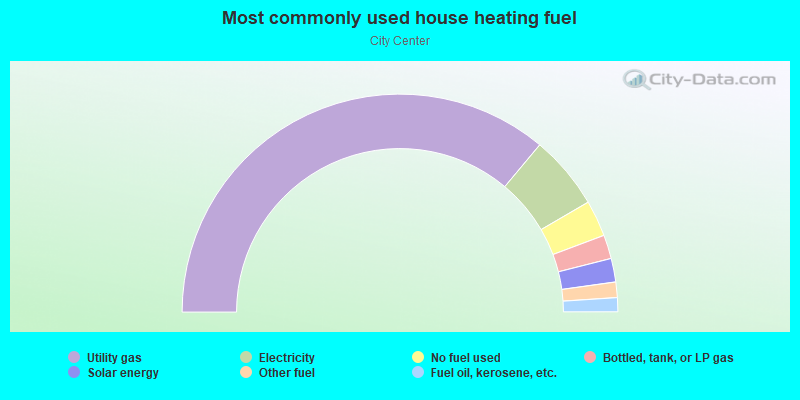
- 72.1%Utility gas
- 11.0%Electricity
- 5.4%No fuel used
- 3.5%Bottled, tank, or LP gas
- 3.5%Solar energy
- 2.3%Other fuel
- 2.1%Fuel oil, kerosene, etc.
Roads and streets:
Ohio Ave
Length: 0.49 miles
Direction: E-W
Address range: 1500 to 2281
Direction: E-W
Address range: 1500 to 2281
Chanslor Ave
Length: 0.44 miles
Directions: E-W, SW-NE
Address range: 1500 to 2199
Directions: E-W, SW-NE
Address range: 1500 to 2199
Espee Ave
Length: 0.35 miles
Directions: E-W, SE-NW
Address range: 1 to 299
Directions: E-W, SE-NW
Address range: 1 to 299
Bissell Ave
Length: 0.30 miles
Direction: E-W
Address range: 1500 to 1999
Direction: E-W
Address range: 1500 to 1999
16th St
Length: 0.28 miles
Direction: N-S
Address range: 1 to 292
Direction: N-S
Address range: 1 to 292
17th St
Length: 0.27 miles
Direction: N-S
Address range: 1 to 299
Direction: N-S
Address range: 1 to 299
18th St
Length: 0.25 miles
Direction: N-S
Address range: 100 to 299
Direction: N-S
Address range: 100 to 299
15th St
Length: 0.18 miles
Directions: N-S, SW-NE
Address range: 1 to 199
Directions: N-S, SW-NE
Address range: 1 to 199
19th St
Length: 0.18 miles
Direction: N-S
Address range: 1 to 199
Direction: N-S
Address range: 1 to 199
20th St
Length: 0.17 miles
Directions: N-S, SW-NE
Address range: 1 to 199
Directions: N-S, SW-NE
Address range: 1 to 199
Livingston Ln
Length: 0.13 miles
Direction: E-W
Address range: 1600 to 1799
Direction: E-W
Address range: 1600 to 1799
21st St
Length: 0.09 miles
Direction: N-S
Address range: 1 to 99
Direction: N-S
Address range: 1 to 99
Carlson Blvd
Length: 0.06 miles
Direction: SE-NW
Direction: SE-NW
Livingston
Length: 0.05 miles
Direction: E-W
Direction: E-W
22nd St
Length: 0.03 miles
Directions: N-S, SW-NE
Address range: 142 to 161
Directions: N-S, SW-NE
Address range: 142 to 161
Railroad features:
Union Pacific RR
Length: 0.56 miles
Directions: E-W, SE-NW
Directions: E-W, SE-NW
Bay Area Rapid Transit RR
Length: 0.15 miles
Direction: SE-NW
Direction: SE-NW
Other features:
Trl
Length: 0.01 miles
Directions: E-W, SW-NE
Directions: E-W, SW-NE