Pacific Village neighborhood in Huntington Park, California (CA), 90255 detailed profile
Settings
X


Business Search - 14 Million verified businesses
Area: 0.187 square miles
Population: 6,537
Population density:
| Pacific Village: | 35,039 people per square mile |
| Huntington Park: | 18,007 people per square mile |

- 6,36195.8%Hispanic or Latino
- 1412.1%White
- 630.9%Asian
- 300.5%Black
- 140.2%American Indian
- 160.2%Some other race
- 160.2%Two or more races

Median household income in 2022:
| Pacific Village: | $44,310 |
| Huntington Park: | $54,073 |
Distribution of median household income
![Distribution of median household income]()
- 94Less than $10,000
- 389$10,000 to $19,999
- 217$20,000 to $29,999
- 343$30,000 to $39,999
- 337$40,000 to $49,999
- 217$50,000 to $59,999
- 142$60,000 to $74,999
- 158$75,000 to $99,999
- 160$100,000 to $124,999
- 100$125,000 to $149,999
- 118$150,000 to $199,999
- 53$200,000 or more

Distribution of owner-occupied house/condo value
![Distribution of owner-occupied house/condo value]()
- 26Less than $50,000
- 39$150,000 to $199,999
- 77$300,000 to $399,999
- 118$400,000 to $499,999
- 76$500,000 to $749,999
- 159$750,000 to $999,999
- 79$1,000,000 or more

Distribution of rent paid by renters
![Distribution of rent paid by renters]()
- 31Less than $100
- 124$200 to $299
- 351$300 to $399
- 48$400 to $499
- 182$500 to $599
- 85$600 to $699
- 45$700 to $799
- 117$800 to $899
- 128$900 to $999
- 436$1,000 to $1,249
- 543$1,250 to $1,499
- 377$1,500 to $1,999
- 107$2,000 or more

Median rent in 2022:
| Pacific Village: | $1,211 |
| Huntington Park: | $1,259 |
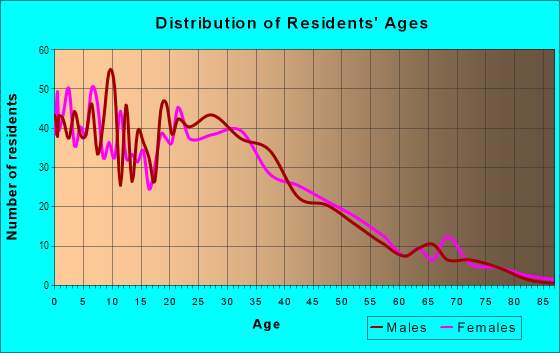
| Males: | 3,241 |
| Females: | 3,295 |
Males:
| This neighborhood: | 33.1 years |
| Whole city: | 32.5 years |
| This neighborhood: | 34.7 years |
| Whole city: | 34.3 years |
Average household size:
| Pacific Village: | 8.7 people |
| Huntington Park: | 3.7 people |
Percentage of family households:
| Pacific Village: | 55.5% |
| Huntington Park: | 60.0% |
| Here: | 50.1% |
| Huntington Park: | 42.7% |
Percentage of married-couple families with children (among all households):
| Pacific Village: | 19.0% |
| Huntington Park: | 14.2% |
Percentage of single-mother households (among all households):
| Pacific Village: | 7.0% |
| Huntington Park: | 9.3% |
Percentage of never married males 15 years old and over:
Percentage of never married females 15 years old and over:
| Pacific Village: | 24.4% |
| Huntington Park: | 27.5% |
Percentage of never married females 15 years old and over:
| Pacific Village: | 21.7% |
| city: | 23.6% |
Percentage of people that speak English not well or not at all:
| Pacific Village: | 29.4% |
| Huntington Park: | 28.7% |
Percentage of people born in this state:
Percentage of people born in another U.S. state:
Percentage of native residents but born outside the U.S.:
Percentage of foreign born residents:
| Here: | 49.5% |
| Huntington Park: | 51.8% |
Percentage of people born in another U.S. state:
| Pacific Village: | 1.3% |
| Huntington Park: | 1.5% |
Percentage of native residents but born outside the U.S.:
| Here: | 0.7% |
| city: | 0.5% |
Percentage of foreign born residents:
| Here: | 48.7% |
| Huntington Park: | 46.2% |

Owner-occupied
Renter-occupied


- Rooms in owner-occupied houses and condos in Pacific Village
- 01 room
- 252 rooms
- 1293 rooms
- 814 rooms
- 685 rooms
- 976 rooms
- 307 rooms
- 2098 rooms
- 2099+ rooms

- Rooms in renter-occupied apartments in Pacific Village
- 3011 room
- 1172 rooms
- 3993 rooms
- 4344 rooms
- 1025 rooms
- 1816 rooms
- 477 rooms
- 598 rooms
- 309+ rooms
Owner-occupied
Renter-occupied

- Bedrooms in owner-occupied houses and condos in Pacific Village
- 0no bedroom
- 251 bedroom
- 1722 bedrooms
- 2103 bedrooms
- 1734 bedrooms
- 1305+ bedrooms

- Bedrooms in renter-occupied apartments in Pacific Village
- 302no bedroom
- 6401 bedroom
- 4332 bedrooms
- 1243 bedrooms
- 434 bedrooms
- 305+ bedrooms
Average number of cars or other vehicles available in houses/condos:
Average number of cars or other vehicles available in apartments:
| This neighborhood: | 2.1 |
| Huntington Park: | 2.4 |
Average number of cars or other vehicles available in apartments:
| Here: | 1.4 |
| city: | 1.5 |
Percentage of units with a mortgage:
| Pacific Village: | 71.6% |
| Huntington Park: | 66.9% |

- Year house built in Pacific Village
- 02020 or later
- 812010 to 2019
- 602000 to 2009
- 1691990 to 1999
- 3061980 to 1989
- 2811970 to 1979
- 1121960 to 1969
- 4141950 to 1959
- 1821940 to 1949
- 4181939 or earlier

City-data.com crime index for city in 2020 (higher means more crime):
| City: | 400.1 |
| U.S. average: | 219.5 |
Travel time to work (commute)
![Travel time to work (commute)]()
- 21Less than 5 minutes
- 825 to 9 minutes
- 20010 to 14 minutes
- 19115 to 19 minutes
- 27920 to 24 minutes
- 11925 to 29 minutes
- 54630 to 34 minutes
- 10135 to 39 minutes
- 11840 to 44 minutes
- 15645 to 59 minutes
- 13860 to 89 minutes
- 3690 or more minutes

Means of transportation to work
![Means of transportation to work]()
- 59.2%1,619Drove a car alone
- 9.9%272Carpooled
- 7.8%214Bus
- 0.5%15Subway or elevated rail
- 1.7%47Taxi
- 1.8%50Motorcycle
- 4.7%129Walked
- 2.0%56Other means
- 17.4%477Worked at home

Time leaving home to go to work
![Time leaving home to go to work]()
- 28012:00 a.m. to 4:59 a.m.
- 1445:00 a.m. to 5:29 a.m.
- 565:30 a.m. to 5:59 a.m.
- 1626:00 a.m. to 6:29 a.m.
- 1796:30 a.m. to 6:59 a.m.
- 2247:00 a.m. to 7:29 a.m.
- 1727:30 a.m. to 7:59 a.m.
- 1368:00 a.m. to 8:29 a.m.
- 928:30 a.m. to 8:59 a.m.
- 329:00 a.m. to 9:59 a.m.
- 6110:00 a.m. to 10:59 a.m.
- 7711:00 a.m. to 11:59 a.m.
- 14412:00 p.m. to 3:59 p.m.
- 2324:00 p.m. to 11:59 p.m.

Occupations of males:
- Percentage of males in management occupations (except farmers):
Here: 6.3% city: 4.4%
- Percentage of males in healthcare practitioners and technical occupations:
Here: 1.7% city: 0.5%
- Percentage of males in service occupations:
Here: 11.3% city: 13.2%
- Percentage of males in sales and office occupations:
Here: 15.2% city: 16.0%
- Percentage of males in farming, fishing, and forestry occupations:
Here: 1.6% city: 0.8%
- Percentage of males in construction, extraction, and maintenance occupations:
Here: 10.4% city: 13.9%
- Percentage of males in production occupations:
Here: 23.4% city: 16.0%
- Percentage of males in transportation occupations:
Here: 11.3% city: 10.3%
- Percentage of males in material moving occupations:
Here: 6.0% city: 11.9%
Occupations of females:
- Percentage of females in management occupations (except farmers):
Here: 2.9% city: 2.9%
- Percentage of females in architecture and engineering occupations:
Here: 1.1% city: 0.3%
- Percentage of females in community and social services occupations:
Here: 5.1% city: 2.8%
- Percentage of females in legal occupations:
Here: 14.9% city: 1.7%
- Percentage of females in education, training, and library occupations:
Here: 4.4% city: 6.2%
- Percentage of females in service occupations:
Here: 20.9% city: 27.1%
- Percentage of females in sales and office occupations:
Here: 35.2% city: 33.4%
- Percentage of females in production occupations:
Here: 6.2% city: 10.3%
- Percentage of females in material moving occupations:
Here: 7.7% city: 7.7%
Education in this neighborhood (subdivision or community):
- Percentage of people 3 years and older in K-12 schools:
Pacific Village: 29.3% Huntington Park: 19.7%
- Percentage of people 3 years and older in undergraduate colleges:
Pacific Village: 6.2% Huntington Park: 7.2%
- Percentage of people 3 years and older in grad. or professional schools:
Pacific Village: 2.2% Huntington Park: 0.7%
- Percentage of students K-12 enrolled in private schools:
Pacific Village: 8.1% Huntington Park: 3.1%
Percentage of population below poverty level:
| Pacific Village: | 20.0% |
| Huntington Park: | 17.9% |
Median year renter moved in (as recorded in 2022):
| Pacific Village: | 2012 |
| Huntington Park: | 2013 |
Percentage of married-couple families with both working:
| Pacific Village: | 57.8% |
| Huntington Park: | 42.8% |

- 40.2%Utility gas
- 33.6%Electricity
- 17.6%No fuel used
- 5.8%Bottled, tank, or LP gas
- 2.9%Other fuel
Roads and streets:
Rugby Ave
Length: 0.74 miles
Direction: N-S
Address range: 6100 to 7127
Direction: N-S
Address range: 6100 to 7127
Rita Ave
Length: 0.73 miles
Direction: N-S
Address range: 6100 to 7125
Direction: N-S
Address range: 6100 to 7125
Seville Ave
Length: 0.59 miles
Direction: N-S
Address range: 6300 to 7117
Direction: N-S
Address range: 6300 to 7117
Pacific Blvd
Length: 0.59 miles
Direction: N-S
Address range: 6100 to 6899
Direction: N-S
Address range: 6100 to 6899
Saturn Ave
Length: 0.28 miles
Direction: E-W
Address range: 2550 to 2699
Direction: E-W
Address range: 2550 to 2699
Randolph St
Length: 0.27 miles
Direction: E-W
Direction: E-W
Zoe Ave
Length: 0.27 miles
Direction: E-W
Address range: 2550 to 2699
Direction: E-W
Address range: 2550 to 2699
E Gage Ave (Gage Ave)
Length: 0.27 miles
Direction: E-W
Address range: 2550 to 2699
Direction: E-W
Address range: 2550 to 2699
Clarendon Ave
Length: 0.27 miles
Direction: E-W
Address range: 2550 to 2699
Direction: E-W
Address range: 2550 to 2699
Park Pl
Length: 0.09 miles
Direction: E-W
Address range: 2600 to 2699
Direction: E-W
Address range: 2600 to 2699
Railroad features:
Southern Pacific RR
Length: 0.27 miles
Direction: E-W
Direction: E-W