Races in Brooklyn, Ohio (OH) Detailed Stats
Data:
Races - White alone (%)
Races - White alone (% change since 2000)
Races - Black alone (%)
Races - Black alone (% change since 2000)
Races - American Indian alone (%)
Races - American Indian alone (% change since 2000)
Races - Asian alone (%)
Races - Asian alone (% change since 2000)
Races - Hispanic (%)
Races - Hispanic (% change since 2000)
Races - Native Hawaiian and Other Pacific Islander alone (%)
Races - Native Hawaiian and Other Pacific Islander alone (% change since 2000)
Races - Two or more races(%)
Races - Two or more races(% change since 2000)
Races - Other race alone (%)
Races - Other race alone (% change since 2000)
Racial diversity
Place of birth - Born in state of residence (%)
Place of birth - Born in state of residence (%) - White
Place of birth - Born in state of residence (%) - Black or African American
Place of birth - Born in state of residence (%) - Asian
Place of birth - Born in state of residence (%) - Hispanic or Latino
Place of birth - Born in state of residence (%) - American Indian and Alaska Native
Place of birth - Born in state of residence (%) - Multirace
Place of birth - Born in state of residence (%) - Other Race
Place of birth - Born in other state (%)
Place of birth - Born in other state (%) - White
Place of birth - Born in other state (%) - Black or African American
Place of birth - Born in other state (%) - Asian
Place of birth - Born in other state (%) - Hispanic or Latino
Place of birth - Born in other state (%) - American Indian and Alaska Native
Place of birth - Born in other state (%) - Multirace
Place of birth - Born in other state (%) - Other Race
Place of birth - Native, outside of US (%)
Place of birth - Native, outside of US (%) - White
Place of birth - Native, outside of US (%) - Black or African American
Place of birth - Native, outside of US (%) - Asian
Place of birth - Native, outside of US (%) - Hispanic or Latino
Place of birth - Native, outside of US (%) - American Indian and Alaska Native
Place of birth - Native, outside of US (%) - Multirace
Place of birth - Native, outside of US (%) - Other Race
Place of birth - Foreign born (%)
Place of birth - Foreign born (%) - White
Place of birth - Foreign born (%) - Black or African American
Place of birth - Foreign born (%) - Asian
Place of birth - Foreign born (%) - Hispanic or Latino
Place of birth - Foreign born (%) - American Indian and Alaska Native
Place of birth - Foreign born (%) - Multirace
Place of birth - Foreign born (%) - Other Race
Residents speaking English at home (%)
Residents speaking English at home - Born in the United States (%)
Residents speaking English at home - Native, born elsewhere (%)
Residents speaking English at home - Foreign born (%)
Residents speaking Spanish at home (%)
Residents speaking Spanish at home - Born in the United States (%)
Residents speaking Spanish at home - Native, born elsewhere (%)
Residents speaking Spanish at home - Foreign born (%)
Residents speaking other language at home (%)
Residents speaking other language at home - Born in the United States (%)
Residents speaking other language at home - Native, born elsewhere (%)
Residents speaking other language at home - Foreign born (%)
Marital status - Never married (%)
Marital status - Now married (%)
Marital status - Separated (%)
Marital status - Widowed (%)
Marital status - Divorced (%)
Ancestries Reported - Arab (%)
Ancestries Reported - Czech (%)
Ancestries Reported - Danish (%)
Ancestries Reported - Dutch (%)
Ancestries Reported - English (%)
Ancestries Reported - French (%)
Ancestries Reported - French Canadian (%)
Ancestries Reported - German (%)
Ancestries Reported - Greek (%)
Ancestries Reported - Hungarian (%)
Ancestries Reported - Irish (%)
Ancestries Reported - Italian (%)
Ancestries Reported - Lithuanian (%)
Ancestries Reported - Norwegian (%)
Ancestries Reported - Polish (%)
Ancestries Reported - Portuguese (%)
Ancestries Reported - Russian (%)
Ancestries Reported - Scotch-Irish (%)
Ancestries Reported - Scottish (%)
Ancestries Reported - Slovak (%)
Ancestries Reported - Subsaharan African (%)
Ancestries Reported - Swedish (%)
Ancestries Reported - Swiss (%)
Ancestries Reported - Ukrainian (%)
Ancestries Reported - United States (%)
Ancestries Reported - Welsh (%)
Ancestries Reported - West Indian (%)
Ancestries Reported - Other (%)
Geographical mobility - Same house 1 year ago (%)
Geographical mobility - Same house 1 year ago (%) - White
Geographical mobility - Same house 1 year ago (%) - Black or African American
Geographical mobility - Same house 1 year ago (%) - Asian
Geographical mobility - Same house 1 year ago (%) - Hispanic or Latino
Geographical mobility - Same house 1 year ago (%) - American Indian and Alaska Native
Geographical mobility - Same house 1 year ago (%) - Multirace
Geographical mobility - Same house 1 year ago (%) - Other Race
Geographical mobility - Moved within same county (%)
Geographical mobility - Moved within same county (%) - White
Geographical mobility - Moved within same county (%) - Black or African American
Geographical mobility - Moved within same county (%) - Asian
Geographical mobility - Moved within same county (%) - Hispanic or Latino
Geographical mobility - Moved within same county (%) - American Indian and Alaska Native
Geographical mobility - Moved within same county (%) - Multirace
Geographical mobility - Moved within same county (%) - Other Race
Geographical mobility - Moved from different county within same state (%)
Geographical mobility - Moved from different county within same state (%) - White
Geographical mobility - Moved from different county within same state (%) - Black or African American
Geographical mobility - Moved from different county within same state (%) - Asian
Geographical mobility - Moved from different county within same state (%) - Hispanic or Latino
Geographical mobility - Moved from different county within same state (%) - American Indian and Alaska Native
Geographical mobility - Moved from different county within same state (%) - Multirace
Geographical mobility - Moved from different county within same state (%) - Other Race
Geographical mobility - Moved from different state (%)
Geographical mobility - Moved from different state (%) - White
Geographical mobility - Moved from different state (%) - Black or African American
Geographical mobility - Moved from different state (%) - Asian
Geographical mobility - Moved from different state (%) - Hispanic or Latino
Geographical mobility - Moved from different state (%) - American Indian and Alaska Native
Geographical mobility - Moved from different state (%) - Multirace
Geographical mobility - Moved from different state (%) - Other Race
Geographical mobility - Moved from abroad (%)
Geographical mobility - Moved from abroad (%) - White
Geographical mobility - Moved from abroad (%) - Black or African American
Geographical mobility - Moved from abroad (%) - Asian
Geographical mobility - Moved from abroad (%) - Hispanic or Latino
Geographical mobility - Moved from abroad (%) - American Indian and Alaska Native
Geographical mobility - Moved from abroad (%) - Multirace
Geographical mobility - Moved from abroad (%) - Other Race
Place of birth for the foreign-born population - Ireland (%)
Place of birth for the foreign-born population - Denmark (%)
Place of birth for the foreign-born population - Norway (%)
Place of birth for the foreign-born population - Sweden (%)
Place of birth for the foreign-born population - United Kingdom (%)
Place of birth for the foreign-born population - England (%)
Place of birth for the foreign-born population - Scotland (%)
Place of birth for the foreign-born population - Other Northern Europe (%)
Place of birth for the foreign-born population - Austria (%)
Place of birth for the foreign-born population - Belgium (%)
Place of birth for the foreign-born population - France (%)
Place of birth for the foreign-born population - Germany (%)
Place of birth for the foreign-born population - Netherlands (%)
Place of birth for the foreign-born population - Switzerland (%)
Place of birth for the foreign-born population - Other Western Europe (%)
Place of birth for the foreign-born population - Greece (%)
Place of birth for the foreign-born population - Italy (%)
Place of birth for the foreign-born population - Portugal (%)
Place of birth for the foreign-born population - Spain (%)
Place of birth for the foreign-born population - Other Southern Europe (%)
Place of birth for the foreign-born population - Albania (%)
Place of birth for the foreign-born population - Belarus (%)
Place of birth for the foreign-born population - Bosnia and Herzegovina (%)
Place of birth for the foreign-born population - Bulgaria (%)
Place of birth for the foreign-born population - Croatia (%)
Place of birth for the foreign-born population - Czechoslovakia (%)
Place of birth for the foreign-born population - Hungary (%)
Place of birth for the foreign-born population - Latvia (%)
Place of birth for the foreign-born population - Lithuania (%)
Place of birth for the foreign-born population - North Macedonia (Macedonia) (%)
Place of birth for the foreign-born population - Moldova (%)
Place of birth for the foreign-born population - Poland (%)
Place of birth for the foreign-born population - Romania (%)
Place of birth for the foreign-born population - Russia (%)
Place of birth for the foreign-born population - Serbia (%)
Place of birth for the foreign-born population - Ukraine (%)
Place of birth for the foreign-born population - Other Eastern Europe (%)
Place of birth for the foreign-born population - China (%)
Place of birth for the foreign-born population - Hong Kong (%)
Place of birth for the foreign-born population - Taiwan (%)
Place of birth for the foreign-born population - Japan (%)
Place of birth for the foreign-born population - Korea (%)
Place of birth for the foreign-born population - Other Eastern Asia (%)
Place of birth for the foreign-born population - Afghanistan (%)
Place of birth for the foreign-born population - Bangladesh (%)
Place of birth for the foreign-born population - India (%)
Place of birth for the foreign-born population - Iran (%)
Place of birth for the foreign-born population - Kazakhstan (%)
Place of birth for the foreign-born population - Nepal (%)
Place of birth for the foreign-born population - Pakistan (%)
Place of birth for the foreign-born population - Sri Lanka (%)
Place of birth for the foreign-born population - Uzbekistan (%)
Place of birth for the foreign-born population - Other South Central Asia (%)
Place of birth for the foreign-born population - Burma (%)
Place of birth for the foreign-born population - Cambodia (%)
Place of birth for the foreign-born population - Indonesia (%)
Place of birth for the foreign-born population - Laos (%)
Place of birth for the foreign-born population - Malaysia (%)
Place of birth for the foreign-born population - Philippines (%)
Place of birth for the foreign-born population - Singapore (%)
Place of birth for the foreign-born population - Thailand (%)
Place of birth for the foreign-born population - Vietnam (%)
Place of birth for the foreign-born population - Other South Eastern Asia (%)
Place of birth for the foreign-born population - Armenia (%)
Place of birth for the foreign-born population - Iraq (%)
Place of birth for the foreign-born population - Israel (%)
Place of birth for the foreign-born population - Jordan (%)
Place of birth for the foreign-born population - Kuwait (%)
Place of birth for the foreign-born population - Lebanon (%)
Place of birth for the foreign-born population - Saudi Arabia (%)
Place of birth for the foreign-born population - Syria (%)
Place of birth for the foreign-born population - Turkey (%)
Place of birth for the foreign-born population - Yemen (%)
Place of birth for the foreign-born population - Other Western Asia (%)
Place of birth for the foreign-born population - Eritrea (%)
Place of birth for the foreign-born population - Ethiopia (%)
Place of birth for the foreign-born population - Kenya (%)
Place of birth for the foreign-born population - Somalia (%)
Place of birth for the foreign-born population - Uganda (%)
Place of birth for the foreign-born population - Zimbabwe (%)
Place of birth for the foreign-born population - Other Eastern Africa (%)
Place of birth for the foreign-born population - Cameroon (%)
Place of birth for the foreign-born population - Congo (%)
Place of birth for the foreign-born population - Democratic Republic of Congo (Zaire) (%)
Place of birth for the foreign-born population - Other Middle Africa (%)
Place of birth for the foreign-born population - Egypt (%)
Place of birth for the foreign-born population - Morocco (%)
Place of birth for the foreign-born population - Sudan (%)
Place of birth for the foreign-born population - Other Northern Africa (%)
Place of birth for the foreign-born population - South Africa (%)
Place of birth for the foreign-born population - Other Southern Africa (%)
Place of birth for the foreign-born population - Cabo Verde (%)
Place of birth for the foreign-born population - Ghana (%)
Place of birth for the foreign-born population - Liberia (%)
Place of birth for the foreign-born population - Nigeria (%)
Place of birth for the foreign-born population - Senegal (%)
Place of birth for the foreign-born population - Sierra Leone (%)
Place of birth for the foreign-born population - Other Western Africa (%)
Place of birth for the foreign-born population - Australia (%)
Place of birth for the foreign-born population - New Zealand (%)
Place of birth for the foreign-born population - Fiji (%)
Place of birth for the foreign-born population - Micronesia (%)
Place of birth for the foreign-born population - Bahamas (%)
Place of birth for the foreign-born population - Barbados (%)
Place of birth for the foreign-born population - Cuba (%)
Place of birth for the foreign-born population - Dominica (%)
Place of birth for the foreign-born population - Dominican Republic (%)
Place of birth for the foreign-born population - Grenada (%)
Place of birth for the foreign-born population - Haiti (%)
Place of birth for the foreign-born population - Jamaica (%)
Place of birth for the foreign-born population - St. Vincent and the Grenadines (%)
Place of birth for the foreign-born population - Trinidad and Tobago (%)
Place of birth for the foreign-born population - West Indies (%)
Place of birth for the foreign-born population - Other Caribbean (%)
Place of birth for the foreign-born population - Belize (%)
Place of birth for the foreign-born population - Costa Rica (%)
Place of birth for the foreign-born population - El Salvador (%)
Place of birth for the foreign-born population - Guatemala (%)
Place of birth for the foreign-born population - Honduras (%)
Place of birth for the foreign-born population - Mexico (%)
Place of birth for the foreign-born population - Nicaragua (%)
Place of birth for the foreign-born population - Panama (%)
Place of birth for the foreign-born population - Other Central America (%)
Place of birth for the foreign-born population - Argentina (%)
Place of birth for the foreign-born population - Bolivia (%)
Place of birth for the foreign-born population - Brazil (%)
Place of birth for the foreign-born population - Chile (%)
Place of birth for the foreign-born population - Colombia (%)
Place of birth for the foreign-born population - Ecuador (%)
Place of birth for the foreign-born population - Guyana (%)
Place of birth for the foreign-born population - Peru (%)
Place of birth for the foreign-born population - Uruguay (%)
Place of birth for the foreign-born population - Venezuela (%)
Place of birth for the foreign-born population - Other South America (%)
Place of birth for the foreign-born population - Canada (%)
Place of birth for the foreign-born population - Other Northern America (%)
Place of birth for the foreign-born population - Other (%)
Latest news about races in Brooklyn, OH collected exclusively by city-data.com from local newspapers, TV, and radio stations
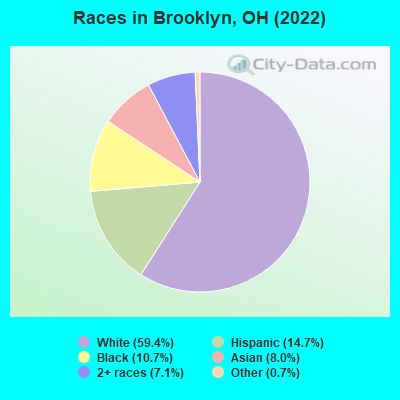
According to 2022 data, the most numerous races in Brooklyn, OH are White alone (6,583 residents), Black alone (1,182 residents), and Two or more races (791 residents). 80.4% of Brooklyn residents speak English at home. 15.1% of Brooklyn, OH residents are foreign-born (7.0% born in Asia, 4.0% born in Europe, 3.1% born in Latin America), which is 73.6% greater than the foreign-born rate of 4.0% across the entire state of Ohio.
Race distribution in Brooklyn
2000 2022
9,538,111 84.0% White alone 1,290,662 11.4% Black alone 217,123 1.9% Hispanic 137,770 1.2% Two or more races 131,670 1.2% Asian alone 21,985 0.2% American Indian alone 13,483 0.1% Other race alone 2,336 0.02% Native Hawaiian and Other
8,948,793 76.1% White alone 1,401,403 11.9% Black alone 529,291 4.5% Two or more races 517,232 4.4% Hispanic 293,387 2.5% Asian alone 52,805 0.4% Other race alone 9,785 0.08% American Indian alone 3,362 0.03% Native Hawaiian and Other
Income and house value in Brooklyn Median household income in 2022 $60,637 White non-Hispanic householders$59,543 Black householders$122,333 Asian householders$42,820 Some other race householders$52,433 Two or more races householders$61,991 Hispanic or Latino race householdersMedian 2022 house value $153,975 White Non-Hispanic householders$127,172 Black or African American householders $183,202 Asian householders$158,965 Some other race householders$167,234 Two or more races householders$189,618 Hispanic or Latino householders
Median age by race in Brooklyn
47.9 Median age for White residents41.3 50.1 30.3 Median age for Black or African American residents29.7 35.3 -545,601,290.8 Median age for American Indian / Alaska Native residents-734,374,999.3 -499,999,999.5 54.1 Median age for Asian residents39.7 66.9 -706,093,189.3 Median age for Native Hawaiian / Pacific Islander residents-750,242,953.6 -805,394,989.6 32.5 Median age for Other race residents10.2 61.2 27.3 Median age for Two or more races residents29.9 16.2 48.3 Median age for White alone residents40.9 51.4 43.0 Median age for Hispanic or Latino residents17.3 47.1
Owner/renter occupied households by race in Brooklyn
House owners and renters - White residents 2,025 58.3% Owner occupied1,450 41.7% Renter occupiedHouse owners and renters - Black or African American residents 163 29.6% Owner occupied387 70.4% Renter occupiedHouse owners and renters - Asian residents 244 90.5% Owner occupied25 9.5% Renter occupiedHouse owners and renters - Other race residents 83 41.6% Owner occupied116 58.4% Renter occupiedHouse owners and renters - Two or more races residents 176 55.9% Owner occupied139 44.1% Renter occupiedHouse owners and renters - White alone residents 1,967 58.5% Owner occupied1,394 41.5% Renter occupiedHouse owners and renters - Hispanic or Latino residents 172 40.8% Owner occupied250 59.2% Renter occupied
Language usage in Brooklyn
English speakers - Total 80.4% of residents of Brooklyn speak English at home.
7.1% of residents speak Spanish at home 341 45.3% Speak English very well412 54.7% Speak English less than very well12.7% of residents speak other language at home 801 59.8% Speak English very well538 40.2% Speak English less than very well
English speakers - Born in the United States 93.5% of residents of Brooklyn speak English at home.
3.8% of residents speak Spanish at home 58 100.0% Speak English very well1.6% of residents speak other language at home 24 100.0% Speak English very well
English speakers - Native, born elsewhere 50.8% of residents of Brooklyn speak English at home.
47.0% of residents speak Spanish at home 72 83.7% Speak English very well14 16.3% Speak English less than very well
English speakers - Foreign-born 18.2% of residents of Brooklyn speak English at home.
24.7% of residents speak Spanish at home 29 7.4% Speak English very well365 92.6% Speak English less than very well59.7% of residents speak other language at home 453 47.5% Speak English very well501 52.5% Speak English less than very well
White (Caucasian) - Speak only English Native:
94.5% (5,924)Foreign-born:
34.7% (157)
White (Caucasian) - Speak another language Native:
5.3% (329)Foreign-born:
65.6% (297)
Asian - Speak only English Native:
16.2% (18)Foreign-born:
17.4% (126)
Asian - Speak another language Native:
87.8% (96)Foreign-born:
82.6% (600)
Other race - Speak another language Native:
40.9% (243)Foreign-born:
100.0% (288)
Two or more races - Speak only English Native:
92.5% (875)Foreign-born:
35.3% (28)
Two or more races - Speak another language Native:
4.4% (41)Foreign-born:
63.4% (51)
White alone - Speak only English Native:
96.2% (5,578)Foreign-born:
32.4% (150)
White alone - Speak another language Native:
3.8% (218)Foreign-born:
67.5% (312)
Hispanic or Latino - Speak only English Native:
66.2% (806)Foreign-born:
2.1% (8)
Hispanic or Latino - Speak another language Native:
34.5% (420)Foreign-born:
99.7% (358)
Foreign-born residents in Brooklyn 1,677 residents are foreign born (7.0% Asia , 4.0% Europe , 3.1% Latin America ).
Marital status for residents in Brooklyn Marital status - White (Caucasian) population 15 years and over
Males 42.4% Never married37.7% Now married1.0% Separated4.9% Widowed14.1% DivorcedFemales 32.9% Never married38.3% Now married0.2% Separated13.6% Widowed14.9% DivorcedWomen who gave birth in the past 12 months Now married:
15.5% (15)Unmarried:
84.5% (82)
Women who did not give birth in the past 12 months Now married:
42.0% (612)Unmarried:
58.0% (845)
Marital status - Black or African American population 15 years and over
Males 63.1% Never married34.8% Now married0.0% Separated0.0% Widowed2.1% DivorcedFemales 64.6% Never married21.2% Now married0.0% Separated0.0% Widowed14.2% DivorcedWomen who did not give birth in the past 12 months Now married:
17.7% (80)Unmarried:
82.3% (373)
Marital status - Asian population 15 years and over
Males 21.3% Never married71.8% Now married0.0% Separated4.5% Widowed2.5% DivorcedFemales 5.7% Never married21.3% Now married0.0% Separated44.7% Widowed28.3% DivorcedWomen who gave birth in the past 12 months Now married:
100.0% (20)Unmarried:
0.0% (0)
Women who did not give birth in the past 12 months Now married:
65.9% (87)Unmarried:
34.1% (45)
Marital status - Other race population 15 years and over
Males 40.4% Never married59.6% Now married0.0% Separated0.0% Widowed0.0% DivorcedFemales 9.3% Never married69.7% Now married10.2% Separated4.2% Widowed6.6% DivorcedWomen who did not give birth in the past 12 months Now married:
55.8% (95)Unmarried:
44.2% (75)
Marital status - Two or more races population 15 years and over
Males 62.5% Never married17.4% Now married1.6% Separated9.8% Widowed8.8% DivorcedFemales 53.0% Never married27.4% Now married0.0% Separated4.8% Widowed14.8% DivorcedWomen who did not give birth in the past 12 months Now married:
39.4% (48)Unmarried:
60.6% (74)
Marital status - White alone, not Hispanic / Latino population 15 years and over
Males 43.8% Never married35.9% Now married1.0% Separated5.2% Widowed14.0% DivorcedFemales 31.8% Never married37.5% Now married0.3% Separated14.7% Widowed15.7% DivorcedWomen who gave birth in the past 12 months Now married:
18.6% (15)Unmarried:
81.4% (67)
Women who did not give birth in the past 12 months Now married:
40.6% (515)Unmarried:
59.4% (753)
Marital status - Hispanic or Latino population 15 years and over
Males 36.6% Never married57.1% Now married0.0% Separated0.0% Widowed6.4% DivorcedFemales 29.5% Never married51.5% Now married2.8% Separated4.7% Widowed11.4% DivorcedWomen who gave birth in the past 12 months Now married:
0.0% (0)Unmarried:
100.0% (18)
Women who did not give birth in the past 12 months Now married:
45.1% (188)Unmarried:
54.9% (228)
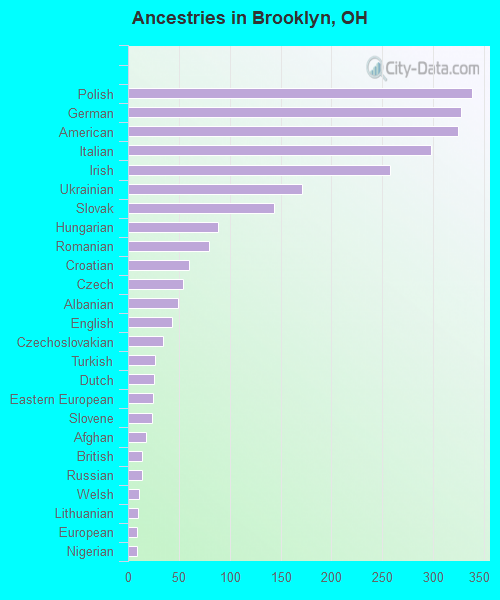
Ancestries in Brooklyn
338 6.7% Polish327 6.5% German324 6.5% American298 5.9% Italian258 5.1% Irish171 3.4% Ukrainian144 2.9% Slovak88 1.8% Hungarian80 1.6% Romanian60 1.2% Croatian54 1.1% Czech49 1.0% Albanian43 0.9% English34 0.7% Czechoslovakian27 0.5% Turkish26 0.5% Dutch25 0.5% Eastern European24 0.5% Slovene18 0.4% Afghan14 0.3% British14 0.3% Russian11 0.2% Welsh10 0.2% Lithuanian9 0.2% European9 0.2% Nigerian9 0.2% Yugoslavian8 0.2% Scottish7 0.1% Moroccan7 0.1% African7 0.1% Swiss
Children Nativity (place of birth) in Brooklyn
Children under 6 years - Living with two parents Both parents native 192 100.0% NativeBoth parents foreign-born 37 70.8% Native15 29.2% Foreign-bornOne native, one foreign-born parent 22 100.0% NativeChildren under 6 years - Living with one parent Native parent 279 100.0% NativeChildren 6 to 17 years - Living with two parents Both parents native 487 99.8% Native1 0.2% Foreign-bornBoth parents foreign-born 103 79.8% Native26 20.2% Foreign-bornOne native, one foreign-born parent 20 100.0% NativeChildren 6 to 17 years - Living with one parent Native parent 951 100.0% NativeForeign-born parent 18 53.9% Native15 46.1% Foreign-born
Grandparents responsible for own grandchildren in Brooklyn
Grandparents (30 to 59 years) White / Caucasian 25 74.4% Responsible for grandchildren9 25.6% Not responsible for grandchildrenWhite alone, not Hispanic / Latino 13 60.7% Responsible for grandchildren9 39.3% Not responsible for grandchildrenHispanic or Latino 25 100.0% Responsible for grandchildrenGrandparents (60 years and over) White / Caucasian 62 44.4% Responsible for grandchildren78 55.6% Not responsible for grandchildrenWhite alone, not Hispanic / Latino 63 76.0% Responsible for grandchildren20 24.0% Not responsible for grandchildrenHispanic or Latino 74 100.0% Not responsible for grandchildren