Races in Incline Village, Nevada (NV) Detailed Stats
Ancestries, Foreign-born residents, place of birth

Data:
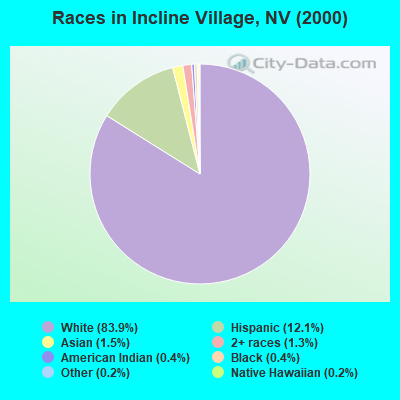
Race distribution in Incline Village

- 8,34783.9%White alone
- 1,20712.1%Hispanic
- 1541.5%Asian alone
- 1281.3%Two or more races
- 370.4%Black alone
- 430.4%American Indian alone
- 150.2%Native Hawaiian and Other
Pacific Islander alone
- 210.2%Other race alone
2000
2022
-
- 1,303,00165.2%White alone
- 393,97019.7%Hispanic
- 131,5096.6%Black alone
- 88,5934.4%Asian alone
- 49,2312.5%Two or more races
- 21,3971.1%American Indian alone
- 7,7690.4%Native Hawaiian and Other
Pacific Islander alone
- 2,7870.1%Other race alone
-
- 1,410,14544.4%White alone
- 961,35730.3%Hispanic
- 286,4719.0%Black alone
- 281,1498.8%Asian alone
- 182,1515.7%Two or more races
- 20,1020.6%Native Hawaiian and Other
Pacific Islander alone
- 18,7810.6%Other race alone
- 17,6160.6%American Indian alone
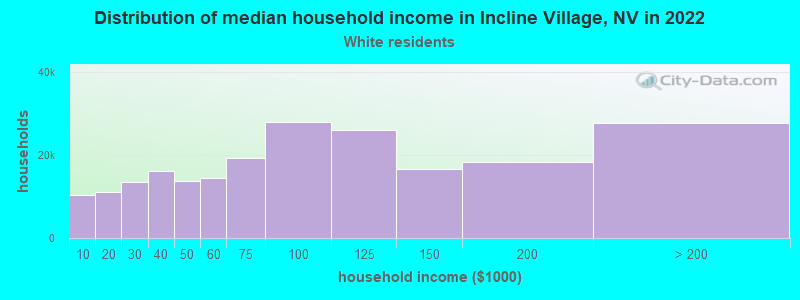
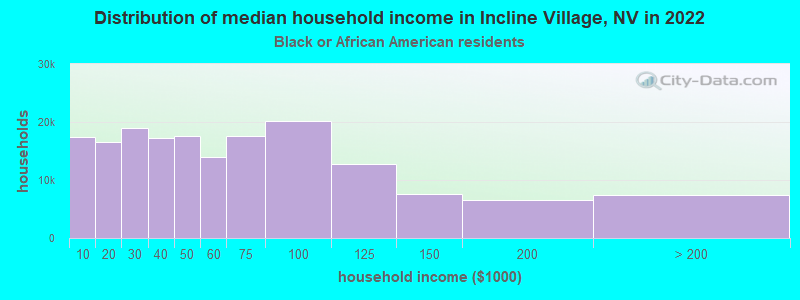
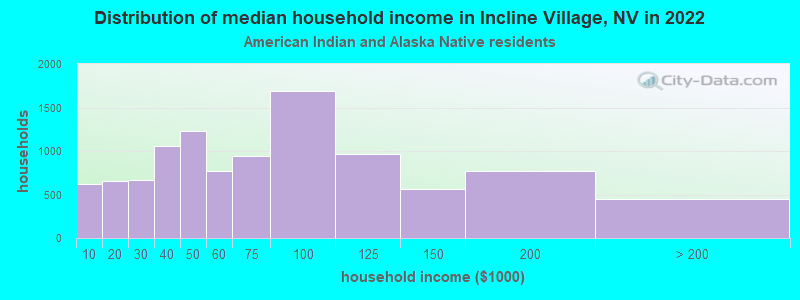
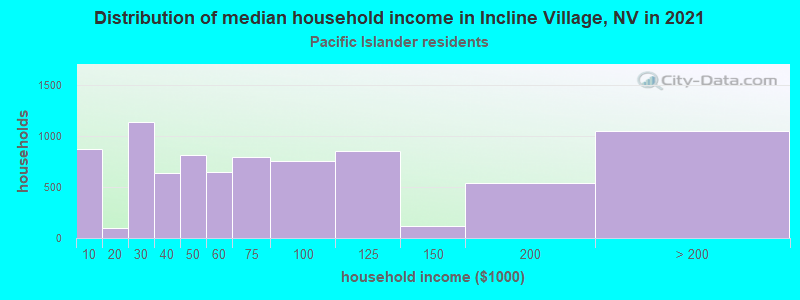
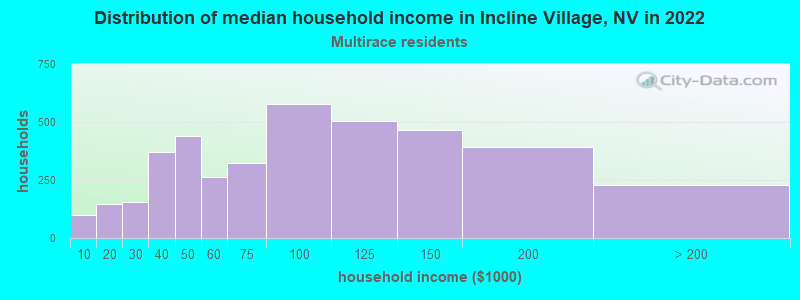
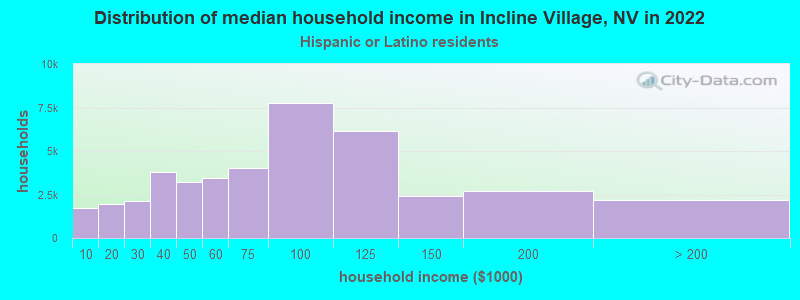
Income and house value in Incline Village
- Median household income in 2022
- $124,134White non-Hispanic householders
- $90,060Black householders
- $112,421American Indian and Alaska Native householders
- over $200,000Asian householders
- $116,421Native Hawaiian and other Pacific Islander householders
- $96,820Some other race householders
- $14,854Two or more races householders
- $87,780Hispanic or Latino race householders
- Median 2022 house value
- over $1,000,000White Non-Hispanic householders
- over $1,000,000Asian householders
- over $1,000,000Some other race householders
- over $1,000,000Two or more races householders
- $833,739Hispanic or Latino householders