Races in Kearny, New Jersey (NJ) Detailed Stats
Data:
Races - White alone (%)
Races - White alone (% change since 2000)
Races - Black alone (%)
Races - Black alone (% change since 2000)
Races - American Indian alone (%)
Races - American Indian alone (% change since 2000)
Races - Asian alone (%)
Races - Asian alone (% change since 2000)
Races - Hispanic (%)
Races - Hispanic (% change since 2000)
Races - Native Hawaiian and Other Pacific Islander alone (%)
Races - Native Hawaiian and Other Pacific Islander alone (% change since 2000)
Races - Two or more races(%)
Races - Two or more races(% change since 2000)
Races - Other race alone (%)
Races - Other race alone (% change since 2000)
Racial diversity
Place of birth - Born in state of residence (%)
Place of birth - Born in state of residence (%) - White
Place of birth - Born in state of residence (%) - Black or African American
Place of birth - Born in state of residence (%) - Asian
Place of birth - Born in state of residence (%) - Hispanic or Latino
Place of birth - Born in state of residence (%) - American Indian and Alaska Native
Place of birth - Born in state of residence (%) - Multirace
Place of birth - Born in state of residence (%) - Other Race
Place of birth - Born in other state (%)
Place of birth - Born in other state (%) - White
Place of birth - Born in other state (%) - Black or African American
Place of birth - Born in other state (%) - Asian
Place of birth - Born in other state (%) - Hispanic or Latino
Place of birth - Born in other state (%) - American Indian and Alaska Native
Place of birth - Born in other state (%) - Multirace
Place of birth - Born in other state (%) - Other Race
Place of birth - Native, outside of US (%)
Place of birth - Native, outside of US (%) - White
Place of birth - Native, outside of US (%) - Black or African American
Place of birth - Native, outside of US (%) - Asian
Place of birth - Native, outside of US (%) - Hispanic or Latino
Place of birth - Native, outside of US (%) - American Indian and Alaska Native
Place of birth - Native, outside of US (%) - Multirace
Place of birth - Native, outside of US (%) - Other Race
Place of birth - Foreign born (%)
Place of birth - Foreign born (%) - White
Place of birth - Foreign born (%) - Black or African American
Place of birth - Foreign born (%) - Asian
Place of birth - Foreign born (%) - Hispanic or Latino
Place of birth - Foreign born (%) - American Indian and Alaska Native
Place of birth - Foreign born (%) - Multirace
Place of birth - Foreign born (%) - Other Race
Residents speaking English at home (%)
Residents speaking English at home - Born in the United States (%)
Residents speaking English at home - Native, born elsewhere (%)
Residents speaking English at home - Foreign born (%)
Residents speaking Spanish at home (%)
Residents speaking Spanish at home - Born in the United States (%)
Residents speaking Spanish at home - Native, born elsewhere (%)
Residents speaking Spanish at home - Foreign born (%)
Residents speaking other language at home (%)
Residents speaking other language at home - Born in the United States (%)
Residents speaking other language at home - Native, born elsewhere (%)
Residents speaking other language at home - Foreign born (%)
Marital status - Never married (%)
Marital status - Now married (%)
Marital status - Separated (%)
Marital status - Widowed (%)
Marital status - Divorced (%)
Ancestries Reported - Arab (%)
Ancestries Reported - Czech (%)
Ancestries Reported - Danish (%)
Ancestries Reported - Dutch (%)
Ancestries Reported - English (%)
Ancestries Reported - French (%)
Ancestries Reported - French Canadian (%)
Ancestries Reported - German (%)
Ancestries Reported - Greek (%)
Ancestries Reported - Hungarian (%)
Ancestries Reported - Irish (%)
Ancestries Reported - Italian (%)
Ancestries Reported - Lithuanian (%)
Ancestries Reported - Norwegian (%)
Ancestries Reported - Polish (%)
Ancestries Reported - Portuguese (%)
Ancestries Reported - Russian (%)
Ancestries Reported - Scotch-Irish (%)
Ancestries Reported - Scottish (%)
Ancestries Reported - Slovak (%)
Ancestries Reported - Subsaharan African (%)
Ancestries Reported - Swedish (%)
Ancestries Reported - Swiss (%)
Ancestries Reported - Ukrainian (%)
Ancestries Reported - United States (%)
Ancestries Reported - Welsh (%)
Ancestries Reported - West Indian (%)
Ancestries Reported - Other (%)
Geographical mobility - Same house 1 year ago (%)
Geographical mobility - Same house 1 year ago (%) - White
Geographical mobility - Same house 1 year ago (%) - Black or African American
Geographical mobility - Same house 1 year ago (%) - Asian
Geographical mobility - Same house 1 year ago (%) - Hispanic or Latino
Geographical mobility - Same house 1 year ago (%) - American Indian and Alaska Native
Geographical mobility - Same house 1 year ago (%) - Multirace
Geographical mobility - Same house 1 year ago (%) - Other Race
Geographical mobility - Moved within same county (%)
Geographical mobility - Moved within same county (%) - White
Geographical mobility - Moved within same county (%) - Black or African American
Geographical mobility - Moved within same county (%) - Asian
Geographical mobility - Moved within same county (%) - Hispanic or Latino
Geographical mobility - Moved within same county (%) - American Indian and Alaska Native
Geographical mobility - Moved within same county (%) - Multirace
Geographical mobility - Moved within same county (%) - Other Race
Geographical mobility - Moved from different county within same state (%)
Geographical mobility - Moved from different county within same state (%) - White
Geographical mobility - Moved from different county within same state (%) - Black or African American
Geographical mobility - Moved from different county within same state (%) - Asian
Geographical mobility - Moved from different county within same state (%) - Hispanic or Latino
Geographical mobility - Moved from different county within same state (%) - American Indian and Alaska Native
Geographical mobility - Moved from different county within same state (%) - Multirace
Geographical mobility - Moved from different county within same state (%) - Other Race
Geographical mobility - Moved from different state (%)
Geographical mobility - Moved from different state (%) - White
Geographical mobility - Moved from different state (%) - Black or African American
Geographical mobility - Moved from different state (%) - Asian
Geographical mobility - Moved from different state (%) - Hispanic or Latino
Geographical mobility - Moved from different state (%) - American Indian and Alaska Native
Geographical mobility - Moved from different state (%) - Multirace
Geographical mobility - Moved from different state (%) - Other Race
Geographical mobility - Moved from abroad (%)
Geographical mobility - Moved from abroad (%) - White
Geographical mobility - Moved from abroad (%) - Black or African American
Geographical mobility - Moved from abroad (%) - Asian
Geographical mobility - Moved from abroad (%) - Hispanic or Latino
Geographical mobility - Moved from abroad (%) - American Indian and Alaska Native
Geographical mobility - Moved from abroad (%) - Multirace
Geographical mobility - Moved from abroad (%) - Other Race
Place of birth for the foreign-born population - Ireland (%)
Place of birth for the foreign-born population - Denmark (%)
Place of birth for the foreign-born population - Norway (%)
Place of birth for the foreign-born population - Sweden (%)
Place of birth for the foreign-born population - United Kingdom (%)
Place of birth for the foreign-born population - England (%)
Place of birth for the foreign-born population - Scotland (%)
Place of birth for the foreign-born population - Other Northern Europe (%)
Place of birth for the foreign-born population - Austria (%)
Place of birth for the foreign-born population - Belgium (%)
Place of birth for the foreign-born population - France (%)
Place of birth for the foreign-born population - Germany (%)
Place of birth for the foreign-born population - Netherlands (%)
Place of birth for the foreign-born population - Switzerland (%)
Place of birth for the foreign-born population - Other Western Europe (%)
Place of birth for the foreign-born population - Greece (%)
Place of birth for the foreign-born population - Italy (%)
Place of birth for the foreign-born population - Portugal (%)
Place of birth for the foreign-born population - Spain (%)
Place of birth for the foreign-born population - Other Southern Europe (%)
Place of birth for the foreign-born population - Albania (%)
Place of birth for the foreign-born population - Belarus (%)
Place of birth for the foreign-born population - Bosnia and Herzegovina (%)
Place of birth for the foreign-born population - Bulgaria (%)
Place of birth for the foreign-born population - Croatia (%)
Place of birth for the foreign-born population - Czechoslovakia (%)
Place of birth for the foreign-born population - Hungary (%)
Place of birth for the foreign-born population - Latvia (%)
Place of birth for the foreign-born population - Lithuania (%)
Place of birth for the foreign-born population - North Macedonia (Macedonia) (%)
Place of birth for the foreign-born population - Moldova (%)
Place of birth for the foreign-born population - Poland (%)
Place of birth for the foreign-born population - Romania (%)
Place of birth for the foreign-born population - Russia (%)
Place of birth for the foreign-born population - Serbia (%)
Place of birth for the foreign-born population - Ukraine (%)
Place of birth for the foreign-born population - Other Eastern Europe (%)
Place of birth for the foreign-born population - China (%)
Place of birth for the foreign-born population - Hong Kong (%)
Place of birth for the foreign-born population - Taiwan (%)
Place of birth for the foreign-born population - Japan (%)
Place of birth for the foreign-born population - Korea (%)
Place of birth for the foreign-born population - Other Eastern Asia (%)
Place of birth for the foreign-born population - Afghanistan (%)
Place of birth for the foreign-born population - Bangladesh (%)
Place of birth for the foreign-born population - India (%)
Place of birth for the foreign-born population - Iran (%)
Place of birth for the foreign-born population - Kazakhstan (%)
Place of birth for the foreign-born population - Nepal (%)
Place of birth for the foreign-born population - Pakistan (%)
Place of birth for the foreign-born population - Sri Lanka (%)
Place of birth for the foreign-born population - Uzbekistan (%)
Place of birth for the foreign-born population - Other South Central Asia (%)
Place of birth for the foreign-born population - Burma (%)
Place of birth for the foreign-born population - Cambodia (%)
Place of birth for the foreign-born population - Indonesia (%)
Place of birth for the foreign-born population - Laos (%)
Place of birth for the foreign-born population - Malaysia (%)
Place of birth for the foreign-born population - Philippines (%)
Place of birth for the foreign-born population - Singapore (%)
Place of birth for the foreign-born population - Thailand (%)
Place of birth for the foreign-born population - Vietnam (%)
Place of birth for the foreign-born population - Other South Eastern Asia (%)
Place of birth for the foreign-born population - Armenia (%)
Place of birth for the foreign-born population - Iraq (%)
Place of birth for the foreign-born population - Israel (%)
Place of birth for the foreign-born population - Jordan (%)
Place of birth for the foreign-born population - Kuwait (%)
Place of birth for the foreign-born population - Lebanon (%)
Place of birth for the foreign-born population - Saudi Arabia (%)
Place of birth for the foreign-born population - Syria (%)
Place of birth for the foreign-born population - Turkey (%)
Place of birth for the foreign-born population - Yemen (%)
Place of birth for the foreign-born population - Other Western Asia (%)
Place of birth for the foreign-born population - Eritrea (%)
Place of birth for the foreign-born population - Ethiopia (%)
Place of birth for the foreign-born population - Kenya (%)
Place of birth for the foreign-born population - Somalia (%)
Place of birth for the foreign-born population - Uganda (%)
Place of birth for the foreign-born population - Zimbabwe (%)
Place of birth for the foreign-born population - Other Eastern Africa (%)
Place of birth for the foreign-born population - Cameroon (%)
Place of birth for the foreign-born population - Congo (%)
Place of birth for the foreign-born population - Democratic Republic of Congo (Zaire) (%)
Place of birth for the foreign-born population - Other Middle Africa (%)
Place of birth for the foreign-born population - Egypt (%)
Place of birth for the foreign-born population - Morocco (%)
Place of birth for the foreign-born population - Sudan (%)
Place of birth for the foreign-born population - Other Northern Africa (%)
Place of birth for the foreign-born population - South Africa (%)
Place of birth for the foreign-born population - Other Southern Africa (%)
Place of birth for the foreign-born population - Cabo Verde (%)
Place of birth for the foreign-born population - Ghana (%)
Place of birth for the foreign-born population - Liberia (%)
Place of birth for the foreign-born population - Nigeria (%)
Place of birth for the foreign-born population - Senegal (%)
Place of birth for the foreign-born population - Sierra Leone (%)
Place of birth for the foreign-born population - Other Western Africa (%)
Place of birth for the foreign-born population - Australia (%)
Place of birth for the foreign-born population - New Zealand (%)
Place of birth for the foreign-born population - Fiji (%)
Place of birth for the foreign-born population - Micronesia (%)
Place of birth for the foreign-born population - Bahamas (%)
Place of birth for the foreign-born population - Barbados (%)
Place of birth for the foreign-born population - Cuba (%)
Place of birth for the foreign-born population - Dominica (%)
Place of birth for the foreign-born population - Dominican Republic (%)
Place of birth for the foreign-born population - Grenada (%)
Place of birth for the foreign-born population - Haiti (%)
Place of birth for the foreign-born population - Jamaica (%)
Place of birth for the foreign-born population - St. Vincent and the Grenadines (%)
Place of birth for the foreign-born population - Trinidad and Tobago (%)
Place of birth for the foreign-born population - West Indies (%)
Place of birth for the foreign-born population - Other Caribbean (%)
Place of birth for the foreign-born population - Belize (%)
Place of birth for the foreign-born population - Costa Rica (%)
Place of birth for the foreign-born population - El Salvador (%)
Place of birth for the foreign-born population - Guatemala (%)
Place of birth for the foreign-born population - Honduras (%)
Place of birth for the foreign-born population - Mexico (%)
Place of birth for the foreign-born population - Nicaragua (%)
Place of birth for the foreign-born population - Panama (%)
Place of birth for the foreign-born population - Other Central America (%)
Place of birth for the foreign-born population - Argentina (%)
Place of birth for the foreign-born population - Bolivia (%)
Place of birth for the foreign-born population - Brazil (%)
Place of birth for the foreign-born population - Chile (%)
Place of birth for the foreign-born population - Colombia (%)
Place of birth for the foreign-born population - Ecuador (%)
Place of birth for the foreign-born population - Guyana (%)
Place of birth for the foreign-born population - Peru (%)
Place of birth for the foreign-born population - Uruguay (%)
Place of birth for the foreign-born population - Venezuela (%)
Place of birth for the foreign-born population - Other South America (%)
Place of birth for the foreign-born population - Canada (%)
Place of birth for the foreign-born population - Other Northern America (%)
Place of birth for the foreign-born population - Other (%)
Latest news about races in Kearny, NJ collected exclusively by city-data.com from local newspapers, TV, and radio stations
According to 2022 data, the most numerous races in Kearny, NJ are White alone (12,750 residents), Hispanic (22,181 residents), and Black alone (1,610 residents). 34.3% of Kearny residents speak English at home. 47.2% of Kearny, NJ residents are foreign-born (31.8% born in Latin America, 9.8% born in Europe), which is 51.3% greater than the foreign-born rate of 23.0% across the entire state of New Jersey.
Race distribution in Kearny
2000 2022
24,425 60.3% White alone 11,075 27.3% Hispanic 2,206 5.4% Asian alone 1,442 3.6% Black alone 940 2.3% Two or more races 361 0.9% Other race alone 50 0.1% American Indian alone 14 0.03% Native Hawaiian and Other
22,181 54.6% Hispanic 12,750 31.4% White alone 1,872 4.6% Two or more races 1,610 4.0% Black alone 1,310 3.2% Asian alone 1,002 2.5% Other race alone
2000 2022
5,557,209 66.0% White alone 1,117,191 13.3% Hispanic 1,096,171 13.0% Black alone 477,012 5.7% Asian alone 133,689 1.6% Two or more races 19,565 0.2% Other race alone 11,338 0.1% American Indian alone 2,175 0.03% Native Hawaiian and Other
4,766,476 51.5% White alone 2,028,470 21.9% Hispanic 1,111,632 12.0% Black alone 923,546 10.0% Asian alone 332,237 3.6% Two or more races 89,847 1.0% Other race alone 8,557 0.09% American Indian alone 934 0.01% Native Hawaiian and Other
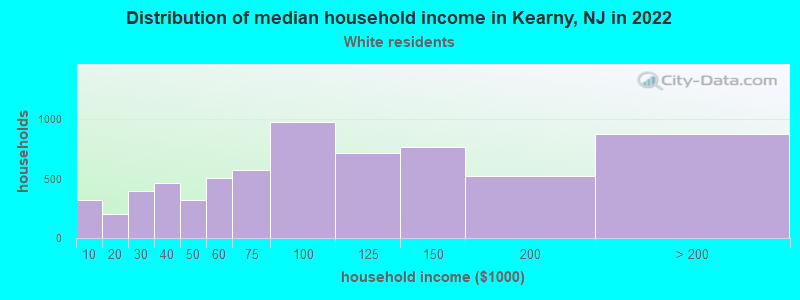
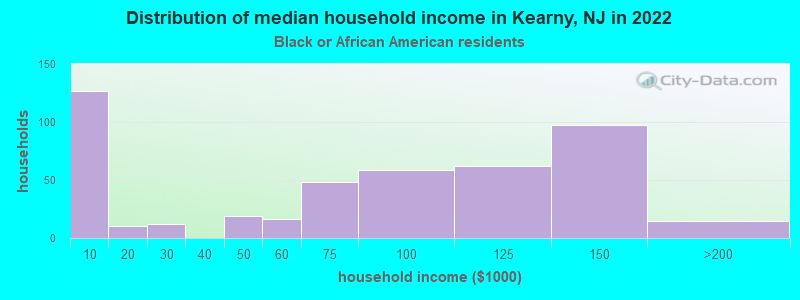
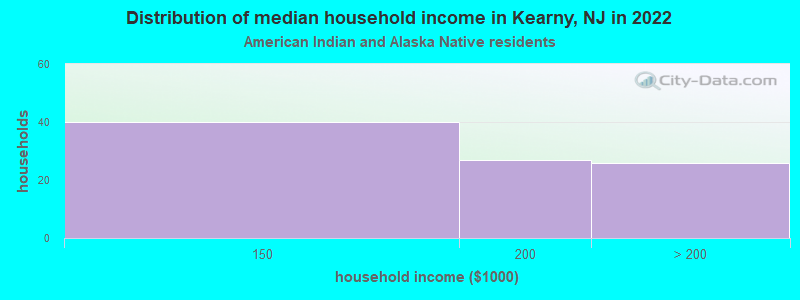
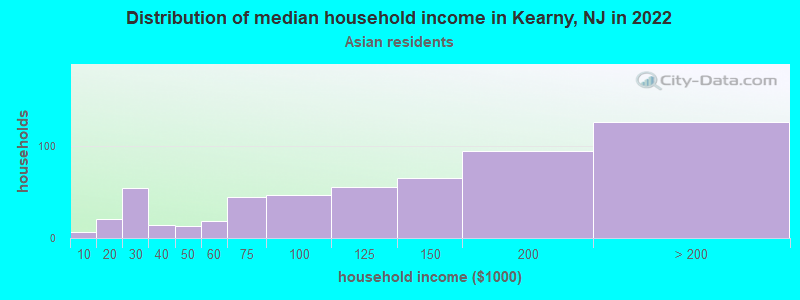
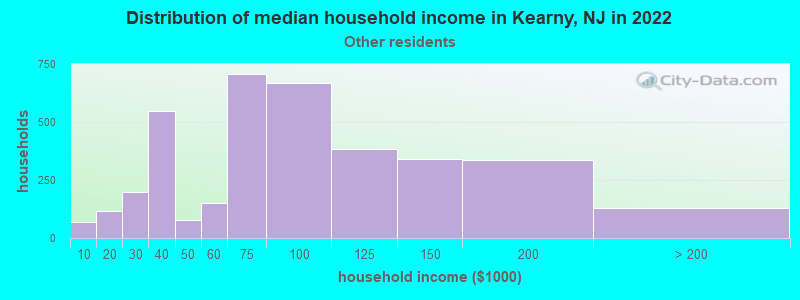
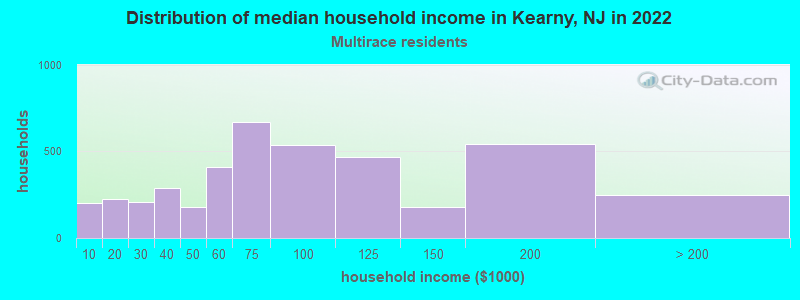
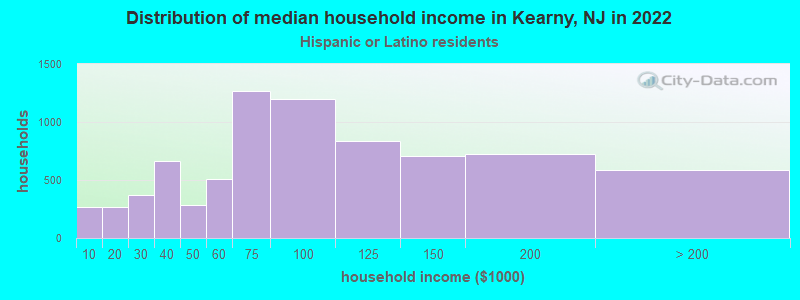
Income and house value in Kearny Median household income in 2022 $81,882 White non-Hispanic householders$99,022 Black householders$127,521 Asian householders$74,841 Some other race householders$74,442 Two or more races householders$81,850 Hispanic or Latino race householdersMedian 2022 house value $419,836 White Non-Hispanic householders$425,863 Black or African American householders$589,657 American Indian or Alaska Native householders $369,780 Asian householders$371,091 Some other race householders$400,181 Two or more races householders$399,394 Hispanic or Latino householders
Median age by race in Kearny
41.5 Median age for White residents42.5 40.4 33.8 Median age for Black or African American residents34.8 32.3 63.9 Median age for American Indian / Alaska Native residents-666,666,666.0 44.6 38.1 Median age for Asian residents38.2 38.1 -804,177,544.9 Median age for Native Hawaiian / Pacific Islander residents-860,335,194.7 -713,070,378.3 37.4 Median age for Other race residents37.1 37.2 39.6 Median age for Two or more races residents39.2 40.4 47.2 Median age for White alone residents46.0 47.5 35.2 Median age for Hispanic or Latino residents36.9 33.2
Owner/renter occupied households by race in Kearny
House owners and renters - White residents 3,719 55.6% Owner occupied2,969 44.4% Renter occupiedHouse owners and renters - Black or African American residents 169 37.6% Owner occupied280 62.4% Renter occupiedHouse owners and renters - American Indian / Alaska Native residents 36 35.5% Owner occupied65 64.5% Renter occupiedHouse owners and renters - Asian residents 268 47.4% Owner occupied298 52.6% Renter occupiedHouse owners and renters - Other race residents 1,410 35.8% Owner occupied2,530 64.2% Renter occupiedHouse owners and renters - Two or more races residents 1,814 43.3% Owner occupied2,377 56.7% Renter occupiedHouse owners and renters - White alone residents 3,477 61.0% Owner occupied2,218 39.0% Renter occupiedHouse owners and renters - Hispanic or Latino residents 2,965 38.7% Owner occupied4,695 61.3% Renter occupied
Language usage in Kearny
English speakers - Total 34.3% of residents of Kearny speak English at home.
43.3% of residents speak Spanish at home 8,655 52.5% Speak English very well7,845 47.5% Speak English less than very well20.8% of residents speak other language at home 4,777 60.2% Speak English very well3,156 39.8% Speak English less than very well
English speakers - Born in the United States 56.6% of residents of Kearny speak English at home.
32.4% of residents speak Spanish at home 1,116 90.2% Speak English very well121 9.8% Speak English less than very well8.0% of residents speak other language at home 301 99.0% Speak English very well3 1.0% Speak English less than very well
English speakers - Native, born elsewhere 14.9% of residents of Kearny speak English at home.
70.5% of residents speak Spanish at home 436 58.7% Speak English very well307 41.3% Speak English less than very well14.6% of residents speak other language at home 110 71.4% Speak English very well44 28.6% Speak English less than very well
English speakers - Foreign-born 8.6% of residents of Kearny speak English at home.
58.3% of residents speak Spanish at home 3,978 37.4% Speak English very well6,657 62.6% Speak English less than very well31.0% of residents speak other language at home 2,550 45.1% Speak English very well3,103 54.9% Speak English less than very well
White (Caucasian) - Speak only English Native:
74.5% (7,232)Foreign-born:
12.0% (522)
White (Caucasian) - Speak another language Native:
22.2% (2,153)Foreign-born:
83.6% (3,625)
Black or African American - Speak only English Native:
88.1% (1,408)Foreign-born:
47.0% (141)
Black or African American - Speak another language Native:
9.6% (154)Foreign-born:
51.9% (156)
American Indian / Alaska Native - Speak another language Native:
95.2% (49)Foreign-born:
100.0% (191)
Asian - Speak only English Native:
65.0% (157)Foreign-born:
9.9% (110)
Asian - Speak another language Native:
37.1% (89)Foreign-born:
89.9% (989)
Other race - Speak only English Native:
17.0% (708)Foreign-born:
6.4% (431)
Other race - Speak another language Native:
84.1% (3,496)Foreign-born:
93.3% (6,320)
Two or more races - Speak only English Native:
41.5% (1,585)Foreign-born:
9.0% (527)
Two or more races - Speak another language Native:
54.9% (2,099)Foreign-born:
90.8% (5,328)
White alone - Speak only English Native:
77.3% (6,441)Foreign-born:
11.3% (434)
White alone - Speak another language Native:
22.3% (1,859)Foreign-born:
84.8% (3,269)
Hispanic or Latino - Speak only English Native:
34.2% (3,048)Foreign-born:
6.5% (740)
Hispanic or Latino - Speak another language Native:
65.2% (5,807)Foreign-born:
93.4% (10,559)
Foreign-born residents in Kearny 19,196 residents are foreign born (31.8% Latin America , 9.8% Europe ).
This city:
47.2%New Jersey:
23.2%
Marital status for residents in Kearny Marital status - White (Caucasian) population 15 years and over
Males 37.1% Never married53.1% Now married2.2% Separated2.2% Widowed5.5% DivorcedFemales 27.2% Never married53.3% Now married2.6% Separated8.1% Widowed8.8% DivorcedWomen who gave birth in the past 12 months Now married:
73.2% (168)Unmarried:
26.8% (61)
Women who did not give birth in the past 12 months Now married:
46.8% (1,468)Unmarried:
53.2% (1,670)
Marital status - Black or African American population 15 years and over
Males 72.7% Never married22.4% Now married1.2% Separated1.4% Widowed2.3% DivorcedFemales 60.2% Never married26.5% Now married0.0% Separated2.1% Widowed11.2% DivorcedWomen who did not give birth in the past 12 months Now married:
30.8% (129)Unmarried:
69.2% (289)
Marital status - American Indian / Alaska Native population 15 years and over
Males 0.0% Never married48.6% Now married0.0% Separated0.0% Widowed51.4% DivorcedFemales 0.0% Never married39.8% Now married0.0% Separated0.0% Widowed60.2% DivorcedWomen who did not give birth in the past 12 months Now married:
44.8% (40)Unmarried:
55.2% (49)
Marital status - Asian population 15 years and over
Males 31.9% Never married59.2% Now married1.9% Separated4.8% Widowed2.2% DivorcedFemales 15.6% Never married63.3% Now married3.1% Separated14.0% Widowed4.0% DivorcedWomen who gave birth in the past 12 months Now married:
100.0% (16)Unmarried:
0.0% (0)
Women who did not give birth in the past 12 months Now married:
70.7% (217)Unmarried:
29.3% (90)
Marital status - Other race population 15 years and over
Males 46.5% Never married44.0% Now married2.5% Separated0.6% Widowed6.3% DivorcedFemales 32.6% Never married50.5% Now married3.1% Separated4.2% Widowed9.7% DivorcedWomen who gave birth in the past 12 months Now married:
64.2% (81)Unmarried:
35.8% (45)
Women who did not give birth in the past 12 months Now married:
53.6% (1,420)Unmarried:
46.4% (1,228)
Marital status - Two or more races population 15 years and over
Males 41.6% Never married41.0% Now married0.3% Separated1.4% Widowed15.6% DivorcedFemales 39.8% Never married36.3% Now married4.2% Separated8.1% Widowed11.6% DivorcedWomen who gave birth in the past 12 months Now married:
98.6% (89)Unmarried:
1.4% (1)
Women who did not give birth in the past 12 months Now married:
33.0% (787)Unmarried:
67.0% (1,599)
Marital status - White alone, not Hispanic / Latino population 15 years and over
Males 36.3% Never married52.1% Now married3.1% Separated2.7% Widowed5.8% DivorcedFemales 25.2% Never married53.6% Now married1.6% Separated10.6% Widowed9.0% DivorcedWomen who gave birth in the past 12 months Now married:
100.0% (86)Unmarried:
0.0% (0)
Women who did not give birth in the past 12 months Now married:
46.5% (1,152)Unmarried:
53.5% (1,323)
Marital status - Hispanic or Latino population 15 years and over
Males 43.5% Never married45.7% Now married1.2% Separated0.8% Widowed8.8% DivorcedFemales 35.2% Never married45.2% Now married4.1% Separated5.0% Widowed10.5% DivorcedWomen who gave birth in the past 12 months Now married:
67.8% (237)Unmarried:
32.2% (113)
Women who did not give birth in the past 12 months Now married:
42.9% (2,029)Unmarried:
57.1% (2,701)
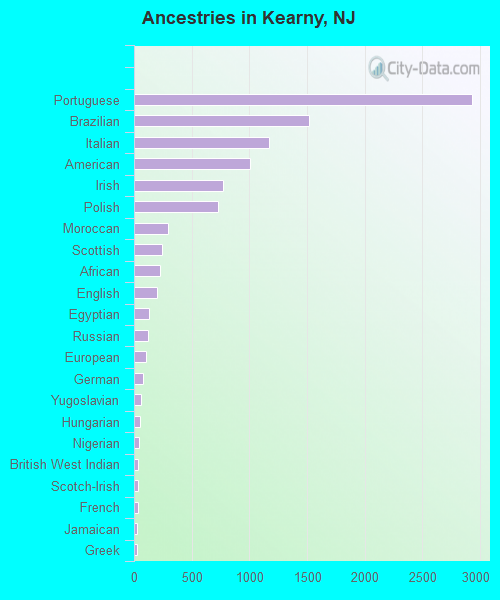
Ancestries in Kearny
2,930 11.6% Portuguese1,515 6.0% Brazilian1,170 4.6% Italian1,007 4.0% American769 3.0% Irish730 2.9% Polish294 1.2% Moroccan243 1.0% Scottish221 0.9% African201 0.8% English132 0.5% Egyptian120 0.5% Russian108 0.4% European75 0.3% German63 0.2% Yugoslavian49 0.2% Hungarian45 0.2% Nigerian38 0.2% British West Indian34 0.1% Scotch-Irish32 0.1% French29 0.1% Jamaican28 0.1% Greek23 0.09% Dutch19 0.08% Trinidadian and Tobagonian18 0.07% British17 0.07% Arab16 0.06% Romanian16 0.06% Bahamian15 0.06% Kenyan11 0.04% Syrian11 0.04% Iranian10 0.04% Croatian9 0.04% French Canadian9 0.04% Lithuanian7 0.03% Turkish6 0.02% Eastern European3 0.01% Guyanese3 0.01% Sudanese
Geographical mobility in Kearny Same house 1 year ago 13,220 87.3% White (Caucasian)1,734 87.0% Black or African American171 84.0% American Indian / Alaska Native1,236 89.0% Asian10,276 88.3% Other race9,594 93.0% Two or more races11,550 90.5% White alone, not Hispanic / Latino19,111 87.5% Hispanic or LatinoMoved within same county 672 4.4% White / Caucasian24 1.2% Black or African American46 3.3% Asian674 5.8% Other race96 0.9% Two or more races312 2.4% White alone, not Hispanic / Latino1,164 5.3% Hispanic or LatinoMoved within same state 614 4.1% White / Caucasian95 4.8% Black or African American36 17.7% American Indian / Alaska Native40 2.9% Asian303 2.6% Other race396 3.8% Two or more races476 3.7% White alone, not Hispanic / Latino789 3.6% Hispanic or LatinoMoved from different state 268 1.8% White / Caucasian72 3.6% Black or African American50 3.6% Asian169 1.4% Other race74 0.7% Two or more races241 1.9% White alone, not Hispanic / Latino296 1.4% Hispanic or LatinoMoved from abroad 159 1.1% White34 1.7% Black or African American15 1.1% Asian261 2.2% Other race185 1.8% Two or more races69 0.5% White alone, not Hispanic / Latino587 2.7% Hispanic or Latino
Children Nativity (place of birth) in Kearny
Children under 6 years - Living with two parents Both parents native 427 100.0% Native0 0.0% Foreign-bornBoth parents foreign-born 914 99.2% Native8 0.8% Foreign-bornOne native, one foreign-born parent 282 100.0% NativeChildren under 6 years - Living with one parent Native parent 398 100.0% NativeForeign-born parent 666 93.2% Native49 6.8% Foreign-bornChildren 6 to 17 years - Living with two parents Both parents native 899 100.0% NativeBoth parents foreign-born 1,597 81.9% Native352 18.1% Foreign-bornOne native, one foreign-born parent 359 97.5% Native9 2.5% Foreign-bornChildren 6 to 17 years - Living with one parent Native parent 397 100.0% NativeForeign-born parent 1,206 62.1% Native735 37.9% Foreign-born
Place of birth for residents in Kearny 13,327 Americas13,303 Latin America9,547 South America4,083 Europe3,149 Southern Europe2,322 Caribbean1,433 Central America1,125 Asia729 Eastern Europe659 Africa442 Eastern Asia389 China363 South Central Asia347 Northern Africa254 South Eastern Asia144 Western Africa114 Northern Europe110 Eastern Africa65 Western Asia64 Western Europe56 Southern Africa24 Northern America2,954 Peru2,569 Ecuador2,161 Portugal2,149 Brazil1,596 Dominican Republic920 Spain918 Colombia639 Cuba507 Mexico496 Poland364 Uruguay326 El Salvador313 China273 Honduras244 Morocco238 Philippines219 Chile212 Venezuela199 Guatemala186 India110 Pakistan99 Russia99 Egypt91 Panama90 Senegal68 Italy58 Nepal58 Ireland57 Guyana56 South Africa52 Korea48 Nigeria48 Kuwait46 Taiwan44 Hungary41 Kenya37 Argentina35 Costa Rica34 Romania32 Scotland29 Hong Kong28 Germany24 Canada23 Bolivia23 United Kingdom22 Ukraine21 Switzerland17 Jamaica14 France11 Syria11 Croatia11 Bosnia and Herzegovina10 Bahamas9 Malaysia8 Bangladesh6 Vietnam5 Turkey4 Sudan
Grandparents responsible for own grandchildren in Kearny
Grandparents (30 to 59 years) White / Caucasian 8 6.5% Responsible for grandchildren109 93.5% Not responsible for grandchildrenBlack or African American 10 100.0% Not responsible for grandchildrenAsian 6 100.0% Not responsible for grandchildrenOther race 121 74.9% Responsible for grandchildren41 25.1% Not responsible for grandchildrenWhite alone, not Hispanic / Latino 9 8.0% Responsible for grandchildren104 92.0% Not responsible for grandchildrenHispanic or Latino 83 50.6% Responsible for grandchildren81 49.4% Not responsible for grandchildrenGrandparents (60 years and over) White / Caucasian 14 5.5% Responsible for grandchildren235 94.5% Not responsible for grandchildrenAsian 54 100.0% Not responsible for grandchildrenOther race 15 8.6% Responsible for grandchildren159 91.4% Not responsible for grandchildrenWhite alone, not Hispanic / Latino 16 8.8% Responsible for grandchildren161 91.2% Not responsible for grandchildrenHispanic or Latino 10 3.4% Responsible for grandchildren285 96.6% Not responsible for grandchildren