Races in Kirkwood, Missouri (MO) Detailed Stats
Data:
Races - White alone (%)
Races - White alone (% change since 2000)
Races - Black alone (%)
Races - Black alone (% change since 2000)
Races - American Indian alone (%)
Races - American Indian alone (% change since 2000)
Races - Asian alone (%)
Races - Asian alone (% change since 2000)
Races - Hispanic (%)
Races - Hispanic (% change since 2000)
Races - Native Hawaiian and Other Pacific Islander alone (%)
Races - Native Hawaiian and Other Pacific Islander alone (% change since 2000)
Races - Two or more races(%)
Races - Two or more races(% change since 2000)
Races - Other race alone (%)
Races - Other race alone (% change since 2000)
Racial diversity
Place of birth - Born in state of residence (%)
Place of birth - Born in state of residence (%) - White
Place of birth - Born in state of residence (%) - Black or African American
Place of birth - Born in state of residence (%) - Asian
Place of birth - Born in state of residence (%) - Hispanic or Latino
Place of birth - Born in state of residence (%) - American Indian and Alaska Native
Place of birth - Born in state of residence (%) - Multirace
Place of birth - Born in state of residence (%) - Other Race
Place of birth - Born in other state (%)
Place of birth - Born in other state (%) - White
Place of birth - Born in other state (%) - Black or African American
Place of birth - Born in other state (%) - Asian
Place of birth - Born in other state (%) - Hispanic or Latino
Place of birth - Born in other state (%) - American Indian and Alaska Native
Place of birth - Born in other state (%) - Multirace
Place of birth - Born in other state (%) - Other Race
Place of birth - Native, outside of US (%)
Place of birth - Native, outside of US (%) - White
Place of birth - Native, outside of US (%) - Black or African American
Place of birth - Native, outside of US (%) - Asian
Place of birth - Native, outside of US (%) - Hispanic or Latino
Place of birth - Native, outside of US (%) - American Indian and Alaska Native
Place of birth - Native, outside of US (%) - Multirace
Place of birth - Native, outside of US (%) - Other Race
Place of birth - Foreign born (%)
Place of birth - Foreign born (%) - White
Place of birth - Foreign born (%) - Black or African American
Place of birth - Foreign born (%) - Asian
Place of birth - Foreign born (%) - Hispanic or Latino
Place of birth - Foreign born (%) - American Indian and Alaska Native
Place of birth - Foreign born (%) - Multirace
Place of birth - Foreign born (%) - Other Race
Residents speaking English at home (%)
Residents speaking English at home - Born in the United States (%)
Residents speaking English at home - Native, born elsewhere (%)
Residents speaking English at home - Foreign born (%)
Residents speaking Spanish at home (%)
Residents speaking Spanish at home - Born in the United States (%)
Residents speaking Spanish at home - Native, born elsewhere (%)
Residents speaking Spanish at home - Foreign born (%)
Residents speaking other language at home (%)
Residents speaking other language at home - Born in the United States (%)
Residents speaking other language at home - Native, born elsewhere (%)
Residents speaking other language at home - Foreign born (%)
Marital status - Never married (%)
Marital status - Now married (%)
Marital status - Separated (%)
Marital status - Widowed (%)
Marital status - Divorced (%)
Ancestries Reported - Arab (%)
Ancestries Reported - Czech (%)
Ancestries Reported - Danish (%)
Ancestries Reported - Dutch (%)
Ancestries Reported - English (%)
Ancestries Reported - French (%)
Ancestries Reported - French Canadian (%)
Ancestries Reported - German (%)
Ancestries Reported - Greek (%)
Ancestries Reported - Hungarian (%)
Ancestries Reported - Irish (%)
Ancestries Reported - Italian (%)
Ancestries Reported - Lithuanian (%)
Ancestries Reported - Norwegian (%)
Ancestries Reported - Polish (%)
Ancestries Reported - Portuguese (%)
Ancestries Reported - Russian (%)
Ancestries Reported - Scotch-Irish (%)
Ancestries Reported - Scottish (%)
Ancestries Reported - Slovak (%)
Ancestries Reported - Subsaharan African (%)
Ancestries Reported - Swedish (%)
Ancestries Reported - Swiss (%)
Ancestries Reported - Ukrainian (%)
Ancestries Reported - United States (%)
Ancestries Reported - Welsh (%)
Ancestries Reported - West Indian (%)
Ancestries Reported - Other (%)
Geographical mobility - Same house 1 year ago (%)
Geographical mobility - Same house 1 year ago (%) - White
Geographical mobility - Same house 1 year ago (%) - Black or African American
Geographical mobility - Same house 1 year ago (%) - Asian
Geographical mobility - Same house 1 year ago (%) - Hispanic or Latino
Geographical mobility - Same house 1 year ago (%) - American Indian and Alaska Native
Geographical mobility - Same house 1 year ago (%) - Multirace
Geographical mobility - Same house 1 year ago (%) - Other Race
Geographical mobility - Moved within same county (%)
Geographical mobility - Moved within same county (%) - White
Geographical mobility - Moved within same county (%) - Black or African American
Geographical mobility - Moved within same county (%) - Asian
Geographical mobility - Moved within same county (%) - Hispanic or Latino
Geographical mobility - Moved within same county (%) - American Indian and Alaska Native
Geographical mobility - Moved within same county (%) - Multirace
Geographical mobility - Moved within same county (%) - Other Race
Geographical mobility - Moved from different county within same state (%)
Geographical mobility - Moved from different county within same state (%) - White
Geographical mobility - Moved from different county within same state (%) - Black or African American
Geographical mobility - Moved from different county within same state (%) - Asian
Geographical mobility - Moved from different county within same state (%) - Hispanic or Latino
Geographical mobility - Moved from different county within same state (%) - American Indian and Alaska Native
Geographical mobility - Moved from different county within same state (%) - Multirace
Geographical mobility - Moved from different county within same state (%) - Other Race
Geographical mobility - Moved from different state (%)
Geographical mobility - Moved from different state (%) - White
Geographical mobility - Moved from different state (%) - Black or African American
Geographical mobility - Moved from different state (%) - Asian
Geographical mobility - Moved from different state (%) - Hispanic or Latino
Geographical mobility - Moved from different state (%) - American Indian and Alaska Native
Geographical mobility - Moved from different state (%) - Multirace
Geographical mobility - Moved from different state (%) - Other Race
Geographical mobility - Moved from abroad (%)
Geographical mobility - Moved from abroad (%) - White
Geographical mobility - Moved from abroad (%) - Black or African American
Geographical mobility - Moved from abroad (%) - Asian
Geographical mobility - Moved from abroad (%) - Hispanic or Latino
Geographical mobility - Moved from abroad (%) - American Indian and Alaska Native
Geographical mobility - Moved from abroad (%) - Multirace
Geographical mobility - Moved from abroad (%) - Other Race
Place of birth for the foreign-born population - Ireland (%)
Place of birth for the foreign-born population - Denmark (%)
Place of birth for the foreign-born population - Norway (%)
Place of birth for the foreign-born population - Sweden (%)
Place of birth for the foreign-born population - United Kingdom (%)
Place of birth for the foreign-born population - England (%)
Place of birth for the foreign-born population - Scotland (%)
Place of birth for the foreign-born population - Other Northern Europe (%)
Place of birth for the foreign-born population - Austria (%)
Place of birth for the foreign-born population - Belgium (%)
Place of birth for the foreign-born population - France (%)
Place of birth for the foreign-born population - Germany (%)
Place of birth for the foreign-born population - Netherlands (%)
Place of birth for the foreign-born population - Switzerland (%)
Place of birth for the foreign-born population - Other Western Europe (%)
Place of birth for the foreign-born population - Greece (%)
Place of birth for the foreign-born population - Italy (%)
Place of birth for the foreign-born population - Portugal (%)
Place of birth for the foreign-born population - Spain (%)
Place of birth for the foreign-born population - Other Southern Europe (%)
Place of birth for the foreign-born population - Albania (%)
Place of birth for the foreign-born population - Belarus (%)
Place of birth for the foreign-born population - Bosnia and Herzegovina (%)
Place of birth for the foreign-born population - Bulgaria (%)
Place of birth for the foreign-born population - Croatia (%)
Place of birth for the foreign-born population - Czechoslovakia (%)
Place of birth for the foreign-born population - Hungary (%)
Place of birth for the foreign-born population - Latvia (%)
Place of birth for the foreign-born population - Lithuania (%)
Place of birth for the foreign-born population - North Macedonia (Macedonia) (%)
Place of birth for the foreign-born population - Moldova (%)
Place of birth for the foreign-born population - Poland (%)
Place of birth for the foreign-born population - Romania (%)
Place of birth for the foreign-born population - Russia (%)
Place of birth for the foreign-born population - Serbia (%)
Place of birth for the foreign-born population - Ukraine (%)
Place of birth for the foreign-born population - Other Eastern Europe (%)
Place of birth for the foreign-born population - China (%)
Place of birth for the foreign-born population - Hong Kong (%)
Place of birth for the foreign-born population - Taiwan (%)
Place of birth for the foreign-born population - Japan (%)
Place of birth for the foreign-born population - Korea (%)
Place of birth for the foreign-born population - Other Eastern Asia (%)
Place of birth for the foreign-born population - Afghanistan (%)
Place of birth for the foreign-born population - Bangladesh (%)
Place of birth for the foreign-born population - India (%)
Place of birth for the foreign-born population - Iran (%)
Place of birth for the foreign-born population - Kazakhstan (%)
Place of birth for the foreign-born population - Nepal (%)
Place of birth for the foreign-born population - Pakistan (%)
Place of birth for the foreign-born population - Sri Lanka (%)
Place of birth for the foreign-born population - Uzbekistan (%)
Place of birth for the foreign-born population - Other South Central Asia (%)
Place of birth for the foreign-born population - Burma (%)
Place of birth for the foreign-born population - Cambodia (%)
Place of birth for the foreign-born population - Indonesia (%)
Place of birth for the foreign-born population - Laos (%)
Place of birth for the foreign-born population - Malaysia (%)
Place of birth for the foreign-born population - Philippines (%)
Place of birth for the foreign-born population - Singapore (%)
Place of birth for the foreign-born population - Thailand (%)
Place of birth for the foreign-born population - Vietnam (%)
Place of birth for the foreign-born population - Other South Eastern Asia (%)
Place of birth for the foreign-born population - Armenia (%)
Place of birth for the foreign-born population - Iraq (%)
Place of birth for the foreign-born population - Israel (%)
Place of birth for the foreign-born population - Jordan (%)
Place of birth for the foreign-born population - Kuwait (%)
Place of birth for the foreign-born population - Lebanon (%)
Place of birth for the foreign-born population - Saudi Arabia (%)
Place of birth for the foreign-born population - Syria (%)
Place of birth for the foreign-born population - Turkey (%)
Place of birth for the foreign-born population - Yemen (%)
Place of birth for the foreign-born population - Other Western Asia (%)
Place of birth for the foreign-born population - Eritrea (%)
Place of birth for the foreign-born population - Ethiopia (%)
Place of birth for the foreign-born population - Kenya (%)
Place of birth for the foreign-born population - Somalia (%)
Place of birth for the foreign-born population - Uganda (%)
Place of birth for the foreign-born population - Zimbabwe (%)
Place of birth for the foreign-born population - Other Eastern Africa (%)
Place of birth for the foreign-born population - Cameroon (%)
Place of birth for the foreign-born population - Congo (%)
Place of birth for the foreign-born population - Democratic Republic of Congo (Zaire) (%)
Place of birth for the foreign-born population - Other Middle Africa (%)
Place of birth for the foreign-born population - Egypt (%)
Place of birth for the foreign-born population - Morocco (%)
Place of birth for the foreign-born population - Sudan (%)
Place of birth for the foreign-born population - Other Northern Africa (%)
Place of birth for the foreign-born population - South Africa (%)
Place of birth for the foreign-born population - Other Southern Africa (%)
Place of birth for the foreign-born population - Cabo Verde (%)
Place of birth for the foreign-born population - Ghana (%)
Place of birth for the foreign-born population - Liberia (%)
Place of birth for the foreign-born population - Nigeria (%)
Place of birth for the foreign-born population - Senegal (%)
Place of birth for the foreign-born population - Sierra Leone (%)
Place of birth for the foreign-born population - Other Western Africa (%)
Place of birth for the foreign-born population - Australia (%)
Place of birth for the foreign-born population - New Zealand (%)
Place of birth for the foreign-born population - Fiji (%)
Place of birth for the foreign-born population - Micronesia (%)
Place of birth for the foreign-born population - Bahamas (%)
Place of birth for the foreign-born population - Barbados (%)
Place of birth for the foreign-born population - Cuba (%)
Place of birth for the foreign-born population - Dominica (%)
Place of birth for the foreign-born population - Dominican Republic (%)
Place of birth for the foreign-born population - Grenada (%)
Place of birth for the foreign-born population - Haiti (%)
Place of birth for the foreign-born population - Jamaica (%)
Place of birth for the foreign-born population - St. Vincent and the Grenadines (%)
Place of birth for the foreign-born population - Trinidad and Tobago (%)
Place of birth for the foreign-born population - West Indies (%)
Place of birth for the foreign-born population - Other Caribbean (%)
Place of birth for the foreign-born population - Belize (%)
Place of birth for the foreign-born population - Costa Rica (%)
Place of birth for the foreign-born population - El Salvador (%)
Place of birth for the foreign-born population - Guatemala (%)
Place of birth for the foreign-born population - Honduras (%)
Place of birth for the foreign-born population - Mexico (%)
Place of birth for the foreign-born population - Nicaragua (%)
Place of birth for the foreign-born population - Panama (%)
Place of birth for the foreign-born population - Other Central America (%)
Place of birth for the foreign-born population - Argentina (%)
Place of birth for the foreign-born population - Bolivia (%)
Place of birth for the foreign-born population - Brazil (%)
Place of birth for the foreign-born population - Chile (%)
Place of birth for the foreign-born population - Colombia (%)
Place of birth for the foreign-born population - Ecuador (%)
Place of birth for the foreign-born population - Guyana (%)
Place of birth for the foreign-born population - Peru (%)
Place of birth for the foreign-born population - Uruguay (%)
Place of birth for the foreign-born population - Venezuela (%)
Place of birth for the foreign-born population - Other South America (%)
Place of birth for the foreign-born population - Canada (%)
Place of birth for the foreign-born population - Other Northern America (%)
Place of birth for the foreign-born population - Other (%)
Latest news about races in Kirkwood, MO collected exclusively by city-data.com from local newspapers, TV, and radio stations
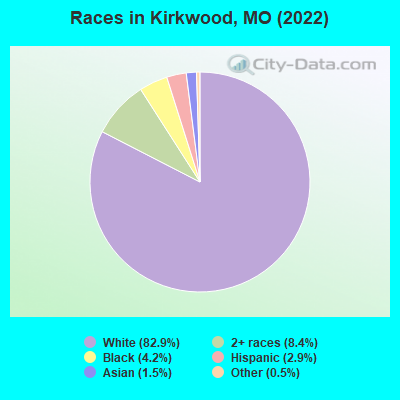
According to 2022 data, the most numerous races in Kirkwood, MO are White alone (24,076 residents), Black alone (1,221 residents), and Two or more races (2,446 residents). 95.2% of Kirkwood residents speak English at home. 3.3% of Kirkwood, MO residents are foreign-born (1.6% born in Europe, 1.1% born in Asia, 0.4% born in Latin America), which is 21.0% less than the foreign-born rate of 4.0% across the entire state of Missouri.
Race distribution in Kirkwood
2000 2022
4,686,474 83.8% White alone 625,667 11.2% Black alone 118,592 2.1% Hispanic 71,905 1.3% Two or more races 61,041 1.1% Asian alone 23,302 0.4% American Indian alone 5,291 0.09% Other race alone 2,939 0.05% Native Hawaiian and Other
4,733,411 76.6% White alone 656,739 10.6% Black alone 316,300 5.1% Two or more races 291,763 4.7% Hispanic 132,436 2.1% Asian alone 27,467 0.4% Other race alone 12,313 0.2% American Indian alone 7,528 0.1% Native Hawaiian and Other
Income and house value in Kirkwood Median household income in 2022 $116,505 White non-Hispanic householders$46,428 Black householders$121,337 Asian householders$121,421 Two or more races householdersMedian 2022 house value $435,195 White Non-Hispanic householders$229,495 Black or African American householders $586,694 Asian householders$400,824 Two or more races householders$420,653 Hispanic or Latino householders
Median age by race in Kirkwood
43.7 Median age for White residents40.2 46.1 53.6 Median age for Black or African American residents47.2 56.8 -520,187,792.9 Median age for American Indian / Alaska Native residents-644,003,776.5 -505,494,505.0 43.7 Median age for Asian residents42.4 45.5 -710,303,029.6 Median age for Native Hawaiian / Pacific Islander residents-1,449,781,657.9 -752,136,751.4 33.8 Median age for Other race residents33.3 35.6 21.8 Median age for Two or more races residents25.0 16.7 44.0 Median age for White alone residents40.9 46.4 18.0 Median age for Hispanic or Latino residents12.4 28.5
Owner/renter occupied households by race in Kirkwood
House owners and renters - White residents 8,154 77.2% Owner occupied2,405 22.8% Renter occupiedHouse owners and renters - Black or African American residents 220 43.1% Owner occupied291 56.9% Renter occupiedHouse owners and renters - American Indian / Alaska Native residents 5 100.0% Renter occupiedHouse owners and renters - Asian residents 126 71.3% Owner occupied51 28.7% Renter occupiedHouse owners and renters - Native Hawaiian / Pacific Islander residents 3 100.0% Owner occupiedHouse owners and renters - Other race residents 68 98.7% Owner occupied1 1.3% Renter occupiedHouse owners and renters - Two or more races residents 438 56.5% Owner occupied338 43.5% Renter occupiedHouse owners and renters - White alone residents 8,066 77.1% Owner occupied2,391 22.9% Renter occupiedHouse owners and renters - Hispanic or Latino residents 204 81.4% Owner occupied47 18.6% Renter occupied
Language usage in Kirkwood
English speakers - Total 95.2% of residents of Kirkwood speak English at home.
1.5% of residents speak Spanish at home 280 70.0% Speak English very well120 30.0% Speak English less than very well3.3% of residents speak other language at home 671 74.8% Speak English very well226 25.2% Speak English less than very well
English speakers - Born in the United States 95.5% of residents of Kirkwood speak English at home.
1.8% of residents speak Spanish at home 108 75.5% Speak English very well35 24.5% Speak English less than very well2.8% of residents speak other language at home 176 80.0% Speak English very well44 20.0% Speak English less than very well
English speakers - Native, born elsewhere 59.8% of residents of Kirkwood speak English at home.
33.1% of residents speak Spanish at home 79 100.0% Speak English very well1.3% of residents speak other language at home 3 100.0% Speak English very well
English speakers - Foreign-born 42.2% of residents of Kirkwood speak English at home.
8.5% of residents speak Spanish at home 35 42.7% Speak English very well47 57.3% Speak English less than very well50.6% of residents speak other language at home 340 69.7% Speak English very well148 30.3% Speak English less than very well
White (Caucasian) - Speak only English Native:
97.9% (22,043)Foreign-born:
31.3% (150)
White (Caucasian) - Speak another language Native:
2.1% (473)Foreign-born:
66.8% (319)
Black or African American - Speak only English Native:
98.8% (1,173)Foreign-born:
100.0% (26)
Black or African American - Speak another language Native:
0.4% (5)Foreign-born:
4.2% (1)
Asian - Speak only English Native:
55.0% (76)Foreign-born:
46.5% (133)
Asian - Speak another language Native:
44.8% (62)Foreign-born:
62.0% (178)
Other race - Speak only English Native:
100.0% (132)Foreign-born:
100.0% (51)
Other race - Speak another language Native:
13.4% (18)Foreign-born:
12.7% (6)
Two or more races - Speak only English Native:
93.0% (2,506)Foreign-born:
20.9% (22)
Two or more races - Speak another language Native:
6.8% (183)Foreign-born:
71.1% (74)
White alone - Speak only English Native:
98.3% (21,925)Foreign-born:
32.6% (153)
White alone - Speak another language Native:
1.7% (388)Foreign-born:
65.4% (308)
Hispanic or Latino - Speak only English Native:
79.3% (526)Foreign-born:
31.0% (40)
Hispanic or Latino - Speak another language Native:
23.8% (158)Foreign-born:
64.5% (84)
Foreign-born residents in Kirkwood 960 residents are foreign born (1.6% Europe , 1.1% Asia , 0.4% Latin America ).
This city:
3.3%Missouri:
4.2%
Marital status for residents in Kirkwood Marital status - White (Caucasian) population 15 years and over
Males 26.8% Never married63.3% Now married0.3% Separated2.7% Widowed6.8% DivorcedFemales 23.9% Never married51.5% Now married1.7% Separated9.3% Widowed13.7% DivorcedWomen who gave birth in the past 12 months Now married:
100.0% (229)Unmarried:
0.0% (0)
Women who did not give birth in the past 12 months Now married:
50.3% (2,588)Unmarried:
49.7% (2,559)
Marital status - Black or African American population 15 years and over
Males 37.7% Never married44.7% Now married0.0% Separated6.1% Widowed11.5% DivorcedFemales 34.5% Never married31.6% Now married0.0% Separated9.5% Widowed24.3% DivorcedWomen who gave birth in the past 12 months Now married:
100.0% (12)Unmarried:
0.0% (0)
Women who did not give birth in the past 12 months Now married:
9.3% (18)Unmarried:
90.7% (174)
Marital status - American Indian / Alaska Native population 15 years and over
Males 0.0% Never married100.0% Now married0.0% Separated0.0% Widowed0.0% DivorcedFemales 100.0% Never married0.0% Now married0.0% Separated0.0% Widowed0.0% DivorcedWomen who did not give birth in the past 12 months Now married:
0.0% (0)Unmarried:
100.0% (8)
Marital status - Asian population 15 years and over
Males 38.7% Never married61.3% Now married0.0% Separated0.0% Widowed0.0% DivorcedFemales 10.5% Never married80.1% Now married0.0% Separated9.4% Widowed0.0% DivorcedWomen who did not give birth in the past 12 months Now married:
86.4% (121)Unmarried:
13.6% (19)
Marital status - Other race population 15 years and over
Males 26.1% Never married50.0% Now married0.0% Separated0.0% Widowed23.9% DivorcedFemales 34.7% Never married56.0% Now married0.0% Separated0.0% Widowed9.3% DivorcedWomen who gave birth in the past 12 months Now married:
100.0% (8)Unmarried:
0.0% (0)
Women who did not give birth in the past 12 months Now married:
21.2% (8)Unmarried:
78.8% (28)
Marital status - Two or more races population 15 years and over
Males 51.8% Never married47.3% Now married0.0% Separated0.0% Widowed0.9% DivorcedFemales 54.5% Never married38.9% Now married4.4% Separated0.0% Widowed2.2% DivorcedWomen who gave birth in the past 12 months Now married:
100.0% (16)Unmarried:
0.0% (0)
Women who did not give birth in the past 12 months Now married:
34.5% (304)Unmarried:
65.5% (576)
Marital status - White alone, not Hispanic / Latino population 15 years and over
Males 26.7% Never married63.3% Now married0.3% Separated2.7% Widowed6.9% DivorcedFemales 23.3% Never married51.7% Now married1.7% Separated9.4% Widowed13.9% DivorcedWomen who gave birth in the past 12 months Now married:
100.0% (231)Unmarried:
0.0% (0)
Women who did not give birth in the past 12 months Now married:
50.8% (2,560)Unmarried:
49.2% (2,478)
Marital status - Hispanic or Latino population 15 years and over
Males 46.8% Never married53.2% Now married0.0% Separated0.0% Widowed0.0% DivorcedFemales 58.2% Never married30.1% Now married4.3% Separated1.7% Widowed5.7% DivorcedWomen who gave birth in the past 12 months Now married:
100.0% (20)Unmarried:
0.0% (0)
Women who did not give birth in the past 12 months Now married:
32.3% (98)Unmarried:
67.7% (205)
Ancestries in Kirkwood
2,960 23.9% German1,560 12.6% Irish1,532 12.4% English1,297 10.5% American805 6.5% European527 4.3% Italian251 2.0% Scottish198 1.6% Polish154 1.2% French146 1.2% Scotch-Irish105 0.8% Dutch105 0.8% Eastern European97 0.8% Yugoslavian91 0.7% Welsh76 0.6% Czechoslovakian58 0.5% Romanian49 0.4% Northern European48 0.4% Czech47 0.4% Swedish44 0.4% Danish42 0.3% Russian30 0.2% Croatian28 0.2% Scandinavian27 0.2% African25 0.2% British25 0.2% Slovak21 0.2% Portuguese21 0.2% Serbian20 0.2% Greek20 0.2% Norwegian20 0.2% Hungarian19 0.2% Latvian19 0.2% Belgian12 0.10% Canadian12 0.10% Bulgarian12 0.10% Lebanese12 0.10% Ethiopian11 0.09% Luxembourger10 0.08% Pennsylvania German8 0.06% Israeli8 0.06% Austrian8 0.06% Armenian7 0.06% Nigerian
Geographical mobility in Kirkwood Same house 1 year ago 21,000 87.3% White (Caucasian)1,168 93.8% Black or African American13 100.0% American Indian / Alaska Native418 95.9% Asian3 100.0% Native Hawaiian / Pacific Islander167 88.1% Other race2,799 93.7% Two or more races20,833 87.4% White alone, not Hispanic / Latino688 82.0% Hispanic or LatinoMoved within same county 1,551 6.4% White / Caucasian23 1.9% Black or African American17 3.9% Asian10 5.1% Other race105 3.5% Two or more races1,533 6.4% White alone, not Hispanic / Latino92 10.9% Hispanic or LatinoMoved within same state 640 2.7% White / Caucasian10 0.8% Black or African American63 2.1% Two or more races612 2.6% White alone, not Hispanic / Latino27 3.3% Hispanic or LatinoMoved from different state 758 3.2% White / Caucasian30 2.4% Black or African American9 2.1% Asian9 4.8% Other race37 1.2% Two or more races760 3.2% White alone, not Hispanic / LatinoMoved from abroad 61 0.3% White29 2.3% Black or African American63 0.3% White alone, not Hispanic / Latino
Children Nativity (place of birth) in Kirkwood
Children under 6 years - Living with two parents Both parents native 1,653 99.2% Native13 0.8% Foreign-bornBoth parents foreign-born 17 100.0% NativeOne native, one foreign-born parent 150 100.0% NativeChildren under 6 years - Living with one parent Native parent 194 100.0% NativeChildren 6 to 17 years - Living with two parents Both parents native 3,667 97.5% Native95 2.5% Foreign-bornBoth parents foreign-born 81 86.6% Native13 13.4% Foreign-bornOne native, one foreign-born parent 273 94.3% Native16 5.7% Foreign-bornChildren 6 to 17 years - Living with one parent Native parent 1,099 100.0% NativeForeign-born parent 51 48.6% Native54 51.4% Foreign-born
Grandparents responsible for own grandchildren in Kirkwood
Grandparents (30 to 59 years) White / Caucasian 3 14.8% Responsible for grandchildren16 85.2% Not responsible for grandchildrenWhite alone, not Hispanic / Latino 3 15.6% Responsible for grandchildren16 84.4% Not responsible for grandchildrenGrandparents (60 years and over) White / Caucasian 21 28.0% Responsible for grandchildren54 72.0% Not responsible for grandchildrenWhite alone, not Hispanic / Latino 21 27.6% Responsible for grandchildren55 72.4% Not responsible for grandchildren