Races in Laplace, Louisiana (LA) Detailed Stats
Data:
Races - White alone (%)
Races - White alone (% change since 2000)
Races - Black alone (%)
Races - Black alone (% change since 2000)
Races - American Indian alone (%)
Races - American Indian alone (% change since 2000)
Races - Asian alone (%)
Races - Asian alone (% change since 2000)
Races - Hispanic (%)
Races - Hispanic (% change since 2000)
Races - Native Hawaiian and Other Pacific Islander alone (%)
Races - Native Hawaiian and Other Pacific Islander alone (% change since 2000)
Races - Two or more races(%)
Races - Two or more races(% change since 2000)
Races - Other race alone (%)
Races - Other race alone (% change since 2000)
Racial diversity
Place of birth - Born in state of residence (%)
Place of birth - Born in state of residence (%) - White
Place of birth - Born in state of residence (%) - Black or African American
Place of birth - Born in state of residence (%) - Asian
Place of birth - Born in state of residence (%) - Hispanic or Latino
Place of birth - Born in state of residence (%) - American Indian and Alaska Native
Place of birth - Born in state of residence (%) - Multirace
Place of birth - Born in state of residence (%) - Other Race
Place of birth - Born in other state (%)
Place of birth - Born in other state (%) - White
Place of birth - Born in other state (%) - Black or African American
Place of birth - Born in other state (%) - Asian
Place of birth - Born in other state (%) - Hispanic or Latino
Place of birth - Born in other state (%) - American Indian and Alaska Native
Place of birth - Born in other state (%) - Multirace
Place of birth - Born in other state (%) - Other Race
Place of birth - Native, outside of US (%)
Place of birth - Native, outside of US (%) - White
Place of birth - Native, outside of US (%) - Black or African American
Place of birth - Native, outside of US (%) - Asian
Place of birth - Native, outside of US (%) - Hispanic or Latino
Place of birth - Native, outside of US (%) - American Indian and Alaska Native
Place of birth - Native, outside of US (%) - Multirace
Place of birth - Native, outside of US (%) - Other Race
Place of birth - Foreign born (%)
Place of birth - Foreign born (%) - White
Place of birth - Foreign born (%) - Black or African American
Place of birth - Foreign born (%) - Asian
Place of birth - Foreign born (%) - Hispanic or Latino
Place of birth - Foreign born (%) - American Indian and Alaska Native
Place of birth - Foreign born (%) - Multirace
Place of birth - Foreign born (%) - Other Race
Residents speaking English at home (%)
Residents speaking English at home - Born in the United States (%)
Residents speaking English at home - Native, born elsewhere (%)
Residents speaking English at home - Foreign born (%)
Residents speaking Spanish at home (%)
Residents speaking Spanish at home - Born in the United States (%)
Residents speaking Spanish at home - Native, born elsewhere (%)
Residents speaking Spanish at home - Foreign born (%)
Residents speaking other language at home (%)
Residents speaking other language at home - Born in the United States (%)
Residents speaking other language at home - Native, born elsewhere (%)
Residents speaking other language at home - Foreign born (%)
Marital status - Never married (%)
Marital status - Now married (%)
Marital status - Separated (%)
Marital status - Widowed (%)
Marital status - Divorced (%)
Ancestries Reported - Arab (%)
Ancestries Reported - Czech (%)
Ancestries Reported - Danish (%)
Ancestries Reported - Dutch (%)
Ancestries Reported - English (%)
Ancestries Reported - French (%)
Ancestries Reported - French Canadian (%)
Ancestries Reported - German (%)
Ancestries Reported - Greek (%)
Ancestries Reported - Hungarian (%)
Ancestries Reported - Irish (%)
Ancestries Reported - Italian (%)
Ancestries Reported - Lithuanian (%)
Ancestries Reported - Norwegian (%)
Ancestries Reported - Polish (%)
Ancestries Reported - Portuguese (%)
Ancestries Reported - Russian (%)
Ancestries Reported - Scotch-Irish (%)
Ancestries Reported - Scottish (%)
Ancestries Reported - Slovak (%)
Ancestries Reported - Subsaharan African (%)
Ancestries Reported - Swedish (%)
Ancestries Reported - Swiss (%)
Ancestries Reported - Ukrainian (%)
Ancestries Reported - United States (%)
Ancestries Reported - Welsh (%)
Ancestries Reported - West Indian (%)
Ancestries Reported - Other (%)
Geographical mobility - Same house 1 year ago (%)
Geographical mobility - Same house 1 year ago (%) - White
Geographical mobility - Same house 1 year ago (%) - Black or African American
Geographical mobility - Same house 1 year ago (%) - Asian
Geographical mobility - Same house 1 year ago (%) - Hispanic or Latino
Geographical mobility - Same house 1 year ago (%) - American Indian and Alaska Native
Geographical mobility - Same house 1 year ago (%) - Multirace
Geographical mobility - Same house 1 year ago (%) - Other Race
Geographical mobility - Moved within same county (%)
Geographical mobility - Moved within same county (%) - White
Geographical mobility - Moved within same county (%) - Black or African American
Geographical mobility - Moved within same county (%) - Asian
Geographical mobility - Moved within same county (%) - Hispanic or Latino
Geographical mobility - Moved within same county (%) - American Indian and Alaska Native
Geographical mobility - Moved within same county (%) - Multirace
Geographical mobility - Moved within same county (%) - Other Race
Geographical mobility - Moved from different county within same state (%)
Geographical mobility - Moved from different county within same state (%) - White
Geographical mobility - Moved from different county within same state (%) - Black or African American
Geographical mobility - Moved from different county within same state (%) - Asian
Geographical mobility - Moved from different county within same state (%) - Hispanic or Latino
Geographical mobility - Moved from different county within same state (%) - American Indian and Alaska Native
Geographical mobility - Moved from different county within same state (%) - Multirace
Geographical mobility - Moved from different county within same state (%) - Other Race
Geographical mobility - Moved from different state (%)
Geographical mobility - Moved from different state (%) - White
Geographical mobility - Moved from different state (%) - Black or African American
Geographical mobility - Moved from different state (%) - Asian
Geographical mobility - Moved from different state (%) - Hispanic or Latino
Geographical mobility - Moved from different state (%) - American Indian and Alaska Native
Geographical mobility - Moved from different state (%) - Multirace
Geographical mobility - Moved from different state (%) - Other Race
Geographical mobility - Moved from abroad (%)
Geographical mobility - Moved from abroad (%) - White
Geographical mobility - Moved from abroad (%) - Black or African American
Geographical mobility - Moved from abroad (%) - Asian
Geographical mobility - Moved from abroad (%) - Hispanic or Latino
Geographical mobility - Moved from abroad (%) - American Indian and Alaska Native
Geographical mobility - Moved from abroad (%) - Multirace
Geographical mobility - Moved from abroad (%) - Other Race
Place of birth for the foreign-born population - Ireland (%)
Place of birth for the foreign-born population - Denmark (%)
Place of birth for the foreign-born population - Norway (%)
Place of birth for the foreign-born population - Sweden (%)
Place of birth for the foreign-born population - United Kingdom (%)
Place of birth for the foreign-born population - England (%)
Place of birth for the foreign-born population - Scotland (%)
Place of birth for the foreign-born population - Other Northern Europe (%)
Place of birth for the foreign-born population - Austria (%)
Place of birth for the foreign-born population - Belgium (%)
Place of birth for the foreign-born population - France (%)
Place of birth for the foreign-born population - Germany (%)
Place of birth for the foreign-born population - Netherlands (%)
Place of birth for the foreign-born population - Switzerland (%)
Place of birth for the foreign-born population - Other Western Europe (%)
Place of birth for the foreign-born population - Greece (%)
Place of birth for the foreign-born population - Italy (%)
Place of birth for the foreign-born population - Portugal (%)
Place of birth for the foreign-born population - Spain (%)
Place of birth for the foreign-born population - Other Southern Europe (%)
Place of birth for the foreign-born population - Albania (%)
Place of birth for the foreign-born population - Belarus (%)
Place of birth for the foreign-born population - Bosnia and Herzegovina (%)
Place of birth for the foreign-born population - Bulgaria (%)
Place of birth for the foreign-born population - Croatia (%)
Place of birth for the foreign-born population - Czechoslovakia (%)
Place of birth for the foreign-born population - Hungary (%)
Place of birth for the foreign-born population - Latvia (%)
Place of birth for the foreign-born population - Lithuania (%)
Place of birth for the foreign-born population - North Macedonia (Macedonia) (%)
Place of birth for the foreign-born population - Moldova (%)
Place of birth for the foreign-born population - Poland (%)
Place of birth for the foreign-born population - Romania (%)
Place of birth for the foreign-born population - Russia (%)
Place of birth for the foreign-born population - Serbia (%)
Place of birth for the foreign-born population - Ukraine (%)
Place of birth for the foreign-born population - Other Eastern Europe (%)
Place of birth for the foreign-born population - China (%)
Place of birth for the foreign-born population - Hong Kong (%)
Place of birth for the foreign-born population - Taiwan (%)
Place of birth for the foreign-born population - Japan (%)
Place of birth for the foreign-born population - Korea (%)
Place of birth for the foreign-born population - Other Eastern Asia (%)
Place of birth for the foreign-born population - Afghanistan (%)
Place of birth for the foreign-born population - Bangladesh (%)
Place of birth for the foreign-born population - India (%)
Place of birth for the foreign-born population - Iran (%)
Place of birth for the foreign-born population - Kazakhstan (%)
Place of birth for the foreign-born population - Nepal (%)
Place of birth for the foreign-born population - Pakistan (%)
Place of birth for the foreign-born population - Sri Lanka (%)
Place of birth for the foreign-born population - Uzbekistan (%)
Place of birth for the foreign-born population - Other South Central Asia (%)
Place of birth for the foreign-born population - Burma (%)
Place of birth for the foreign-born population - Cambodia (%)
Place of birth for the foreign-born population - Indonesia (%)
Place of birth for the foreign-born population - Laos (%)
Place of birth for the foreign-born population - Malaysia (%)
Place of birth for the foreign-born population - Philippines (%)
Place of birth for the foreign-born population - Singapore (%)
Place of birth for the foreign-born population - Thailand (%)
Place of birth for the foreign-born population - Vietnam (%)
Place of birth for the foreign-born population - Other South Eastern Asia (%)
Place of birth for the foreign-born population - Armenia (%)
Place of birth for the foreign-born population - Iraq (%)
Place of birth for the foreign-born population - Israel (%)
Place of birth for the foreign-born population - Jordan (%)
Place of birth for the foreign-born population - Kuwait (%)
Place of birth for the foreign-born population - Lebanon (%)
Place of birth for the foreign-born population - Saudi Arabia (%)
Place of birth for the foreign-born population - Syria (%)
Place of birth for the foreign-born population - Turkey (%)
Place of birth for the foreign-born population - Yemen (%)
Place of birth for the foreign-born population - Other Western Asia (%)
Place of birth for the foreign-born population - Eritrea (%)
Place of birth for the foreign-born population - Ethiopia (%)
Place of birth for the foreign-born population - Kenya (%)
Place of birth for the foreign-born population - Somalia (%)
Place of birth for the foreign-born population - Uganda (%)
Place of birth for the foreign-born population - Zimbabwe (%)
Place of birth for the foreign-born population - Other Eastern Africa (%)
Place of birth for the foreign-born population - Cameroon (%)
Place of birth for the foreign-born population - Congo (%)
Place of birth for the foreign-born population - Democratic Republic of Congo (Zaire) (%)
Place of birth for the foreign-born population - Other Middle Africa (%)
Place of birth for the foreign-born population - Egypt (%)
Place of birth for the foreign-born population - Morocco (%)
Place of birth for the foreign-born population - Sudan (%)
Place of birth for the foreign-born population - Other Northern Africa (%)
Place of birth for the foreign-born population - South Africa (%)
Place of birth for the foreign-born population - Other Southern Africa (%)
Place of birth for the foreign-born population - Cabo Verde (%)
Place of birth for the foreign-born population - Ghana (%)
Place of birth for the foreign-born population - Liberia (%)
Place of birth for the foreign-born population - Nigeria (%)
Place of birth for the foreign-born population - Senegal (%)
Place of birth for the foreign-born population - Sierra Leone (%)
Place of birth for the foreign-born population - Other Western Africa (%)
Place of birth for the foreign-born population - Australia (%)
Place of birth for the foreign-born population - New Zealand (%)
Place of birth for the foreign-born population - Fiji (%)
Place of birth for the foreign-born population - Micronesia (%)
Place of birth for the foreign-born population - Bahamas (%)
Place of birth for the foreign-born population - Barbados (%)
Place of birth for the foreign-born population - Cuba (%)
Place of birth for the foreign-born population - Dominica (%)
Place of birth for the foreign-born population - Dominican Republic (%)
Place of birth for the foreign-born population - Grenada (%)
Place of birth for the foreign-born population - Haiti (%)
Place of birth for the foreign-born population - Jamaica (%)
Place of birth for the foreign-born population - St. Vincent and the Grenadines (%)
Place of birth for the foreign-born population - Trinidad and Tobago (%)
Place of birth for the foreign-born population - West Indies (%)
Place of birth for the foreign-born population - Other Caribbean (%)
Place of birth for the foreign-born population - Belize (%)
Place of birth for the foreign-born population - Costa Rica (%)
Place of birth for the foreign-born population - El Salvador (%)
Place of birth for the foreign-born population - Guatemala (%)
Place of birth for the foreign-born population - Honduras (%)
Place of birth for the foreign-born population - Mexico (%)
Place of birth for the foreign-born population - Nicaragua (%)
Place of birth for the foreign-born population - Panama (%)
Place of birth for the foreign-born population - Other Central America (%)
Place of birth for the foreign-born population - Argentina (%)
Place of birth for the foreign-born population - Bolivia (%)
Place of birth for the foreign-born population - Brazil (%)
Place of birth for the foreign-born population - Chile (%)
Place of birth for the foreign-born population - Colombia (%)
Place of birth for the foreign-born population - Ecuador (%)
Place of birth for the foreign-born population - Guyana (%)
Place of birth for the foreign-born population - Peru (%)
Place of birth for the foreign-born population - Uruguay (%)
Place of birth for the foreign-born population - Venezuela (%)
Place of birth for the foreign-born population - Other South America (%)
Place of birth for the foreign-born population - Canada (%)
Place of birth for the foreign-born population - Other Northern America (%)
Place of birth for the foreign-born population - Other (%)
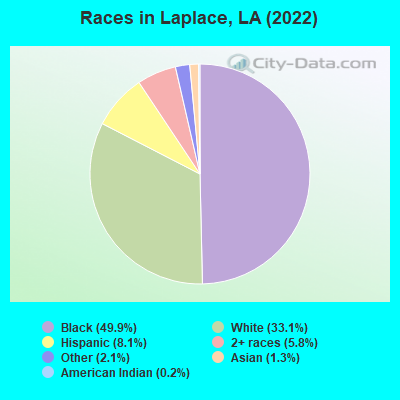
According to 2022 data, the most numerous races in Laplace, LA are White alone (9,476 residents), Black alone (14,298 residents), and Hispanic (2,309 residents). 91.8% of Laplace residents speak English at home. 6.2% of Laplace, LA residents are foreign-born (4.0% born in Latin America, 0.8% born in Africa, 0.7% born in Asia), which is 35.2% greater than the foreign-born rate of 4.0% across the entire state of Louisiana.
Race distribution in Laplace
2000 2022
2,794,391 62.5% White alone 1,443,390 32.3% Black alone 107,738 2.4% Hispanic 54,256 1.2% Asian alone 39,260 0.9% Two or more races 24,129 0.5% American Indian alone 4,736 0.1% Other race alone 1,076 0.02% Native Hawaiian and Other
2,603,221 56.7% White alone 1,420,055 30.9% Black alone 262,213 5.7% Hispanic 183,270 4.0% Two or more races 81,169 1.8% Asian alone 19,991 0.4% American Indian alone 18,043 0.4% Other race alone 2,279 0.05% Native Hawaiian and Other
Income and house value in Laplace Median household income in 2022 $69,071 White non-Hispanic householders$60,840 Black householders$57,207 Some other race householders$95,503 Two or more races householders$93,854 Hispanic or Latino race householdersMedian 2022 house value $209,178 White Non-Hispanic householders$175,965 Black or African American householders$151,549 American Indian or Alaska Native householders $295,621 Asian householders$157,928 Some other race householders$216,877 Two or more races householders$168,266 Hispanic or Latino householders
Median age by race in Laplace
49.1 Median age for White residents49.9 48.6 35.2 Median age for Black or African American residents32.9 38.9 63.1 Median age for American Indian / Alaska Native residents61.6 -781,341,107.1 23.2 Median age for Asian residents31.1 23.1 -821,138,210.6 Median age for Native Hawaiian / Pacific Islander residents-868,167,201.7 -599,999,999.4 21.5 Median age for Other race residents32.4 15.9 26.0 Median age for Two or more races residents18.1 50.9 50.9 Median age for White alone residents51.8 49.4 33.2 Median age for Hispanic or Latino residents32.3 34.7
Owner/renter occupied households by race in Laplace
House owners and renters - White residents 3,888 88.9% Owner occupied486 11.1% Renter occupiedHouse owners and renters - Black or African American residents 3,795 71.7% Owner occupied1,501 28.3% Renter occupiedHouse owners and renters - American Indian / Alaska Native residents 24 38.9% Owner occupied38 61.1% Renter occupiedHouse owners and renters - Asian residents 15 39.8% Owner occupied22 60.2% Renter occupiedHouse owners and renters - Other race residents 148 33.8% Owner occupied289 66.2% Renter occupiedHouse owners and renters - Two or more races residents 653 89.8% Owner occupied74 10.2% Renter occupiedHouse owners and renters - White alone residents 3,736 88.1% Owner occupied505 11.9% Renter occupiedHouse owners and renters - Hispanic or Latino residents 437 67.8% Owner occupied208 32.2% Renter occupied
Language usage in Laplace
English speakers - Total 91.8% of residents of Laplace speak English at home.
5.4% of residents speak Spanish at home 856 58.3% Speak English very well612 41.7% Speak English less than very well2.7% of residents speak other language at home 591 82.1% Speak English very well129 17.9% Speak English less than very well
English speakers - Born in the United States 94.2% of residents of Laplace speak English at home.
5.9% of residents speak Spanish at home 193 86.9% Speak English very well29 13.1% Speak English less than very well
English speakers - Native, born elsewhere 49.3% of residents of Laplace speak English at home.
40.9% of residents speak Spanish at home 69 59.0% Speak English very well48 41.0% Speak English less than very well
English speakers - Foreign-born 21.8% of residents of Laplace speak English at home.
45.2% of residents speak Spanish at home 317 41.2% Speak English very well452 58.8% Speak English less than very well31.9% of residents speak other language at home 418 77.1% Speak English very well124 22.9% Speak English less than very well
White (Caucasian) - Speak only English Native:
96.3% (9,006)Foreign-born:
45.3% (94)
White (Caucasian) - Speak another language Native:
3.7% (341)Foreign-born:
58.7% (122)
Black or African American - Speak only English Native:
98.8% (12,781)Foreign-born:
46.2% (257)
Black or African American - Speak another language Native:
1.1% (144)Foreign-born:
53.5% (297)
Asian - Speak only English Native:
86.8% (172)Foreign-born:
14.9% (23)
Other race - Speak another language Native:
27.5% (217)Foreign-born:
100.0% (608)
Two or more races - Speak only English Native:
92.1% (2,007)Foreign-born:
7.2% (18)
Two or more races - Speak another language Native:
7.7% (168)Foreign-born:
92.6% (234)
White alone - Speak only English Native:
98.2% (8,781)Foreign-born:
53.6% (86)
White alone - Speak another language Native:
1.9% (170)Foreign-born:
46.5% (74)
Hispanic or Latino - Speak only English Native:
55.6% (721)Foreign-born:
15.7% (134)
Hispanic or Latino - Speak another language Native:
42.1% (546)Foreign-born:
84.4% (721)
Foreign-born residents in Laplace 1,768 residents are foreign born (4.0% Latin America , 0.8% Africa , 0.7% Asia ).
This city:
6.2%Louisiana:
4.2%
Marital status for residents in Laplace Marital status - White (Caucasian) population 15 years and over
Males 27.6% Never married53.5% Now married1.4% Separated4.9% Widowed12.6% DivorcedFemales 27.2% Never married54.4% Now married1.4% Separated8.3% Widowed8.7% DivorcedWomen who gave birth in the past 12 months Now married:
100.0% (60)Unmarried:
0.0% (0)
Women who did not give birth in the past 12 months Now married:
40.4% (796)Unmarried:
59.6% (1,174)
Marital status - Black or African American population 15 years and over
Males 44.7% Never married37.3% Now married3.8% Separated6.1% Widowed8.1% DivorcedFemales 40.6% Never married34.9% Now married7.2% Separated6.4% Widowed10.8% DivorcedWomen who gave birth in the past 12 months Now married:
0.0% (0)Unmarried:
100.0% (143)
Women who did not give birth in the past 12 months Now married:
34.5% (1,286)Unmarried:
65.5% (2,437)
Marital status - American Indian / Alaska Native population 15 years and over
Males 0.0% Never married91.1% Now married0.0% Separated0.0% Widowed8.9% DivorcedFemales 0.0% Never married0.0% Now married0.0% Separated100.0% Widowed0.0% DivorcedMarital status - Asian population 15 years and over
Males 82.5% Never married14.0% Now married0.0% Separated3.5% Widowed0.0% DivorcedFemales 60.5% Never married18.1% Now married0.0% Separated0.0% Widowed21.4% DivorcedWomen who gave birth in the past 12 months Now married:
100.0% (1)Unmarried:
0.0% (0)
Women who did not give birth in the past 12 months Now married:
18.7% (43)Unmarried:
81.3% (185)
Marital status - Other race population 15 years and over
Males 18.9% Never married78.5% Now married0.0% Separated0.0% Widowed2.6% DivorcedFemales 16.3% Never married67.4% Now married10.9% Separated0.0% Widowed5.4% DivorcedWomen who gave birth in the past 12 months Now married:
100.0% (53)Unmarried:
0.0% (0)
Women who did not give birth in the past 12 months Now married:
66.8% (180)Unmarried:
33.2% (89)
Marital status - Two or more races population 15 years and over
Males 64.1% Never married34.3% Now married0.0% Separated0.9% Widowed0.7% DivorcedFemales 20.4% Never married59.5% Now married6.7% Separated13.3% Widowed0.0% DivorcedWomen who did not give birth in the past 12 months Now married:
57.6% (195)Unmarried:
42.4% (144)
Marital status - White alone, not Hispanic / Latino population 15 years and over
Males 27.0% Never married53.7% Now married1.5% Separated5.2% Widowed12.5% DivorcedFemales 28.4% Never married52.3% Now married1.4% Separated8.7% Widowed9.1% DivorcedWomen who gave birth in the past 12 months Now married:
100.0% (61)Unmarried:
0.0% (0)
Women who did not give birth in the past 12 months Now married:
35.9% (669)Unmarried:
64.1% (1,193)
Marital status - Hispanic or Latino population 15 years and over
Males 30.3% Never married53.3% Now married0.0% Separated0.0% Widowed16.4% DivorcedFemales 11.7% Never married77.3% Now married4.4% Separated3.8% Widowed2.7% DivorcedWomen who gave birth in the past 12 months Now married:
100.0% (51)Unmarried:
0.0% (0)
Women who did not give birth in the past 12 months Now married:
75.3% (343)Unmarried:
24.7% (113)
Ancestries in Laplace
2,329 11.6% American864 4.3% English773 3.9% French430 2.1% Italian283 1.4% German242 1.2% Cajun237 1.2% Irish166 0.8% French Canadian157 0.8% Nigerian88 0.4% British52 0.3% Brazilian51 0.3% Scotch-Irish50 0.2% Portuguese29 0.1% Guyanese29 0.1% Scottish27 0.1% Eastern European26 0.1% Jordanian24 0.1% Trinidadian and Tobagonian19 0.09% Greek15 0.07% Israeli10 0.05% European10 0.05% African9 0.04% Swedish8 0.04% Finnish8 0.04% Norwegian7 0.03% Welsh7 0.03% West Indian2 0.01% Lebanese
Geographical mobility in Laplace Same house 1 year ago 9,413 94.8% White (Caucasian)13,626 94.8% Black or African American59 92.6% American Indian / Alaska Native361 95.6% Asian827 51.3% Other race2,234 91.6% Two or more races9,018 95.5% White alone, not Hispanic / Latino1,655 71.4% Hispanic or LatinoMoved within same county 231 2.3% White / Caucasian364 2.5% Black or African American4 5.8% American Indian / Alaska Native9 2.5% Asian20 1.3% Other race40 1.6% Two or more races216 2.3% White alone, not Hispanic / Latino157 6.8% Hispanic or LatinoMoved within same state 156 1.6% White / Caucasian383 2.7% Black or African American733 45.4% Other race49 2.0% Two or more races159 1.7% White alone, not Hispanic / Latino294 12.7% Hispanic or LatinoMoved from different state 105 1.1% White / Caucasian121 0.8% Black or African American1 99.3% Native Hawaiian / Pacific Islander83 5.1% Other race72 3.0% Two or more races20 0.2% White alone, not Hispanic / Latino114 4.9% Hispanic or LatinoMoved from abroad 21 0.2% White38 0.3% Black or African American70 4.3% Other race50 2.1% Two or more races25 0.3% White alone, not Hispanic / Latino40 1.7% Hispanic or Latino
Children Nativity (place of birth) in Laplace
Children under 6 years - Living with two parents Both parents native 484 100.0% NativeBoth parents foreign-born 183 100.0% NativeChildren under 6 years - Living with one parent Native parent 1,330 100.0% NativeForeign-born parent 58 100.0% NativeChildren 6 to 17 years - Living with two parents Both parents native 1,797 100.0% NativeBoth parents foreign-born 119 60.0% Native79 40.0% Foreign-bornOne native, one foreign-born parent 403 100.0% NativeChildren 6 to 17 years - Living with one parent Native parent 2,227 100.0% NativeForeign-born parent 25 50.6% Native25 49.4% Foreign-born
Grandparents responsible for own grandchildren in Laplace
Grandparents (30 to 59 years) White / Caucasian 15 85.3% Responsible for grandchildren3 14.7% Not responsible for grandchildrenBlack or African American 73 35.3% Responsible for grandchildren134 64.7% Not responsible for grandchildrenOther race 8 100.0% Not responsible for grandchildrenWhite alone, not Hispanic / Latino 16 85.0% Responsible for grandchildren3 15.0% Not responsible for grandchildrenHispanic or Latino 8 100.0% Not responsible for grandchildrenGrandparents (60 years and over) White / Caucasian 139 61.0% Responsible for grandchildren88 39.0% Not responsible for grandchildrenBlack or African American 205 45.1% Responsible for grandchildren250 54.9% Not responsible for grandchildrenWhite alone, not Hispanic / Latino 141 60.9% Responsible for grandchildren91 39.1% Not responsible for grandchildrenHispanic or Latino 91 100.0% Not responsible for grandchildren