Races in Mandeville, Louisiana (LA) Detailed Stats
Ancestries, Foreign-born residents, place of birth
Settings
X


Recent posts about races in Mandeville, Louisiana on our local forum with over 2,400,000 registered users:
 | Buying a house in Mandeville (4 replies) |
| Louisiana is the WORST STATE in the U.S. ever!!!!! (221 replies) |
| Mandeville Athletic Clubs (advice) (2 replies) |
| Moving to NOLO area..so confused, schools, Mandeville.. (3 replies) |
| Relocating to New Orleans and have concerns about safety and flooding (7 replies) |
| From Atlanta, GA to Mandeville, LA (14 replies) |
Latest news about races in Mandeville, LA collected exclusively by city-data.com from local newspapers, TV, and radio stations
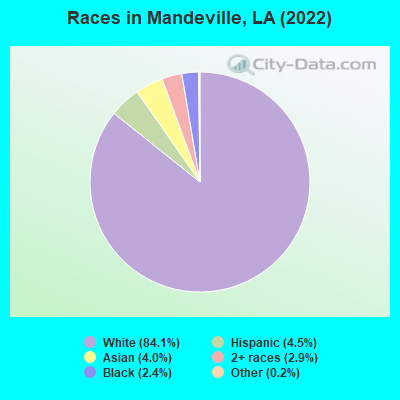
According to 2022 data, the most numerous races in Mandeville, LA are White alone (11,395 residents), Black alone (324 residents), and Hispanic (606 residents). 93.5% of Mandeville residents speak English at home. 6.1% of Mandeville, LA residents are foreign-born (2.6% born in Asia, 1.7% born in Europe, 1.7% born in Latin America), which is 34.6% greater than the foreign-born rate of 4.0% across the entire state of Louisiana.
Race distribution in Mandeville
2000
2022

- 9,48690.4%White alone
- 4944.7%Black alone
- 2552.4%Hispanic
- 1221.2%Asian alone
- 810.8%Two or more races
- 320.3%American Indian alone
- 130.1%Other race alone
- 60.06%Native Hawaiian and Other
Pacific Islander alone

-
- 11,39584.1%White alone
- 6064.5%Hispanic
- 5384.0%Asian alone
- 3922.9%Two or more races
- 3242.4%Black alone
- 310.2%Other race alone
- 80.06%American Indian alone
2000
2022
-
- 2,794,39162.5%White alone
- 1,443,39032.3%Black alone
- 107,7382.4%Hispanic
- 54,2561.2%Asian alone
- 39,2600.9%Two or more races
- 24,1290.5%American Indian alone
- 4,7360.1%Other race alone
- 1,0760.02%Native Hawaiian and Other
Pacific Islander alone

-
- 2,603,22156.7%White alone
- 1,420,05530.9%Black alone
- 262,2135.7%Hispanic
- 183,2704.0%Two or more races
- 81,1691.8%Asian alone
- 19,9910.4%American Indian alone
- 18,0430.4%Other race alone
- 2,2790.05%Native Hawaiian and Other
Pacific Islander alone

Income and house value in Mandeville
- Median household income in 2022
- $91,746White non-Hispanic householders
- $46,478Asian householders
- $51,452Two or more races householders
- Median 2022 house value
- $388,224White Non-Hispanic householders
- $213,205Black or African American householders
- $336,575Asian householders
- $110,152Some other race householders
- $336,575Two or more races householders
- $120,922Hispanic or Latino householders
Household income for White non-Hispanic householders

Household income for Black householders

Household income for Asian householders

Household income for Some other race householders

Household income for Two or more races householders

Household income for Hispanic or Latino race householders

Median age by race in Mandeville
- 46.1Median age for White residents
- 45.3Males
- 47.3Females
- 34.2Median age for Black or African American residents
- 56.4Males
- 15.7Females
- -716,269,840.6Median age for American Indian / Alaska Native residents
- -708,333,332.6Males
- -845,528,454.4Females
- 36.0Median age for Asian residents
- 22.5Males
- 41.7Females
- -821,138,210.6Median age for Native Hawaiian / Pacific Islander residents
- -868,167,201.7Males
- -599,999,999.4Females
- -679,999,999.3Median age for Other race residents
- -633,663,365.7Males
- -731,762,064.4Females
- 41.9Median age for Two or more races residents
- 38.0Males
- 42.4Females
- 46.0Median age for White alone residents
- 45.1Males
- 47.6Females
- 52.6Median age for Hispanic or Latino residents
- 53.1Males
- 44.0Females
Owner/renter occupied households by race in Mandeville
- House owners and renters - White residents
- 3,60871.2%Owner occupied
- 1,46328.8%Renter occupied
- House owners and renters - Black or African American residents
- 3329.3%Owner occupied
- 8070.7%Renter occupied
- House owners and renters - Asian residents
- 3623.6%Owner occupied
- 11876.4%Renter occupied
- House owners and renters - Other race residents
- 59.9%Owner occupied
- 4890.1%Renter occupied
- House owners and renters - Two or more races residents
- 17672.4%Owner occupied
- 6727.6%Renter occupied
- House owners and renters - White alone residents
- 3,56270.5%Owner occupied
- 1,49229.5%Renter occupied
- House owners and renters - Hispanic or Latino residents
- 16393.6%Owner occupied
- 116.4%Renter occupied
Language usage in Mandeville
- English speakers - Total
- 93.5% of residents of Mandeville speak English at home.
- 2.2% of residents speak Spanish at home
- 18766.1%Speak English very well
- 9633.9%Speak English less than very well
- 4.2% of residents speak other language at home
- 32258.8%Speak English very well
- 22641.2%Speak English less than very well
- English speakers - Born in the United States
- 92.9% of residents of Mandeville speak English at home.
- 1.3% of residents speak Spanish at home
- 52100.0%Speak English very well
- 2.8% of residents speak other language at home
- 8980.2%Speak English very well
- 2219.8%Speak English less than very well
- English speakers - Native, born elsewhere
- 54.2% of residents of Mandeville speak English at home.
- 41.1% of residents speak other language at home
- 44100.0%Speak English less than very well
- English speakers - Foreign-born
- 34.2% of residents of Mandeville speak English at home.
- 22.5% of residents speak Spanish at home
- 8856.8%Speak English very well
- 6743.2%Speak English less than very well
- 37.9% of residents speak other language at home
- 9335.6%Speak English very well
- 16864.4%Speak English less than very well
White (Caucasian) - Speak only English
| Native: | 97.9% (10,706) |
| Foreign-born: | 50.5% (108) |
White (Caucasian) - Speak another language
| Native: | 2.1% (224) |
| Foreign-born: | 51.0% (109) |
Asian - Speak only English
| Native: | 28.0% (54) |
| Foreign-born: | 49.4% (153) |
Asian - Speak another language
| Native: | 88.8% (171) |
| Foreign-born: | 45.4% (140) |
Two or more races - Speak only English
| Native: | 95.2% (499) |
| Foreign-born: | 5.5% (7) |
Two or more races - Speak another language
| Native: | 5.2% (27) |
| Foreign-born: | 97.1% (116) |
White alone - Speak only English
| Native: | 98.0% (10,616) |
| Foreign-born: | 39.9% (111) |
White alone - Speak another language
| Native: | 2.0% (220) |
| Foreign-born: | 59.7% (166) |
Hispanic or Latino - Speak only English
| Native: | 77.6% (296) |
| Foreign-born: | 17.7% (25) |
Hispanic or Latino - Speak another language
| Native: | 22.6% (86) |
| Foreign-born: | 90.3% (126) |
Foreign-born residents in Mandeville
828 residents are foreign born (2.6% Asia, 1.7% Europe, 1.7% Latin America).
| This city: | 6.1% |
| Louisiana: | 4.2% |


Marital status for residents in Mandeville
Marital status - White (Caucasian) population 15 years and over
- Males
- 25.5%Never married
- 58.0%Now married
- 1.8%Separated
- 1.6%Widowed
- 13.0%Divorced
- Females
- 15.0%Never married
- 60.2%Now married
- 1.2%Separated
- 7.6%Widowed
- 16.1%Divorced
Women who gave birth in the past 12 months
| Now married: | 86.6% (106) |
| Unmarried: | 13.4% (16) |
Women who did not give birth in the past 12 months
| Now married: | 57.6% (1,056) |
| Unmarried: | 42.4% (776) |
Marital status - Black or African American population 15 years and over
- Males
- 51.5%Never married
- 45.5%Now married
- 0.0%Separated
- 0.0%Widowed
- 3.0%Divorced
- Females
- 79.1%Never married
- 19.0%Now married
- 0.0%Separated
- 1.8%Widowed
- 0.0%Divorced
Women who did not give birth in the past 12 months
| Now married: | 6.5% (11) |
| Unmarried: | 93.5% (158) |
Marital status - Asian population 15 years and over
- Males
- 62.7%Never married
- 37.3%Now married
- 0.0%Separated
- 0.0%Widowed
- 0.0%Divorced
- Females
- 19.2%Never married
- 60.7%Now married
- 0.0%Separated
- 5.4%Widowed
- 14.6%Divorced
Women who did not give birth in the past 12 months
| Now married: | 45.1% (57) |
| Unmarried: | 54.9% (69) |
Marital status - Other race population 15 years and over
- Males
- 0.0%Never married
- 0.0%Now married
- 0.0%Separated
- 0.0%Widowed
- 100.0%Divorced
- Females
- 0.0%Never married
- 100.0%Now married
- 0.0%Separated
- 0.0%Widowed
- 0.0%Divorced
Women who did not give birth in the past 12 months
| Now married: | 100.0% (4) |
| Unmarried: | 0.0% (0) |
Marital status - Two or more races population 15 years and over
- Males
- 0.0%Never married
- 78.2%Now married
- 0.0%Separated
- 0.0%Widowed
- 21.8%Divorced
- Females
- 39.9%Never married
- 14.9%Now married
- 13.2%Separated
- 10.7%Widowed
- 21.4%Divorced
Women who did not give birth in the past 12 months
| Now married: | 27.2% (53) |
| Unmarried: | 72.8% (143) |
Marital status - White alone, not Hispanic / Latino population 15 years and over
- Males
- 26.0%Never married
- 57.8%Now married
- 1.9%Separated
- 1.7%Widowed
- 12.6%Divorced
- Females
- 14.5%Never married
- 60.9%Now married
- 1.2%Separated
- 7.7%Widowed
- 15.6%Divorced
Women who gave birth in the past 12 months
| Now married: | 86.6% (108) |
| Unmarried: | 13.4% (17) |
Women who did not give birth in the past 12 months
| Now married: | 58.4% (1,062) |
| Unmarried: | 41.6% (756) |
Marital status - Hispanic or Latino population 15 years and over
- Males
- 0.0%Never married
- 69.0%Now married
- 0.0%Separated
- 0.0%Widowed
- 31.0%Divorced
- Females
- 26.7%Never married
- 16.7%Now married
- 9.0%Separated
- 13.6%Widowed
- 33.9%Divorced
Women who did not give birth in the past 12 months
| Now married: | 45.2% (41) |
| Unmarried: | 54.8% (50) |
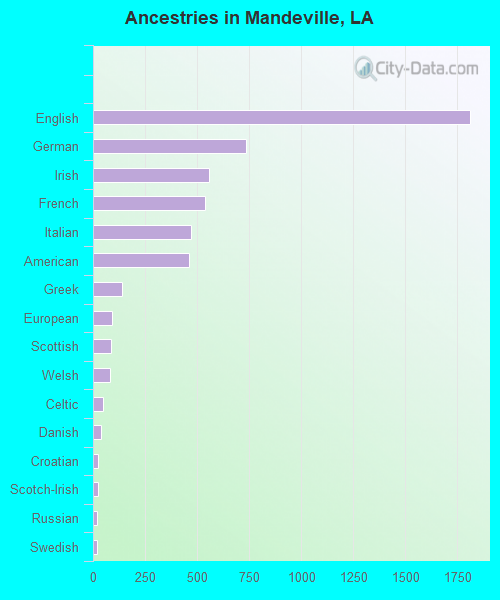
Ancestries in Mandeville

- 1,81231.1%English
- 73412.6%German
- 5579.6%Irish
- 5379.2%French
- 4708.1%Italian
- 4607.9%American
- 1402.4%Greek
- 891.5%European
- 881.5%Scottish
- 811.4%Welsh
- 500.9%Celtic
- 370.6%Danish
- 260.4%Croatian
- 240.4%Scotch-Irish
- 200.3%Russian
- 180.3%Swedish
- 150.3%Polish
- 140.2%Cajun
- 130.2%Czechoslovakian
- 110.2%British
- 110.2%Slovak
- 80.1%Czech
- 80.1%French Canadian
- 10.02%Iranian
Geographical mobility in Mandeville

- Same house 1 year ago
- 10,01087.6%White (Caucasian)
- 288100.0%Black or African American
- 999.4%American Indian / Alaska Native
- 41782.3%Asian
- 3687.4%Other race
- 55879.1%Two or more races
- 9,93787.5%White alone, not Hispanic / Latino
- 48392.0%Hispanic or Latino

-
- Moved within same county
- 8287.2%White / Caucasian
- 10.2%Asian
- 49.8%Other race
- 679.5%Two or more races
- 8307.3%White alone, not Hispanic / Latino
- 316.0%Hispanic or Latino

-
- Moved within same state
- 4043.5%White / Caucasian
- 20.6%Black or African American
- 7013.8%Asian
- 152.1%Two or more races
- 4063.6%White alone, not Hispanic / Latino
- 101.8%Hispanic or Latino

-
- Moved from different state
- 1391.2%White / Caucasian
- 214.1%Asian
- 638.9%Two or more races
- 1391.2%White alone, not Hispanic / Latino
- 20.4%Hispanic or Latino

-
- Moved from abroad
- 290.3%White
- 340.3%White alone, not Hispanic / Latino

Children Nativity (place of birth) in Mandeville
Place of birth for residents in Mandeville
![Place of birth for the foreign-born population - Regions]()
- 353Asia
- 241Americas
- 226Europe
- 226Latin America
- 159South Eastern Asia
- 137Central America
- 101South Central Asia
- 82Northern Europe
- 81Western Europe
- 75South America
- 67Eastern Asia
- 66China
- 61Eastern Europe
- 25Western Asia
- 15Northern America
- 13Caribbean
- 6Oceania
- 6Australia and New Zealand Subregion
- 1Southern Europe

![Place of birth for the foreign-born population - Countries]()
- 100Honduras
- 99India
- 84Vietnam
- 74Philippines
- 66China
- 61Serbia
- 53Guyana
- 45France
- 30United Kingdom
- 27England
- 25Lebanon
- 24Scotland
- 22Guatemala
- 19Germany
- 16Netherlands
- 15Canada
- 13Cuba
- 13Panama
- 13Colombia
- 7Bolivia
- 6Australia
- 2Iran
- 2Argentina
- 1Italy
- 1Japan
- 1Mexico

Grandparents responsible for own grandchildren in Mandeville
Zip codes: 70448.