Races in Mebane, North Carolina (NC) Detailed Stats
Data:
Races - White alone (%)
Races - White alone (% change since 2000)
Races - Black alone (%)
Races - Black alone (% change since 2000)
Races - American Indian alone (%)
Races - American Indian alone (% change since 2000)
Races - Asian alone (%)
Races - Asian alone (% change since 2000)
Races - Hispanic (%)
Races - Hispanic (% change since 2000)
Races - Native Hawaiian and Other Pacific Islander alone (%)
Races - Native Hawaiian and Other Pacific Islander alone (% change since 2000)
Races - Two or more races(%)
Races - Two or more races(% change since 2000)
Races - Other race alone (%)
Races - Other race alone (% change since 2000)
Racial diversity
Place of birth - Born in state of residence (%)
Place of birth - Born in state of residence (%) - White
Place of birth - Born in state of residence (%) - Black or African American
Place of birth - Born in state of residence (%) - Asian
Place of birth - Born in state of residence (%) - Hispanic or Latino
Place of birth - Born in state of residence (%) - American Indian and Alaska Native
Place of birth - Born in state of residence (%) - Multirace
Place of birth - Born in state of residence (%) - Other Race
Place of birth - Born in other state (%)
Place of birth - Born in other state (%) - White
Place of birth - Born in other state (%) - Black or African American
Place of birth - Born in other state (%) - Asian
Place of birth - Born in other state (%) - Hispanic or Latino
Place of birth - Born in other state (%) - American Indian and Alaska Native
Place of birth - Born in other state (%) - Multirace
Place of birth - Born in other state (%) - Other Race
Place of birth - Native, outside of US (%)
Place of birth - Native, outside of US (%) - White
Place of birth - Native, outside of US (%) - Black or African American
Place of birth - Native, outside of US (%) - Asian
Place of birth - Native, outside of US (%) - Hispanic or Latino
Place of birth - Native, outside of US (%) - American Indian and Alaska Native
Place of birth - Native, outside of US (%) - Multirace
Place of birth - Native, outside of US (%) - Other Race
Place of birth - Foreign born (%)
Place of birth - Foreign born (%) - White
Place of birth - Foreign born (%) - Black or African American
Place of birth - Foreign born (%) - Asian
Place of birth - Foreign born (%) - Hispanic or Latino
Place of birth - Foreign born (%) - American Indian and Alaska Native
Place of birth - Foreign born (%) - Multirace
Place of birth - Foreign born (%) - Other Race
Residents speaking English at home (%)
Residents speaking English at home - Born in the United States (%)
Residents speaking English at home - Native, born elsewhere (%)
Residents speaking English at home - Foreign born (%)
Residents speaking Spanish at home (%)
Residents speaking Spanish at home - Born in the United States (%)
Residents speaking Spanish at home - Native, born elsewhere (%)
Residents speaking Spanish at home - Foreign born (%)
Residents speaking other language at home (%)
Residents speaking other language at home - Born in the United States (%)
Residents speaking other language at home - Native, born elsewhere (%)
Residents speaking other language at home - Foreign born (%)
Marital status - Never married (%)
Marital status - Now married (%)
Marital status - Separated (%)
Marital status - Widowed (%)
Marital status - Divorced (%)
Ancestries Reported - Arab (%)
Ancestries Reported - Czech (%)
Ancestries Reported - Danish (%)
Ancestries Reported - Dutch (%)
Ancestries Reported - English (%)
Ancestries Reported - French (%)
Ancestries Reported - French Canadian (%)
Ancestries Reported - German (%)
Ancestries Reported - Greek (%)
Ancestries Reported - Hungarian (%)
Ancestries Reported - Irish (%)
Ancestries Reported - Italian (%)
Ancestries Reported - Lithuanian (%)
Ancestries Reported - Norwegian (%)
Ancestries Reported - Polish (%)
Ancestries Reported - Portuguese (%)
Ancestries Reported - Russian (%)
Ancestries Reported - Scotch-Irish (%)
Ancestries Reported - Scottish (%)
Ancestries Reported - Slovak (%)
Ancestries Reported - Subsaharan African (%)
Ancestries Reported - Swedish (%)
Ancestries Reported - Swiss (%)
Ancestries Reported - Ukrainian (%)
Ancestries Reported - United States (%)
Ancestries Reported - Welsh (%)
Ancestries Reported - West Indian (%)
Ancestries Reported - Other (%)
Geographical mobility - Same house 1 year ago (%)
Geographical mobility - Same house 1 year ago (%) - White
Geographical mobility - Same house 1 year ago (%) - Black or African American
Geographical mobility - Same house 1 year ago (%) - Asian
Geographical mobility - Same house 1 year ago (%) - Hispanic or Latino
Geographical mobility - Same house 1 year ago (%) - American Indian and Alaska Native
Geographical mobility - Same house 1 year ago (%) - Multirace
Geographical mobility - Same house 1 year ago (%) - Other Race
Geographical mobility - Moved within same county (%)
Geographical mobility - Moved within same county (%) - White
Geographical mobility - Moved within same county (%) - Black or African American
Geographical mobility - Moved within same county (%) - Asian
Geographical mobility - Moved within same county (%) - Hispanic or Latino
Geographical mobility - Moved within same county (%) - American Indian and Alaska Native
Geographical mobility - Moved within same county (%) - Multirace
Geographical mobility - Moved within same county (%) - Other Race
Geographical mobility - Moved from different county within same state (%)
Geographical mobility - Moved from different county within same state (%) - White
Geographical mobility - Moved from different county within same state (%) - Black or African American
Geographical mobility - Moved from different county within same state (%) - Asian
Geographical mobility - Moved from different county within same state (%) - Hispanic or Latino
Geographical mobility - Moved from different county within same state (%) - American Indian and Alaska Native
Geographical mobility - Moved from different county within same state (%) - Multirace
Geographical mobility - Moved from different county within same state (%) - Other Race
Geographical mobility - Moved from different state (%)
Geographical mobility - Moved from different state (%) - White
Geographical mobility - Moved from different state (%) - Black or African American
Geographical mobility - Moved from different state (%) - Asian
Geographical mobility - Moved from different state (%) - Hispanic or Latino
Geographical mobility - Moved from different state (%) - American Indian and Alaska Native
Geographical mobility - Moved from different state (%) - Multirace
Geographical mobility - Moved from different state (%) - Other Race
Geographical mobility - Moved from abroad (%)
Geographical mobility - Moved from abroad (%) - White
Geographical mobility - Moved from abroad (%) - Black or African American
Geographical mobility - Moved from abroad (%) - Asian
Geographical mobility - Moved from abroad (%) - Hispanic or Latino
Geographical mobility - Moved from abroad (%) - American Indian and Alaska Native
Geographical mobility - Moved from abroad (%) - Multirace
Geographical mobility - Moved from abroad (%) - Other Race
Place of birth for the foreign-born population - Ireland (%)
Place of birth for the foreign-born population - Denmark (%)
Place of birth for the foreign-born population - Norway (%)
Place of birth for the foreign-born population - Sweden (%)
Place of birth for the foreign-born population - United Kingdom (%)
Place of birth for the foreign-born population - England (%)
Place of birth for the foreign-born population - Scotland (%)
Place of birth for the foreign-born population - Other Northern Europe (%)
Place of birth for the foreign-born population - Austria (%)
Place of birth for the foreign-born population - Belgium (%)
Place of birth for the foreign-born population - France (%)
Place of birth for the foreign-born population - Germany (%)
Place of birth for the foreign-born population - Netherlands (%)
Place of birth for the foreign-born population - Switzerland (%)
Place of birth for the foreign-born population - Other Western Europe (%)
Place of birth for the foreign-born population - Greece (%)
Place of birth for the foreign-born population - Italy (%)
Place of birth for the foreign-born population - Portugal (%)
Place of birth for the foreign-born population - Spain (%)
Place of birth for the foreign-born population - Other Southern Europe (%)
Place of birth for the foreign-born population - Albania (%)
Place of birth for the foreign-born population - Belarus (%)
Place of birth for the foreign-born population - Bosnia and Herzegovina (%)
Place of birth for the foreign-born population - Bulgaria (%)
Place of birth for the foreign-born population - Croatia (%)
Place of birth for the foreign-born population - Czechoslovakia (%)
Place of birth for the foreign-born population - Hungary (%)
Place of birth for the foreign-born population - Latvia (%)
Place of birth for the foreign-born population - Lithuania (%)
Place of birth for the foreign-born population - North Macedonia (Macedonia) (%)
Place of birth for the foreign-born population - Moldova (%)
Place of birth for the foreign-born population - Poland (%)
Place of birth for the foreign-born population - Romania (%)
Place of birth for the foreign-born population - Russia (%)
Place of birth for the foreign-born population - Serbia (%)
Place of birth for the foreign-born population - Ukraine (%)
Place of birth for the foreign-born population - Other Eastern Europe (%)
Place of birth for the foreign-born population - China (%)
Place of birth for the foreign-born population - Hong Kong (%)
Place of birth for the foreign-born population - Taiwan (%)
Place of birth for the foreign-born population - Japan (%)
Place of birth for the foreign-born population - Korea (%)
Place of birth for the foreign-born population - Other Eastern Asia (%)
Place of birth for the foreign-born population - Afghanistan (%)
Place of birth for the foreign-born population - Bangladesh (%)
Place of birth for the foreign-born population - India (%)
Place of birth for the foreign-born population - Iran (%)
Place of birth for the foreign-born population - Kazakhstan (%)
Place of birth for the foreign-born population - Nepal (%)
Place of birth for the foreign-born population - Pakistan (%)
Place of birth for the foreign-born population - Sri Lanka (%)
Place of birth for the foreign-born population - Uzbekistan (%)
Place of birth for the foreign-born population - Other South Central Asia (%)
Place of birth for the foreign-born population - Burma (%)
Place of birth for the foreign-born population - Cambodia (%)
Place of birth for the foreign-born population - Indonesia (%)
Place of birth for the foreign-born population - Laos (%)
Place of birth for the foreign-born population - Malaysia (%)
Place of birth for the foreign-born population - Philippines (%)
Place of birth for the foreign-born population - Singapore (%)
Place of birth for the foreign-born population - Thailand (%)
Place of birth for the foreign-born population - Vietnam (%)
Place of birth for the foreign-born population - Other South Eastern Asia (%)
Place of birth for the foreign-born population - Armenia (%)
Place of birth for the foreign-born population - Iraq (%)
Place of birth for the foreign-born population - Israel (%)
Place of birth for the foreign-born population - Jordan (%)
Place of birth for the foreign-born population - Kuwait (%)
Place of birth for the foreign-born population - Lebanon (%)
Place of birth for the foreign-born population - Saudi Arabia (%)
Place of birth for the foreign-born population - Syria (%)
Place of birth for the foreign-born population - Turkey (%)
Place of birth for the foreign-born population - Yemen (%)
Place of birth for the foreign-born population - Other Western Asia (%)
Place of birth for the foreign-born population - Eritrea (%)
Place of birth for the foreign-born population - Ethiopia (%)
Place of birth for the foreign-born population - Kenya (%)
Place of birth for the foreign-born population - Somalia (%)
Place of birth for the foreign-born population - Uganda (%)
Place of birth for the foreign-born population - Zimbabwe (%)
Place of birth for the foreign-born population - Other Eastern Africa (%)
Place of birth for the foreign-born population - Cameroon (%)
Place of birth for the foreign-born population - Congo (%)
Place of birth for the foreign-born population - Democratic Republic of Congo (Zaire) (%)
Place of birth for the foreign-born population - Other Middle Africa (%)
Place of birth for the foreign-born population - Egypt (%)
Place of birth for the foreign-born population - Morocco (%)
Place of birth for the foreign-born population - Sudan (%)
Place of birth for the foreign-born population - Other Northern Africa (%)
Place of birth for the foreign-born population - South Africa (%)
Place of birth for the foreign-born population - Other Southern Africa (%)
Place of birth for the foreign-born population - Cabo Verde (%)
Place of birth for the foreign-born population - Ghana (%)
Place of birth for the foreign-born population - Liberia (%)
Place of birth for the foreign-born population - Nigeria (%)
Place of birth for the foreign-born population - Senegal (%)
Place of birth for the foreign-born population - Sierra Leone (%)
Place of birth for the foreign-born population - Other Western Africa (%)
Place of birth for the foreign-born population - Australia (%)
Place of birth for the foreign-born population - New Zealand (%)
Place of birth for the foreign-born population - Fiji (%)
Place of birth for the foreign-born population - Micronesia (%)
Place of birth for the foreign-born population - Bahamas (%)
Place of birth for the foreign-born population - Barbados (%)
Place of birth for the foreign-born population - Cuba (%)
Place of birth for the foreign-born population - Dominica (%)
Place of birth for the foreign-born population - Dominican Republic (%)
Place of birth for the foreign-born population - Grenada (%)
Place of birth for the foreign-born population - Haiti (%)
Place of birth for the foreign-born population - Jamaica (%)
Place of birth for the foreign-born population - St. Vincent and the Grenadines (%)
Place of birth for the foreign-born population - Trinidad and Tobago (%)
Place of birth for the foreign-born population - West Indies (%)
Place of birth for the foreign-born population - Other Caribbean (%)
Place of birth for the foreign-born population - Belize (%)
Place of birth for the foreign-born population - Costa Rica (%)
Place of birth for the foreign-born population - El Salvador (%)
Place of birth for the foreign-born population - Guatemala (%)
Place of birth for the foreign-born population - Honduras (%)
Place of birth for the foreign-born population - Mexico (%)
Place of birth for the foreign-born population - Nicaragua (%)
Place of birth for the foreign-born population - Panama (%)
Place of birth for the foreign-born population - Other Central America (%)
Place of birth for the foreign-born population - Argentina (%)
Place of birth for the foreign-born population - Bolivia (%)
Place of birth for the foreign-born population - Brazil (%)
Place of birth for the foreign-born population - Chile (%)
Place of birth for the foreign-born population - Colombia (%)
Place of birth for the foreign-born population - Ecuador (%)
Place of birth for the foreign-born population - Guyana (%)
Place of birth for the foreign-born population - Peru (%)
Place of birth for the foreign-born population - Uruguay (%)
Place of birth for the foreign-born population - Venezuela (%)
Place of birth for the foreign-born population - Other South America (%)
Place of birth for the foreign-born population - Canada (%)
Place of birth for the foreign-born population - Other Northern America (%)
Place of birth for the foreign-born population - Other (%)
Latest news about races in Mebane, NC collected exclusively by city-data.com from local newspapers, TV, and radio stations
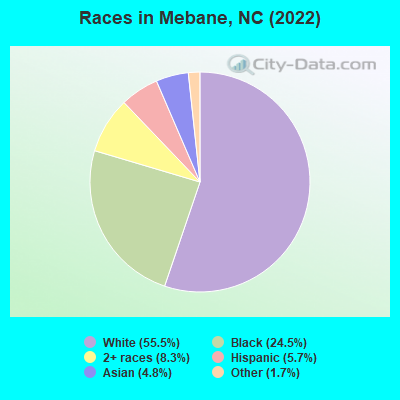
According to 2022 data, the most numerous races in Mebane, NC are White alone (10,198 residents), Black alone (4,495 residents), and Hispanic (1,039 residents). 87.1% of Mebane residents speak English at home. 7.8% of Mebane, NC residents are foreign-born (3.4% born in Asia, 2.2% born in Latin America, 1.3% born in Africa), which is 3.2% less than the foreign-born rate of 8.0% across the entire state of North Carolina.
Race distribution in Mebane
2000 2022
5,647,155 70.2% White alone 1,723,301 21.4% Black alone 378,963 4.7% Hispanic 112,416 1.4% Asian alone 95,333 1.2% American Indian alone 79,965 1.0% Two or more races 9,015 0.1% Other race alone 3,165 0.04% Native Hawaiian and Other
6,497,519 60.7% White alone 2,155,650 20.1% Black alone 1,114,799 10.4% Hispanic 438,061 4.1% Two or more races 341,052 3.2% Asian alone 91,758 0.9% American Indian alone 50,180 0.5% Other race alone 9,954 0.09% Native Hawaiian and Other
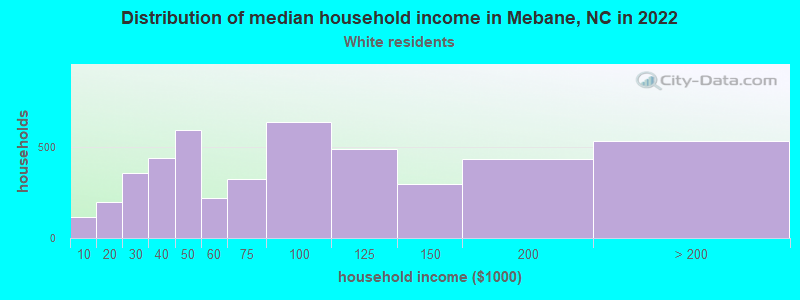
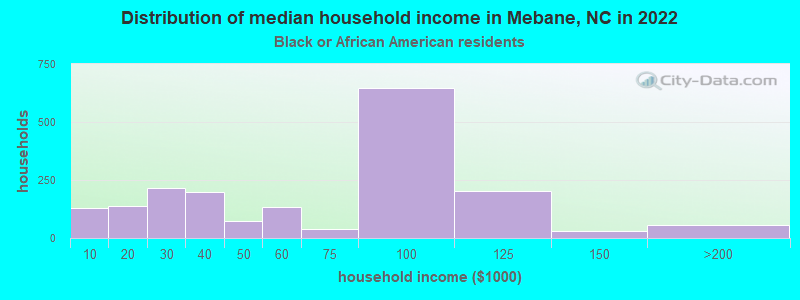
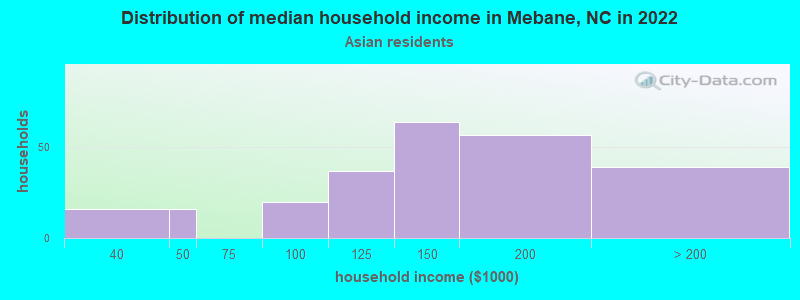
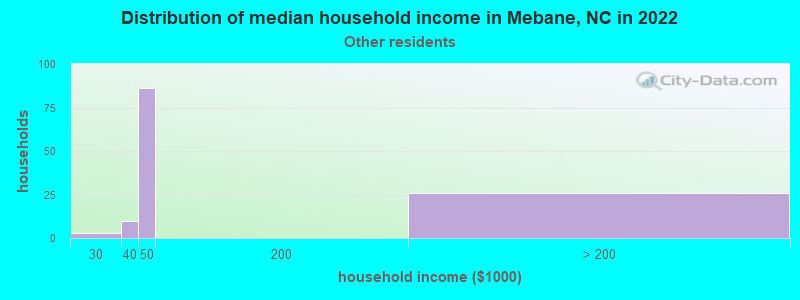
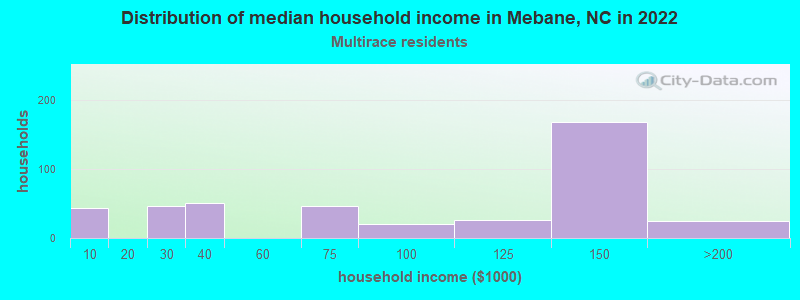
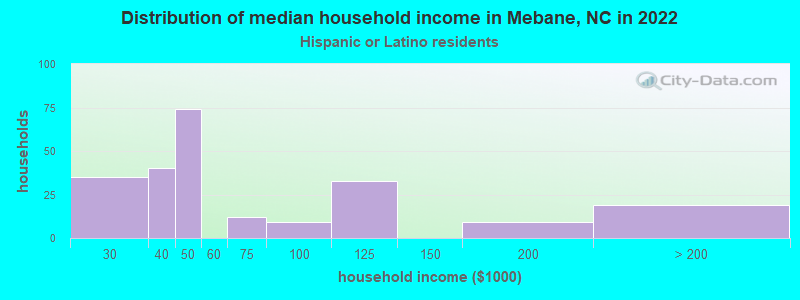
Income and house value in Mebane Median household income in 2022 $76,506 White non-Hispanic householders$54,687 Black householders$117,859 Asian householders$42,283 Some other race householders$111,970 Two or more races householders$43,299 Hispanic or Latino race householdersMedian 2022 house value $338,094 White Non-Hispanic householders$236,424 Black or African American householders$248,796 American Indian or Alaska Native householders$302,590 Two or more races householders$220,286 Hispanic or Latino householders
Median age by race in Mebane
41.6 Median age for White residents41.9 40.4 38.2 Median age for Black or African American residents38.9 38.2 -1,192,353,642.8 Median age for American Indian / Alaska Native residents-668,604,650.5 -1,383,874,848.2 36.2 Median age for Asian residents24.1 46.0 -298,932,384.0 Median age for Native Hawaiian / Pacific Islander residents-635,658,914.1 -612,403,100.2 20.5 Median age for Other race residents29.0 22.9 17.4 Median age for Two or more races residents23.1 13.1 41.2 Median age for White alone residents40.4 40.0 36.5 Median age for Hispanic or Latino residents38.9 20.1
Owner/renter occupied households by race in Mebane
House owners and renters - White residents 2,991 64.1% Owner occupied1,674 35.9% Renter occupiedHouse owners and renters - Black or African American residents 469 22.8% Owner occupied1,592 77.2% Renter occupiedHouse owners and renters - Asian residents 203 68.7% Owner occupied92 31.3% Renter occupiedHouse owners and renters - Other race residents 63 36.2% Owner occupied112 63.8% Renter occupiedHouse owners and renters - Two or more races residents 297 72.8% Owner occupied111 27.2% Renter occupiedHouse owners and renters - White alone residents 3,052 64.1% Owner occupied1,712 35.9% Renter occupiedHouse owners and renters - Hispanic or Latino residents 111 40.8% Owner occupied160 59.2% Renter occupied
Language usage in Mebane
English speakers - Total 87.1% of residents of Mebane speak English at home.
8.6% of residents speak Spanish at home 1,393 92.9% Speak English very well107 7.1% Speak English less than very well5.4% of residents speak other language at home 291 31.2% Speak English very well643 68.8% Speak English less than very well
English speakers - Born in the United States 94.3% of residents of Mebane speak English at home.
5.0% of residents speak Spanish at home 353 100.0% Speak English very well0.8% of residents speak other language at home 45 80.4% Speak English very well11 19.6% Speak English less than very well
English speakers - Native, born elsewhere 64.8% of residents of Mebane speak English at home.
20.0% of residents speak Spanish at home 62 100.0% Speak English very well11.0% of residents speak other language at home 34 100.0% Speak English very well
English speakers - Foreign-born 29.7% of residents of Mebane speak English at home.
27.5% of residents speak Spanish at home 301 76.4% Speak English very well93 23.6% Speak English less than very well49.5% of residents speak other language at home 176 24.8% Speak English very well533 75.2% Speak English less than very well
White (Caucasian) - Speak only English Native:
99.4% (9,365)Foreign-born:
100.0% (139)
White (Caucasian) - Speak another language Native:
1.4% (129)Foreign-born:
55.1% (76)
Black or African American - Speak only English Native:
95.7% (3,947)Foreign-born:
37.4% (41)
Black or African American - Speak another language Native:
4.2% (173)Foreign-born:
62.5% (69)
Asian - Speak only English Native:
70.1% (194)Foreign-born:
8.1% (50)
Asian - Speak another language Native:
27.6% (76)Foreign-born:
95.6% (585)
Other race - Speak another language Native:
58.3% (447)Foreign-born:
99.8% (365)
Two or more races - Speak only English Native:
66.4% (880)Foreign-born:
16.6% (29)
Two or more races - Speak another language Native:
30.8% (409)Foreign-born:
75.5% (130)
White alone - Speak only English Native:
97.7% (9,277)Foreign-born:
75.7% (193)
White alone - Speak another language Native:
2.4% (228)Foreign-born:
26.2% (67)
Hispanic or Latino - Speak another language Native:
53.9% (367)Foreign-born:
98.3% (367)
Foreign-born residents in Mebane 1,425 residents are foreign born (3.4% Asia , 2.2% Latin America , 1.3% Africa ).
This city:
7.8%North Carolina:
8.3%
Marital status for residents in Mebane Marital status - White (Caucasian) population 15 years and over
Males 20.8% Never married65.3% Now married2.1% Separated1.9% Widowed9.9% DivorcedFemales 22.1% Never married50.6% Now married2.6% Separated8.1% Widowed16.7% DivorcedWomen who gave birth in the past 12 months Now married:
78.3% (92)Unmarried:
21.7% (26)
Women who did not give birth in the past 12 months Now married:
59.4% (1,397)Unmarried:
40.6% (956)
Marital status - Black or African American population 15 years and over
Males 31.5% Never married62.2% Now married4.1% Separated1.3% Widowed0.8% DivorcedFemales 44.8% Never married36.8% Now married0.0% Separated7.9% Widowed10.4% DivorcedWomen who did not give birth in the past 12 months Now married:
38.9% (584)Unmarried:
61.1% (919)
Marital status - Asian population 15 years and over
Males 25.1% Never married63.5% Now married0.0% Separated0.0% Widowed11.4% DivorcedFemales 11.2% Never married78.2% Now married0.0% Separated6.0% Widowed4.5% DivorcedWomen who gave birth in the past 12 months Now married:
100.0% (64)Unmarried:
0.0% (0)
Women who did not give birth in the past 12 months Now married:
82.4% (176)Unmarried:
17.6% (38)
Marital status - Other race population 15 years and over
Males 13.8% Never married61.4% Now married0.0% Separated0.0% Widowed24.9% DivorcedFemales 66.7% Never married33.3% Now married0.0% Separated0.0% Widowed0.0% DivorcedWomen who gave birth in the past 12 months Now married:
0.0% (0)Unmarried:
100.0% (133)
Women who did not give birth in the past 12 months Now married:
17.2% (58)Unmarried:
82.8% (277)
Marital status - Two or more races population 15 years and over
Males 61.9% Never married19.2% Now married7.1% Separated0.0% Widowed11.9% DivorcedFemales 11.0% Never married81.8% Now married0.0% Separated0.0% Widowed7.2% DivorcedWomen who gave birth in the past 12 months Now married:
100.0% (21)Unmarried:
0.0% (0)
Women who did not give birth in the past 12 months Now married:
84.0% (230)Unmarried:
16.0% (44)
Marital status - White alone, not Hispanic / Latino population 15 years and over
Males 20.8% Never married65.1% Now married2.1% Separated1.9% Widowed10.0% DivorcedFemales 21.1% Never married51.0% Now married2.7% Separated8.3% Widowed16.9% DivorcedWomen who gave birth in the past 12 months Now married:
78.3% (98)Unmarried:
21.7% (27)
Women who did not give birth in the past 12 months Now married:
60.6% (1,446)Unmarried:
39.4% (941)
Marital status - Hispanic or Latino population 15 years and over
Males 16.0% Never married47.0% Now married9.9% Separated0.0% Widowed27.2% DivorcedFemales 46.9% Never married51.3% Now married0.0% Separated0.0% Widowed1.9% DivorcedWomen who did not give birth in the past 12 months Now married:
27.3% (85)Unmarried:
72.7% (227)
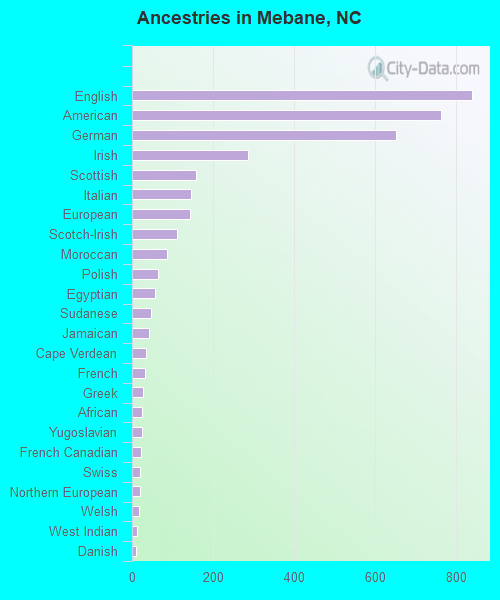
Ancestries in Mebane
839 11.5% English763 10.4% American652 8.9% German287 3.9% Irish157 2.1% Scottish145 2.0% Italian143 2.0% European112 1.5% Scotch-Irish87 1.2% Moroccan64 0.9% Polish56 0.8% Egyptian48 0.7% Sudanese43 0.6% Jamaican34 0.5% Cape Verdean31 0.4% French28 0.4% Greek25 0.3% African24 0.3% Yugoslavian22 0.3% French Canadian20 0.3% Swiss19 0.3% Northern European18 0.2% Welsh13 0.2% West Indian9 0.1% Danish6 0.08% Canadian
Geographical mobility in Mebane Same house 1 year ago 9,178 93.0% White (Caucasian)3,844 85.6% Black or African American12 100.0% American Indian / Alaska Native685 81.6% Asian1,130 100.0% Other race1,552 93.3% Two or more races9,380 92.8% White alone, not Hispanic / Latino1,048 100.0% Hispanic or LatinoMoved within same county 91 0.9% White / Caucasian207 4.6% Black or African American27 3.2% Asian165 9.9% Two or more races95 0.9% White alone, not Hispanic / LatinoMoved within same state 514 5.2% White / Caucasian84 1.9% Black or African American113 13.4% Asian6 0.4% Two or more races623 6.2% White alone, not Hispanic / LatinoMoved from different state 43 0.4% White / Caucasian324 7.2% Black or African American32 0.3% White alone, not Hispanic / Latino17 1.6% Hispanic or LatinoMoved from abroad 10 0.2% Black or African American17 1.7% Hispanic or Latino
Children Nativity (place of birth) in Mebane
Children under 6 years - Living with two parents Both parents native 587 100.0% NativeBoth parents foreign-born 96 100.0% NativeChildren under 6 years - Living with one parent Native parent 304 100.0% NativeChildren 6 to 17 years - Living with two parents Both parents native 1,622 99.7% Native5 0.3% Foreign-bornBoth parents foreign-born 114 36.2% Native201 63.8% Foreign-bornOne native, one foreign-born parent 71 70.3% Native30 29.7% Foreign-bornChildren 6 to 17 years - Living with one parent Native parent 949 100.0% Native
Grandparents responsible for own grandchildren in Mebane
Grandparents (30 to 59 years) White / Caucasian 44 100.0% Not responsible for grandchildrenBlack or African American 11 22.6% Responsible for grandchildren39 77.4% Not responsible for grandchildrenWhite alone, not Hispanic / Latino 54 100.0% Not responsible for grandchildrenGrandparents (60 years and over) White / Caucasian 67 90.6% Responsible for grandchildren7 9.4% Not responsible for grandchildrenWhite alone, not Hispanic / Latino 80 91.9% Responsible for grandchildren7 8.1% Not responsible for grandchildren