Races in Mililani Mauka, Hawaii (HI) Detailed Stats
Data:
Races - White alone (%)
Races - White alone (% change since 2000)
Races - Black alone (%)
Races - Black alone (% change since 2000)
Races - American Indian alone (%)
Races - American Indian alone (% change since 2000)
Races - Asian alone (%)
Races - Asian alone (% change since 2000)
Races - Hispanic (%)
Races - Hispanic (% change since 2000)
Races - Native Hawaiian and Other Pacific Islander alone (%)
Races - Native Hawaiian and Other Pacific Islander alone (% change since 2000)
Races - Two or more races(%)
Races - Two or more races(% change since 2000)
Races - Other race alone (%)
Races - Other race alone (% change since 2000)
Racial diversity
Place of birth - Born in state of residence (%)
Place of birth - Born in state of residence (%) - White
Place of birth - Born in state of residence (%) - Black or African American
Place of birth - Born in state of residence (%) - Asian
Place of birth - Born in state of residence (%) - Hispanic or Latino
Place of birth - Born in state of residence (%) - American Indian and Alaska Native
Place of birth - Born in state of residence (%) - Multirace
Place of birth - Born in state of residence (%) - Other Race
Place of birth - Born in other state (%)
Place of birth - Born in other state (%) - White
Place of birth - Born in other state (%) - Black or African American
Place of birth - Born in other state (%) - Asian
Place of birth - Born in other state (%) - Hispanic or Latino
Place of birth - Born in other state (%) - American Indian and Alaska Native
Place of birth - Born in other state (%) - Multirace
Place of birth - Born in other state (%) - Other Race
Place of birth - Native, outside of US (%)
Place of birth - Native, outside of US (%) - White
Place of birth - Native, outside of US (%) - Black or African American
Place of birth - Native, outside of US (%) - Asian
Place of birth - Native, outside of US (%) - Hispanic or Latino
Place of birth - Native, outside of US (%) - American Indian and Alaska Native
Place of birth - Native, outside of US (%) - Multirace
Place of birth - Native, outside of US (%) - Other Race
Place of birth - Foreign born (%)
Place of birth - Foreign born (%) - White
Place of birth - Foreign born (%) - Black or African American
Place of birth - Foreign born (%) - Asian
Place of birth - Foreign born (%) - Hispanic or Latino
Place of birth - Foreign born (%) - American Indian and Alaska Native
Place of birth - Foreign born (%) - Multirace
Place of birth - Foreign born (%) - Other Race
Residents speaking English at home (%)
Residents speaking English at home - Born in the United States (%)
Residents speaking English at home - Native, born elsewhere (%)
Residents speaking English at home - Foreign born (%)
Residents speaking Spanish at home (%)
Residents speaking Spanish at home - Born in the United States (%)
Residents speaking Spanish at home - Native, born elsewhere (%)
Residents speaking Spanish at home - Foreign born (%)
Residents speaking other language at home (%)
Residents speaking other language at home - Born in the United States (%)
Residents speaking other language at home - Native, born elsewhere (%)
Residents speaking other language at home - Foreign born (%)
Marital status - Never married (%)
Marital status - Now married (%)
Marital status - Separated (%)
Marital status - Widowed (%)
Marital status - Divorced (%)
Ancestries Reported - Arab (%)
Ancestries Reported - Czech (%)
Ancestries Reported - Danish (%)
Ancestries Reported - Dutch (%)
Ancestries Reported - English (%)
Ancestries Reported - French (%)
Ancestries Reported - French Canadian (%)
Ancestries Reported - German (%)
Ancestries Reported - Greek (%)
Ancestries Reported - Hungarian (%)
Ancestries Reported - Irish (%)
Ancestries Reported - Italian (%)
Ancestries Reported - Lithuanian (%)
Ancestries Reported - Norwegian (%)
Ancestries Reported - Polish (%)
Ancestries Reported - Portuguese (%)
Ancestries Reported - Russian (%)
Ancestries Reported - Scotch-Irish (%)
Ancestries Reported - Scottish (%)
Ancestries Reported - Slovak (%)
Ancestries Reported - Subsaharan African (%)
Ancestries Reported - Swedish (%)
Ancestries Reported - Swiss (%)
Ancestries Reported - Ukrainian (%)
Ancestries Reported - United States (%)
Ancestries Reported - Welsh (%)
Ancestries Reported - West Indian (%)
Ancestries Reported - Other (%)
Geographical mobility - Same house 1 year ago (%)
Geographical mobility - Same house 1 year ago (%) - White
Geographical mobility - Same house 1 year ago (%) - Black or African American
Geographical mobility - Same house 1 year ago (%) - Asian
Geographical mobility - Same house 1 year ago (%) - Hispanic or Latino
Geographical mobility - Same house 1 year ago (%) - American Indian and Alaska Native
Geographical mobility - Same house 1 year ago (%) - Multirace
Geographical mobility - Same house 1 year ago (%) - Other Race
Geographical mobility - Moved within same county (%)
Geographical mobility - Moved within same county (%) - White
Geographical mobility - Moved within same county (%) - Black or African American
Geographical mobility - Moved within same county (%) - Asian
Geographical mobility - Moved within same county (%) - Hispanic or Latino
Geographical mobility - Moved within same county (%) - American Indian and Alaska Native
Geographical mobility - Moved within same county (%) - Multirace
Geographical mobility - Moved within same county (%) - Other Race
Geographical mobility - Moved from different county within same state (%)
Geographical mobility - Moved from different county within same state (%) - White
Geographical mobility - Moved from different county within same state (%) - Black or African American
Geographical mobility - Moved from different county within same state (%) - Asian
Geographical mobility - Moved from different county within same state (%) - Hispanic or Latino
Geographical mobility - Moved from different county within same state (%) - American Indian and Alaska Native
Geographical mobility - Moved from different county within same state (%) - Multirace
Geographical mobility - Moved from different county within same state (%) - Other Race
Geographical mobility - Moved from different state (%)
Geographical mobility - Moved from different state (%) - White
Geographical mobility - Moved from different state (%) - Black or African American
Geographical mobility - Moved from different state (%) - Asian
Geographical mobility - Moved from different state (%) - Hispanic or Latino
Geographical mobility - Moved from different state (%) - American Indian and Alaska Native
Geographical mobility - Moved from different state (%) - Multirace
Geographical mobility - Moved from different state (%) - Other Race
Geographical mobility - Moved from abroad (%)
Geographical mobility - Moved from abroad (%) - White
Geographical mobility - Moved from abroad (%) - Black or African American
Geographical mobility - Moved from abroad (%) - Asian
Geographical mobility - Moved from abroad (%) - Hispanic or Latino
Geographical mobility - Moved from abroad (%) - American Indian and Alaska Native
Geographical mobility - Moved from abroad (%) - Multirace
Geographical mobility - Moved from abroad (%) - Other Race
Place of birth for the foreign-born population - Ireland (%)
Place of birth for the foreign-born population - Denmark (%)
Place of birth for the foreign-born population - Norway (%)
Place of birth for the foreign-born population - Sweden (%)
Place of birth for the foreign-born population - United Kingdom (%)
Place of birth for the foreign-born population - England (%)
Place of birth for the foreign-born population - Scotland (%)
Place of birth for the foreign-born population - Other Northern Europe (%)
Place of birth for the foreign-born population - Austria (%)
Place of birth for the foreign-born population - Belgium (%)
Place of birth for the foreign-born population - France (%)
Place of birth for the foreign-born population - Germany (%)
Place of birth for the foreign-born population - Netherlands (%)
Place of birth for the foreign-born population - Switzerland (%)
Place of birth for the foreign-born population - Other Western Europe (%)
Place of birth for the foreign-born population - Greece (%)
Place of birth for the foreign-born population - Italy (%)
Place of birth for the foreign-born population - Portugal (%)
Place of birth for the foreign-born population - Spain (%)
Place of birth for the foreign-born population - Other Southern Europe (%)
Place of birth for the foreign-born population - Albania (%)
Place of birth for the foreign-born population - Belarus (%)
Place of birth for the foreign-born population - Bosnia and Herzegovina (%)
Place of birth for the foreign-born population - Bulgaria (%)
Place of birth for the foreign-born population - Croatia (%)
Place of birth for the foreign-born population - Czechoslovakia (%)
Place of birth for the foreign-born population - Hungary (%)
Place of birth for the foreign-born population - Latvia (%)
Place of birth for the foreign-born population - Lithuania (%)
Place of birth for the foreign-born population - North Macedonia (Macedonia) (%)
Place of birth for the foreign-born population - Moldova (%)
Place of birth for the foreign-born population - Poland (%)
Place of birth for the foreign-born population - Romania (%)
Place of birth for the foreign-born population - Russia (%)
Place of birth for the foreign-born population - Serbia (%)
Place of birth for the foreign-born population - Ukraine (%)
Place of birth for the foreign-born population - Other Eastern Europe (%)
Place of birth for the foreign-born population - China (%)
Place of birth for the foreign-born population - Hong Kong (%)
Place of birth for the foreign-born population - Taiwan (%)
Place of birth for the foreign-born population - Japan (%)
Place of birth for the foreign-born population - Korea (%)
Place of birth for the foreign-born population - Other Eastern Asia (%)
Place of birth for the foreign-born population - Afghanistan (%)
Place of birth for the foreign-born population - Bangladesh (%)
Place of birth for the foreign-born population - India (%)
Place of birth for the foreign-born population - Iran (%)
Place of birth for the foreign-born population - Kazakhstan (%)
Place of birth for the foreign-born population - Nepal (%)
Place of birth for the foreign-born population - Pakistan (%)
Place of birth for the foreign-born population - Sri Lanka (%)
Place of birth for the foreign-born population - Uzbekistan (%)
Place of birth for the foreign-born population - Other South Central Asia (%)
Place of birth for the foreign-born population - Burma (%)
Place of birth for the foreign-born population - Cambodia (%)
Place of birth for the foreign-born population - Indonesia (%)
Place of birth for the foreign-born population - Laos (%)
Place of birth for the foreign-born population - Malaysia (%)
Place of birth for the foreign-born population - Philippines (%)
Place of birth for the foreign-born population - Singapore (%)
Place of birth for the foreign-born population - Thailand (%)
Place of birth for the foreign-born population - Vietnam (%)
Place of birth for the foreign-born population - Other South Eastern Asia (%)
Place of birth for the foreign-born population - Armenia (%)
Place of birth for the foreign-born population - Iraq (%)
Place of birth for the foreign-born population - Israel (%)
Place of birth for the foreign-born population - Jordan (%)
Place of birth for the foreign-born population - Kuwait (%)
Place of birth for the foreign-born population - Lebanon (%)
Place of birth for the foreign-born population - Saudi Arabia (%)
Place of birth for the foreign-born population - Syria (%)
Place of birth for the foreign-born population - Turkey (%)
Place of birth for the foreign-born population - Yemen (%)
Place of birth for the foreign-born population - Other Western Asia (%)
Place of birth for the foreign-born population - Eritrea (%)
Place of birth for the foreign-born population - Ethiopia (%)
Place of birth for the foreign-born population - Kenya (%)
Place of birth for the foreign-born population - Somalia (%)
Place of birth for the foreign-born population - Uganda (%)
Place of birth for the foreign-born population - Zimbabwe (%)
Place of birth for the foreign-born population - Other Eastern Africa (%)
Place of birth for the foreign-born population - Cameroon (%)
Place of birth for the foreign-born population - Congo (%)
Place of birth for the foreign-born population - Democratic Republic of Congo (Zaire) (%)
Place of birth for the foreign-born population - Other Middle Africa (%)
Place of birth for the foreign-born population - Egypt (%)
Place of birth for the foreign-born population - Morocco (%)
Place of birth for the foreign-born population - Sudan (%)
Place of birth for the foreign-born population - Other Northern Africa (%)
Place of birth for the foreign-born population - South Africa (%)
Place of birth for the foreign-born population - Other Southern Africa (%)
Place of birth for the foreign-born population - Cabo Verde (%)
Place of birth for the foreign-born population - Ghana (%)
Place of birth for the foreign-born population - Liberia (%)
Place of birth for the foreign-born population - Nigeria (%)
Place of birth for the foreign-born population - Senegal (%)
Place of birth for the foreign-born population - Sierra Leone (%)
Place of birth for the foreign-born population - Other Western Africa (%)
Place of birth for the foreign-born population - Australia (%)
Place of birth for the foreign-born population - New Zealand (%)
Place of birth for the foreign-born population - Fiji (%)
Place of birth for the foreign-born population - Micronesia (%)
Place of birth for the foreign-born population - Bahamas (%)
Place of birth for the foreign-born population - Barbados (%)
Place of birth for the foreign-born population - Cuba (%)
Place of birth for the foreign-born population - Dominica (%)
Place of birth for the foreign-born population - Dominican Republic (%)
Place of birth for the foreign-born population - Grenada (%)
Place of birth for the foreign-born population - Haiti (%)
Place of birth for the foreign-born population - Jamaica (%)
Place of birth for the foreign-born population - St. Vincent and the Grenadines (%)
Place of birth for the foreign-born population - Trinidad and Tobago (%)
Place of birth for the foreign-born population - West Indies (%)
Place of birth for the foreign-born population - Other Caribbean (%)
Place of birth for the foreign-born population - Belize (%)
Place of birth for the foreign-born population - Costa Rica (%)
Place of birth for the foreign-born population - El Salvador (%)
Place of birth for the foreign-born population - Guatemala (%)
Place of birth for the foreign-born population - Honduras (%)
Place of birth for the foreign-born population - Mexico (%)
Place of birth for the foreign-born population - Nicaragua (%)
Place of birth for the foreign-born population - Panama (%)
Place of birth for the foreign-born population - Other Central America (%)
Place of birth for the foreign-born population - Argentina (%)
Place of birth for the foreign-born population - Bolivia (%)
Place of birth for the foreign-born population - Brazil (%)
Place of birth for the foreign-born population - Chile (%)
Place of birth for the foreign-born population - Colombia (%)
Place of birth for the foreign-born population - Ecuador (%)
Place of birth for the foreign-born population - Guyana (%)
Place of birth for the foreign-born population - Peru (%)
Place of birth for the foreign-born population - Uruguay (%)
Place of birth for the foreign-born population - Venezuela (%)
Place of birth for the foreign-born population - Other South America (%)
Place of birth for the foreign-born population - Canada (%)
Place of birth for the foreign-born population - Other Northern America (%)
Place of birth for the foreign-born population - Other (%)
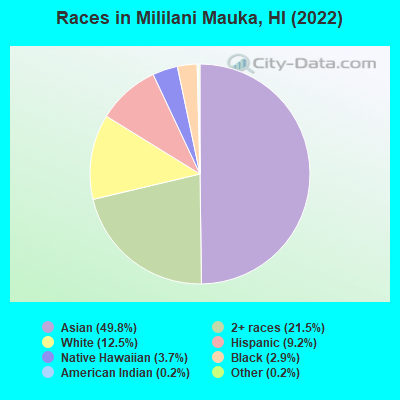
According to 2022 data, the most numerous races in Mililani Mauka, HI are Asian alone (10,570 residents), Two or more races (4,562 residents), and White alone (2,654 residents). 89.0% of Mililani Mauka residents speak English at home.
Race distribution in Mililani Mauka 10,570 49.8% Asian alone 4,562 21.5% Two or more races 2,654 12.5% White alone 1,947 9.2% Hispanic 796 3.7% Native Hawaiian and Other 608 2.9% Black alone 39 0.2% Other race alone 42 0.2% American Indian alone
2000 2022
494,149 40.8% Asian alone 277,091 22.9% White alone 218,700 18.1% Two or more races 108,441 9.0% Native Hawaiian and Other 87,699 7.2% Hispanic 20,829 1.7% Black alone 2,089 0.2% Other race alone 2,539 0.2% American Indian alone
498,125 34.6% Asian alone 318,574 22.1% Two or more races 297,937 20.7% White alone 160,103 11.1% Hispanic 134,567 9.3% Native Hawaiian and Other 23,682 1.6% Black alone 5,378 0.4% Other race alone 1,830 0.1% American Indian alone
Income and house value in Mililani Mauka Median household income in 2022 $123,453 White non-Hispanic householders$133,857 Asian householders$109,226 Native Hawaiian and other Pacific Islander householders$104,517 Some other race householders$132,377 Two or more races householders$94,996 Hispanic or Latino race householders
Median age by race in Mililani Mauka
40.7 Median age for White residents41.7 39.2 32.3 Median age for Black or African American residents31.3 36.9 36.8 Median age for American Indian / Alaska Native residents-715,953,306.7 29.3 47.2 Median age for Asian residents45.6 48.6 49.2 Median age for Native Hawaiian / Pacific Islander residents49.2 49.5 33.2 Median age for Other race residents32.6 39.5 24.5 Median age for Two or more races residents21.6 25.4 42.3 Median age for White alone residents42.2 42.5 24.0 Median age for Hispanic or Latino residents32.1 23.7
Owner/renter occupied households by race in Mililani Mauka
House owners and renters - White residents 781 56.3% Owner occupied607 43.7% Renter occupiedHouse owners and renters - Black or African American residents 131 58.5% Owner occupied93 41.5% Renter occupiedHouse owners and renters - American Indian / Alaska Native residents 11 41.7% Owner occupied15 58.3% Renter occupiedHouse owners and renters - Asian residents 3,737 88.1% Owner occupied503 11.9% Renter occupiedHouse owners and renters - Native Hawaiian / Pacific Islander residents 209 77.0% Owner occupied62 23.0% Renter occupiedHouse owners and renters - Other race residents 69 64.6% Owner occupied38 35.4% Renter occupiedHouse owners and renters - Two or more races residents 1,073 75.6% Owner occupied346 24.4% Renter occupiedHouse owners and renters - White alone residents 771 60.0% Owner occupied514 40.0% Renter occupiedHouse owners and renters - Hispanic or Latino residents 224 43.2% Owner occupied295 56.8% Renter occupied
Language usage in Mililani Mauka
English speakers - Total 89.0% of residents of Mililani Mauka speak English at home.
1.1% of residents speak Spanish at home 155 67.7% Speak English very well74 32.3% Speak English less than very well10.8% of residents speak other language at home 1,555 70.8% Speak English very well642 29.2% Speak English less than very well
English speakers - Born in the United States 94.7% of residents of Mililani Mauka speak English at home.
1.3% of residents speak Spanish at home 61 100.0% Speak English very well4.3% of residents speak other language at home 196 100.0% Speak English very well
English speakers - Native, born elsewhere 67.5% of residents of Mililani Mauka speak English at home.
5.3% of residents speak Spanish at home 13 32.5% Speak English very well27 67.5% Speak English less than very well26.9% of residents speak other language at home 198 97.5% Speak English very well5 2.5% Speak English less than very well
English speakers - Foreign-born 35.5% of residents of Mililani Mauka speak English at home.
4.3% of residents speak Spanish at home 59 62.8% Speak English very well35 37.2% Speak English less than very well60.4% of residents speak other language at home 733 55.4% Speak English very well589 44.6% Speak English less than very well
White (Caucasian) - Speak only English Native:
98.7% (2,634)Foreign-born:
61.1% (116)
White (Caucasian) - Speak another language Native:
2.2% (57)Foreign-born:
39.9% (76)
Black or African American - Speak only English Native:
98.5% (433)Foreign-born:
100.0% (83)
Black or African American - Speak another language Native:
2.4% (10)Foreign-born:
13.7% (11)
Asian - Speak only English Native:
94.5% (8,539)Foreign-born:
27.0% (424)
Asian - Speak another language Native:
6.1% (549)Foreign-born:
72.9% (1,145)
Native Hawaiian / Pacific Islander - Speak only English Native:
94.0% (639)Foreign-born:
12.7% (12)
Native Hawaiian / Pacific Islander - Speak another language Native:
7.6% (51)Foreign-born:
87.3% (86)
Other race - Speak only English Native:
85.2% (231)Foreign-born:
24.6% (19)
Other race - Speak another language Native:
17.6% (48)Foreign-born:
76.9% (59)
Two or more races - Speak only English Native:
94.0% (4,704)Foreign-born:
52.0% (56)
Two or more races - Speak another language Native:
5.9% (293)Foreign-born:
48.6% (53)
White alone - Speak only English Native:
98.8% (2,416)Foreign-born:
63.8% (118)
White alone - Speak another language Native:
1.5% (37)Foreign-born:
36.3% (67)
Hispanic or Latino - Speak only English Native:
93.0% (1,529)Foreign-born:
21.0% (23)
Hispanic or Latino - Speak another language Native:
7.5% (123)Foreign-born:
79.1% (88)
Foreign-born residents in Mililani Mauka
Marital status for residents in Mililani Mauka Marital status - White (Caucasian) population 15 years and over
Males 20.1% Never married69.0% Now married0.0% Separated1.2% Widowed9.8% DivorcedFemales 14.4% Never married63.1% Now married5.0% Separated8.1% Widowed9.3% DivorcedWomen who gave birth in the past 12 months Now married:
72.5% (47)Unmarried:
27.5% (18)
Women who did not give birth in the past 12 months Now married:
67.4% (348)Unmarried:
32.6% (169)
Marital status - Black or African American population 15 years and over
Males 35.3% Never married60.1% Now married0.0% Separated0.0% Widowed4.7% DivorcedFemales 21.6% Never married59.7% Now married0.0% Separated10.2% Widowed8.5% DivorcedWomen who gave birth in the past 12 months Now married:
100.0% (33)Unmarried:
0.0% (0)
Women who did not give birth in the past 12 months Now married:
60.8% (92)Unmarried:
39.2% (59)
Marital status - American Indian / Alaska Native population 15 years and over
Males 100.0% Never married0.0% Now married0.0% Separated0.0% Widowed0.0% DivorcedFemales 52.5% Never married30.0% Now married0.0% Separated0.0% Widowed17.5% DivorcedWomen who did not give birth in the past 12 months Now married:
36.4% (14)Unmarried:
63.6% (25)
Marital status - Asian population 15 years and over
Males 28.7% Never married64.6% Now married0.0% Separated1.3% Widowed5.4% DivorcedFemales 26.6% Never married57.3% Now married1.4% Separated4.6% Widowed10.1% DivorcedWomen who gave birth in the past 12 months Now married:
69.8% (92)Unmarried:
30.2% (40)
Women who did not give birth in the past 12 months Now married:
48.4% (1,128)Unmarried:
51.6% (1,203)
Marital status - Native Hawaiian / Pacific Islander population 15 years and over
Males 39.0% Never married46.7% Now married1.9% Separated7.4% Widowed5.0% DivorcedFemales 36.1% Never married48.4% Now married0.0% Separated3.7% Widowed11.7% DivorcedWomen who gave birth in the past 12 months Now married:
100.0% (24)Unmarried:
0.0% (0)
Women who did not give birth in the past 12 months Now married:
32.1% (45)Unmarried:
67.9% (96)
Marital status - Other race population 15 years and over
Males 10.5% Never married68.1% Now married0.0% Separated0.0% Widowed21.4% DivorcedFemales 0.0% Never married84.2% Now married0.0% Separated0.0% Widowed15.8% DivorcedWomen who gave birth in the past 12 months Now married:
100.0% (10)Unmarried:
0.0% (0)
Women who did not give birth in the past 12 months Now married:
100.0% (19)Unmarried:
0.0% (0)
Marital status - Two or more races population 15 years and over
Males 49.9% Never married46.7% Now married0.3% Separated0.0% Widowed3.0% DivorcedFemales 27.3% Never married63.6% Now married2.4% Separated0.9% Widowed5.8% DivorcedWomen who gave birth in the past 12 months Now married:
100.0% (31)Unmarried:
0.0% (0)
Women who did not give birth in the past 12 months Now married:
60.6% (843)Unmarried:
39.4% (548)
Marital status - White alone, not Hispanic / Latino population 15 years and over
Males 20.4% Never married71.6% Now married0.0% Separated1.3% Widowed6.7% DivorcedFemales 15.7% Never married62.7% Now married2.8% Separated8.5% Widowed10.3% DivorcedWomen who gave birth in the past 12 months Now married:
54.8% (22)Unmarried:
45.2% (18)
Women who did not give birth in the past 12 months Now married:
63.3% (298)Unmarried:
36.7% (172)
Marital status - Hispanic or Latino population 15 years and over
Males 30.7% Never married51.9% Now married0.0% Separated0.0% Widowed17.4% DivorcedFemales 12.6% Never married67.7% Now married4.4% Separated0.7% Widowed14.6% DivorcedWomen who gave birth in the past 12 months Now married:
61.4% (35)Unmarried:
38.6% (22)
Women who did not give birth in the past 12 months Now married:
76.5% (343)Unmarried:
23.5% (105)
Ancestries in Mililani Mauka
336 2.9% German174 1.5% English126 1.1% American123 1.1% Irish62 0.5% Portuguese62 0.5% Jamaican40 0.3% Liberian37 0.3% Norwegian34 0.3% European31 0.3% Trinidadian and Tobagonian30 0.3% Northern European29 0.3% Russian25 0.2% Italian20 0.2% Australian18 0.2% Danish15 0.1% Dutch11 0.09% Polish7 0.06% Scottish7 0.06% Turkish7 0.06% Welsh6 0.05% British6 0.05% Romanian5 0.04% French4 0.03% Austrian
Children Nativity (place of birth) in Mililani Mauka
Children under 6 years - Living with two parents Both parents native 695 100.0% NativeBoth parents foreign-born 68 100.0% NativeOne native, one foreign-born parent 180 100.0% NativeChildren under 6 years - Living with one parent Native parent 253 100.0% NativeChildren 6 to 17 years - Living with two parents Both parents native 2,278 98.7% Native29 1.3% Foreign-bornBoth parents foreign-born 98 63.1% Native57 36.9% Foreign-bornOne native, one foreign-born parent 531 96.0% Native22 4.0% Foreign-bornChildren 6 to 17 years - Living with one parent Native parent 724 99.3% Native5 0.7% Foreign-bornForeign-born parent 12 100.0% Native
Grandparents responsible for own grandchildren in Mililani Mauka
Grandparents (30 to 59 years) White / Caucasian 9 32.2% Responsible for grandchildren19 67.8% Not responsible for grandchildrenAsian 6 12.0% Responsible for grandchildren41 88.0% Not responsible for grandchildrenTwo or more races 115 100.0% Not responsible for grandchildrenWhite alone, not Hispanic / Latino 6 22.5% Responsible for grandchildren21 77.5% Not responsible for grandchildrenHispanic or Latino 1 9.9% Responsible for grandchildren11 90.1% Not responsible for grandchildrenGrandparents (60 years and over) White / Caucasian 2 3.4% Responsible for grandchildren45 96.6% Not responsible for grandchildrenAsian 5 2.9% Responsible for grandchildren181 97.1% Not responsible for grandchildrenTwo or more races 47 100.0% Not responsible for grandchildrenWhite alone, not Hispanic / Latino 2 4.1% Responsible for grandchildren44 95.9% Not responsible for grandchildrenHispanic or Latino 13 100.0% Not responsible for grandchildren