Races in Pleasant Prairie, Wisconsin (WI) Detailed Stats
Data:
Races - White alone (%)
Races - White alone (% change since 2000)
Races - Black alone (%)
Races - Black alone (% change since 2000)
Races - American Indian alone (%)
Races - American Indian alone (% change since 2000)
Races - Asian alone (%)
Races - Asian alone (% change since 2000)
Races - Hispanic (%)
Races - Hispanic (% change since 2000)
Races - Native Hawaiian and Other Pacific Islander alone (%)
Races - Native Hawaiian and Other Pacific Islander alone (% change since 2000)
Races - Two or more races(%)
Races - Two or more races(% change since 2000)
Races - Other race alone (%)
Races - Other race alone (% change since 2000)
Racial diversity
Place of birth - Born in state of residence (%)
Place of birth - Born in state of residence (%) - White
Place of birth - Born in state of residence (%) - Black or African American
Place of birth - Born in state of residence (%) - Asian
Place of birth - Born in state of residence (%) - Hispanic or Latino
Place of birth - Born in state of residence (%) - American Indian and Alaska Native
Place of birth - Born in state of residence (%) - Multirace
Place of birth - Born in state of residence (%) - Other Race
Place of birth - Born in other state (%)
Place of birth - Born in other state (%) - White
Place of birth - Born in other state (%) - Black or African American
Place of birth - Born in other state (%) - Asian
Place of birth - Born in other state (%) - Hispanic or Latino
Place of birth - Born in other state (%) - American Indian and Alaska Native
Place of birth - Born in other state (%) - Multirace
Place of birth - Born in other state (%) - Other Race
Place of birth - Native, outside of US (%)
Place of birth - Native, outside of US (%) - White
Place of birth - Native, outside of US (%) - Black or African American
Place of birth - Native, outside of US (%) - Asian
Place of birth - Native, outside of US (%) - Hispanic or Latino
Place of birth - Native, outside of US (%) - American Indian and Alaska Native
Place of birth - Native, outside of US (%) - Multirace
Place of birth - Native, outside of US (%) - Other Race
Place of birth - Foreign born (%)
Place of birth - Foreign born (%) - White
Place of birth - Foreign born (%) - Black or African American
Place of birth - Foreign born (%) - Asian
Place of birth - Foreign born (%) - Hispanic or Latino
Place of birth - Foreign born (%) - American Indian and Alaska Native
Place of birth - Foreign born (%) - Multirace
Place of birth - Foreign born (%) - Other Race
Residents speaking English at home (%)
Residents speaking English at home - Born in the United States (%)
Residents speaking English at home - Native, born elsewhere (%)
Residents speaking English at home - Foreign born (%)
Residents speaking Spanish at home (%)
Residents speaking Spanish at home - Born in the United States (%)
Residents speaking Spanish at home - Native, born elsewhere (%)
Residents speaking Spanish at home - Foreign born (%)
Residents speaking other language at home (%)
Residents speaking other language at home - Born in the United States (%)
Residents speaking other language at home - Native, born elsewhere (%)
Residents speaking other language at home - Foreign born (%)
Marital status - Never married (%)
Marital status - Now married (%)
Marital status - Separated (%)
Marital status - Widowed (%)
Marital status - Divorced (%)
Ancestries Reported - Arab (%)
Ancestries Reported - Czech (%)
Ancestries Reported - Danish (%)
Ancestries Reported - Dutch (%)
Ancestries Reported - English (%)
Ancestries Reported - French (%)
Ancestries Reported - French Canadian (%)
Ancestries Reported - German (%)
Ancestries Reported - Greek (%)
Ancestries Reported - Hungarian (%)
Ancestries Reported - Irish (%)
Ancestries Reported - Italian (%)
Ancestries Reported - Lithuanian (%)
Ancestries Reported - Norwegian (%)
Ancestries Reported - Polish (%)
Ancestries Reported - Portuguese (%)
Ancestries Reported - Russian (%)
Ancestries Reported - Scotch-Irish (%)
Ancestries Reported - Scottish (%)
Ancestries Reported - Slovak (%)
Ancestries Reported - Subsaharan African (%)
Ancestries Reported - Swedish (%)
Ancestries Reported - Swiss (%)
Ancestries Reported - Ukrainian (%)
Ancestries Reported - United States (%)
Ancestries Reported - Welsh (%)
Ancestries Reported - West Indian (%)
Ancestries Reported - Other (%)
Geographical mobility - Same house 1 year ago (%)
Geographical mobility - Same house 1 year ago (%) - White
Geographical mobility - Same house 1 year ago (%) - Black or African American
Geographical mobility - Same house 1 year ago (%) - Asian
Geographical mobility - Same house 1 year ago (%) - Hispanic or Latino
Geographical mobility - Same house 1 year ago (%) - American Indian and Alaska Native
Geographical mobility - Same house 1 year ago (%) - Multirace
Geographical mobility - Same house 1 year ago (%) - Other Race
Geographical mobility - Moved within same county (%)
Geographical mobility - Moved within same county (%) - White
Geographical mobility - Moved within same county (%) - Black or African American
Geographical mobility - Moved within same county (%) - Asian
Geographical mobility - Moved within same county (%) - Hispanic or Latino
Geographical mobility - Moved within same county (%) - American Indian and Alaska Native
Geographical mobility - Moved within same county (%) - Multirace
Geographical mobility - Moved within same county (%) - Other Race
Geographical mobility - Moved from different county within same state (%)
Geographical mobility - Moved from different county within same state (%) - White
Geographical mobility - Moved from different county within same state (%) - Black or African American
Geographical mobility - Moved from different county within same state (%) - Asian
Geographical mobility - Moved from different county within same state (%) - Hispanic or Latino
Geographical mobility - Moved from different county within same state (%) - American Indian and Alaska Native
Geographical mobility - Moved from different county within same state (%) - Multirace
Geographical mobility - Moved from different county within same state (%) - Other Race
Geographical mobility - Moved from different state (%)
Geographical mobility - Moved from different state (%) - White
Geographical mobility - Moved from different state (%) - Black or African American
Geographical mobility - Moved from different state (%) - Asian
Geographical mobility - Moved from different state (%) - Hispanic or Latino
Geographical mobility - Moved from different state (%) - American Indian and Alaska Native
Geographical mobility - Moved from different state (%) - Multirace
Geographical mobility - Moved from different state (%) - Other Race
Geographical mobility - Moved from abroad (%)
Geographical mobility - Moved from abroad (%) - White
Geographical mobility - Moved from abroad (%) - Black or African American
Geographical mobility - Moved from abroad (%) - Asian
Geographical mobility - Moved from abroad (%) - Hispanic or Latino
Geographical mobility - Moved from abroad (%) - American Indian and Alaska Native
Geographical mobility - Moved from abroad (%) - Multirace
Geographical mobility - Moved from abroad (%) - Other Race
Place of birth for the foreign-born population - Ireland (%)
Place of birth for the foreign-born population - Denmark (%)
Place of birth for the foreign-born population - Norway (%)
Place of birth for the foreign-born population - Sweden (%)
Place of birth for the foreign-born population - United Kingdom (%)
Place of birth for the foreign-born population - England (%)
Place of birth for the foreign-born population - Scotland (%)
Place of birth for the foreign-born population - Other Northern Europe (%)
Place of birth for the foreign-born population - Austria (%)
Place of birth for the foreign-born population - Belgium (%)
Place of birth for the foreign-born population - France (%)
Place of birth for the foreign-born population - Germany (%)
Place of birth for the foreign-born population - Netherlands (%)
Place of birth for the foreign-born population - Switzerland (%)
Place of birth for the foreign-born population - Other Western Europe (%)
Place of birth for the foreign-born population - Greece (%)
Place of birth for the foreign-born population - Italy (%)
Place of birth for the foreign-born population - Portugal (%)
Place of birth for the foreign-born population - Spain (%)
Place of birth for the foreign-born population - Other Southern Europe (%)
Place of birth for the foreign-born population - Albania (%)
Place of birth for the foreign-born population - Belarus (%)
Place of birth for the foreign-born population - Bosnia and Herzegovina (%)
Place of birth for the foreign-born population - Bulgaria (%)
Place of birth for the foreign-born population - Croatia (%)
Place of birth for the foreign-born population - Czechoslovakia (%)
Place of birth for the foreign-born population - Hungary (%)
Place of birth for the foreign-born population - Latvia (%)
Place of birth for the foreign-born population - Lithuania (%)
Place of birth for the foreign-born population - North Macedonia (Macedonia) (%)
Place of birth for the foreign-born population - Moldova (%)
Place of birth for the foreign-born population - Poland (%)
Place of birth for the foreign-born population - Romania (%)
Place of birth for the foreign-born population - Russia (%)
Place of birth for the foreign-born population - Serbia (%)
Place of birth for the foreign-born population - Ukraine (%)
Place of birth for the foreign-born population - Other Eastern Europe (%)
Place of birth for the foreign-born population - China (%)
Place of birth for the foreign-born population - Hong Kong (%)
Place of birth for the foreign-born population - Taiwan (%)
Place of birth for the foreign-born population - Japan (%)
Place of birth for the foreign-born population - Korea (%)
Place of birth for the foreign-born population - Other Eastern Asia (%)
Place of birth for the foreign-born population - Afghanistan (%)
Place of birth for the foreign-born population - Bangladesh (%)
Place of birth for the foreign-born population - India (%)
Place of birth for the foreign-born population - Iran (%)
Place of birth for the foreign-born population - Kazakhstan (%)
Place of birth for the foreign-born population - Nepal (%)
Place of birth for the foreign-born population - Pakistan (%)
Place of birth for the foreign-born population - Sri Lanka (%)
Place of birth for the foreign-born population - Uzbekistan (%)
Place of birth for the foreign-born population - Other South Central Asia (%)
Place of birth for the foreign-born population - Burma (%)
Place of birth for the foreign-born population - Cambodia (%)
Place of birth for the foreign-born population - Indonesia (%)
Place of birth for the foreign-born population - Laos (%)
Place of birth for the foreign-born population - Malaysia (%)
Place of birth for the foreign-born population - Philippines (%)
Place of birth for the foreign-born population - Singapore (%)
Place of birth for the foreign-born population - Thailand (%)
Place of birth for the foreign-born population - Vietnam (%)
Place of birth for the foreign-born population - Other South Eastern Asia (%)
Place of birth for the foreign-born population - Armenia (%)
Place of birth for the foreign-born population - Iraq (%)
Place of birth for the foreign-born population - Israel (%)
Place of birth for the foreign-born population - Jordan (%)
Place of birth for the foreign-born population - Kuwait (%)
Place of birth for the foreign-born population - Lebanon (%)
Place of birth for the foreign-born population - Saudi Arabia (%)
Place of birth for the foreign-born population - Syria (%)
Place of birth for the foreign-born population - Turkey (%)
Place of birth for the foreign-born population - Yemen (%)
Place of birth for the foreign-born population - Other Western Asia (%)
Place of birth for the foreign-born population - Eritrea (%)
Place of birth for the foreign-born population - Ethiopia (%)
Place of birth for the foreign-born population - Kenya (%)
Place of birth for the foreign-born population - Somalia (%)
Place of birth for the foreign-born population - Uganda (%)
Place of birth for the foreign-born population - Zimbabwe (%)
Place of birth for the foreign-born population - Other Eastern Africa (%)
Place of birth for the foreign-born population - Cameroon (%)
Place of birth for the foreign-born population - Congo (%)
Place of birth for the foreign-born population - Democratic Republic of Congo (Zaire) (%)
Place of birth for the foreign-born population - Other Middle Africa (%)
Place of birth for the foreign-born population - Egypt (%)
Place of birth for the foreign-born population - Morocco (%)
Place of birth for the foreign-born population - Sudan (%)
Place of birth for the foreign-born population - Other Northern Africa (%)
Place of birth for the foreign-born population - South Africa (%)
Place of birth for the foreign-born population - Other Southern Africa (%)
Place of birth for the foreign-born population - Cabo Verde (%)
Place of birth for the foreign-born population - Ghana (%)
Place of birth for the foreign-born population - Liberia (%)
Place of birth for the foreign-born population - Nigeria (%)
Place of birth for the foreign-born population - Senegal (%)
Place of birth for the foreign-born population - Sierra Leone (%)
Place of birth for the foreign-born population - Other Western Africa (%)
Place of birth for the foreign-born population - Australia (%)
Place of birth for the foreign-born population - New Zealand (%)
Place of birth for the foreign-born population - Fiji (%)
Place of birth for the foreign-born population - Micronesia (%)
Place of birth for the foreign-born population - Bahamas (%)
Place of birth for the foreign-born population - Barbados (%)
Place of birth for the foreign-born population - Cuba (%)
Place of birth for the foreign-born population - Dominica (%)
Place of birth for the foreign-born population - Dominican Republic (%)
Place of birth for the foreign-born population - Grenada (%)
Place of birth for the foreign-born population - Haiti (%)
Place of birth for the foreign-born population - Jamaica (%)
Place of birth for the foreign-born population - St. Vincent and the Grenadines (%)
Place of birth for the foreign-born population - Trinidad and Tobago (%)
Place of birth for the foreign-born population - West Indies (%)
Place of birth for the foreign-born population - Other Caribbean (%)
Place of birth for the foreign-born population - Belize (%)
Place of birth for the foreign-born population - Costa Rica (%)
Place of birth for the foreign-born population - El Salvador (%)
Place of birth for the foreign-born population - Guatemala (%)
Place of birth for the foreign-born population - Honduras (%)
Place of birth for the foreign-born population - Mexico (%)
Place of birth for the foreign-born population - Nicaragua (%)
Place of birth for the foreign-born population - Panama (%)
Place of birth for the foreign-born population - Other Central America (%)
Place of birth for the foreign-born population - Argentina (%)
Place of birth for the foreign-born population - Bolivia (%)
Place of birth for the foreign-born population - Brazil (%)
Place of birth for the foreign-born population - Chile (%)
Place of birth for the foreign-born population - Colombia (%)
Place of birth for the foreign-born population - Ecuador (%)
Place of birth for the foreign-born population - Guyana (%)
Place of birth for the foreign-born population - Peru (%)
Place of birth for the foreign-born population - Uruguay (%)
Place of birth for the foreign-born population - Venezuela (%)
Place of birth for the foreign-born population - Other South America (%)
Place of birth for the foreign-born population - Canada (%)
Place of birth for the foreign-born population - Other Northern America (%)
Place of birth for the foreign-born population - Other (%)
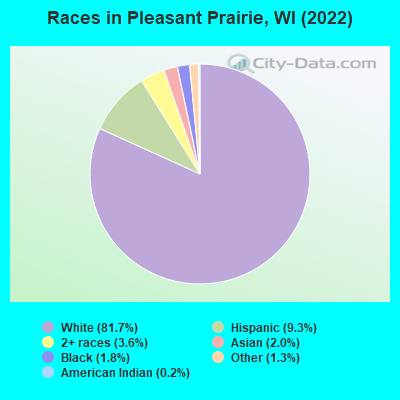
According to 2022 data, the most numerous races in Pleasant Prairie, WI are White alone (17,376 residents), Hispanic (1,984 residents), and Black alone (385 residents). 91.2% of Pleasant Prairie residents speak English at home. 5.7% of Pleasant Prairie, WI residents are foreign-born (1.9% born in Latin America, 1.6% born in Asia, 1.2% born in Europe, 0.9% born in Africa), which is 12.7% greater than the foreign-born rate of 5.0% across the entire state of Wisconsin.
Race distribution in Pleasant Prairie
2000 2022
4,681,630 87.3% White alone 300,245 5.6% Black alone 192,921 3.6% Hispanic 87,995 1.6% Asian alone 51,921 1.0% Two or more races 43,980 0.8% American Indian alone 3,637 0.07% Other race alone 1,346 0.03% Native Hawaiian and Other
4,654,031 79.0% White alone 447,022 7.6% Hispanic 345,678 5.9% Black alone 217,532 3.7% Two or more races 172,242 2.9% Asian alone 33,762 0.6% American Indian alone 19,680 0.3% Other race alone 2,592 0.04% Native Hawaiian and Other
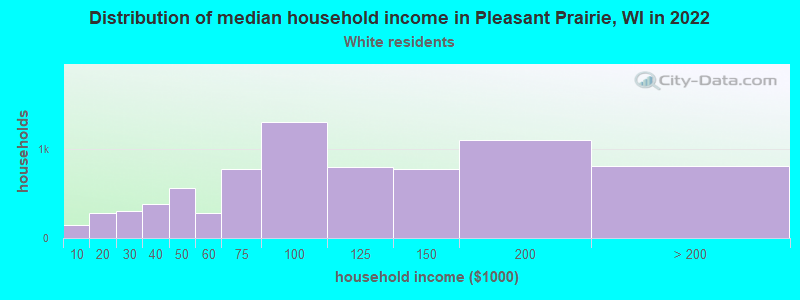
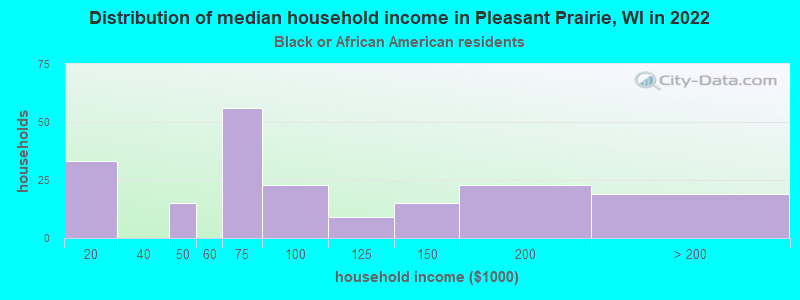
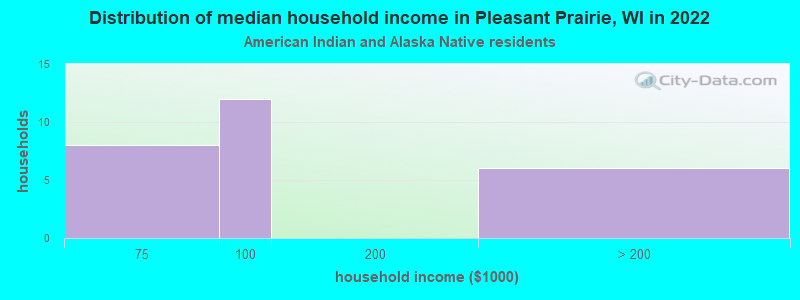
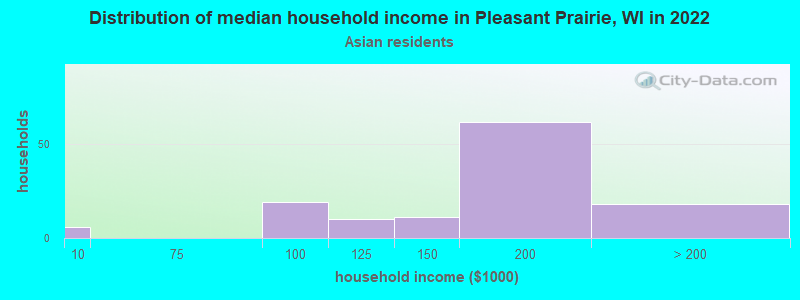
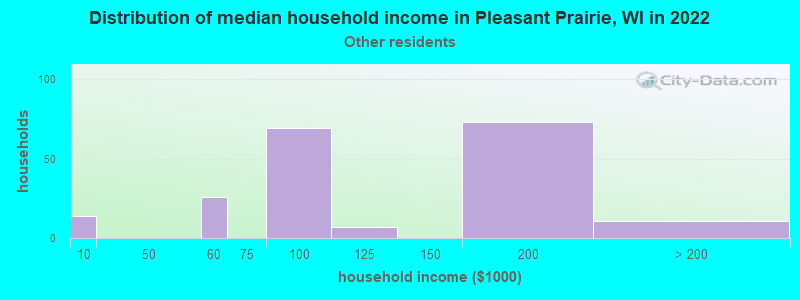
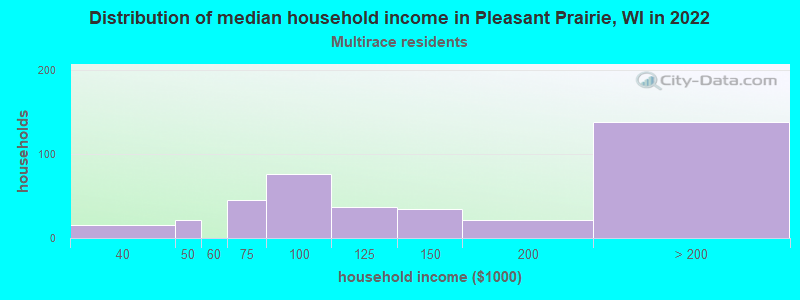
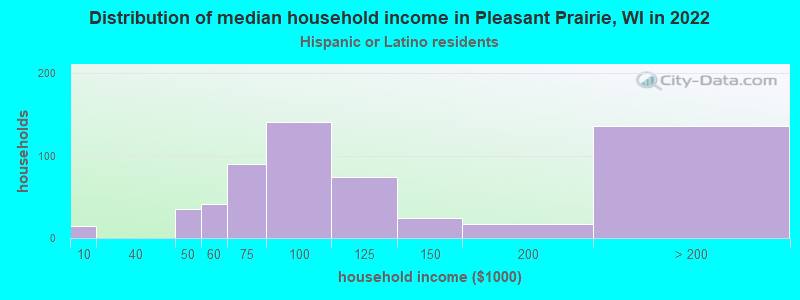
Income and house value in Pleasant Prairie Median household income in 2022 $95,884 White non-Hispanic householders$60,380 Black householdersover $200,000 Asian householders$74,377 Some other race householders$170,133 Two or more races householders$107,879 Hispanic or Latino race householdersMedian 2022 house value $353,459 White Non-Hispanic householders$358,534 Black or African American householders$279,767 American Indian or Alaska Native householders $468,852 Asian householders$303,375 Some other race householders$309,332 Two or more races householders$333,381 Hispanic or Latino householders
Median age by race in Pleasant Prairie
47.2 Median age for White residents46.6 48.2 50.8 Median age for Black or African American residents70.4 38.1 33.0 Median age for American Indian / Alaska Native residents110.7 25.7 44.4 Median age for Asian residents43.9 42.0 -825,688,072.6 Median age for Native Hawaiian / Pacific Islander residents-862,745,097.2 -732,444,443.7 36.1 Median age for Other race residents31.9 29.4 28.7 Median age for Two or more races residents24.5 29.5 46.8 Median age for White alone residents46.2 47.7 26.5 Median age for Hispanic or Latino residents33.5 27.5
Owner/renter occupied households by race in Pleasant Prairie
House owners and renters - White residents 5,970 78.6% Owner occupied1,630 21.4% Renter occupiedHouse owners and renters - Black or African American residents 66 34.1% Owner occupied127 65.9% Renter occupiedHouse owners and renters - American Indian / Alaska Native residents 27 100.0% Owner occupiedHouse owners and renters - Asian residents 133 74.3% Owner occupied46 25.7% Renter occupiedHouse owners and renters - Other race residents 238 90.1% Owner occupied26 9.9% Renter occupiedHouse owners and renters - Two or more races residents 486 91.9% Owner occupied43 8.1% Renter occupiedHouse owners and renters - White alone residents 5,949 78.3% Owner occupied1,649 21.7% Renter occupiedHouse owners and renters - Hispanic or Latino residents 525 90.6% Owner occupied55 9.4% Renter occupied
Language usage in Pleasant Prairie
English speakers - Total 91.2% of residents of Pleasant Prairie speak English at home.
3.4% of residents speak Spanish at home 490 72.0% Speak English very well191 28.0% Speak English less than very well5.4% of residents speak other language at home 892 82.4% Speak English very well190 17.6% Speak English less than very well
English speakers - Born in the United States 90.3% of residents of Pleasant Prairie speak English at home.
3.8% of residents speak Spanish at home 163 49.5% Speak English very well166 50.5% Speak English less than very well3.9% of residents speak other language at home 300 89.0% Speak English very well37 11.0% Speak English less than very well
All residents speak only English at home
English speakers - Foreign-born 14.5% of residents of Pleasant Prairie speak English at home.
29.9% of residents speak Spanish at home 230 71.9% Speak English very well90 28.1% Speak English less than very well62.7% of residents speak other language at home 499 74.5% Speak English very well171 25.5% Speak English less than very well
White (Caucasian) - Speak only English Native:
98.5% (16,130)Foreign-born:
49.0% (96)
White (Caucasian) - Speak another language Native:
1.7% (270)Foreign-born:
53.8% (105)
Black or African American - Speak only English Native:
92.1% (236)Foreign-born:
7.2% (14)
Black or African American - Speak another language Native:
5.6% (14)Foreign-born:
100.0% (195)
Asian - Speak another language Native:
39.6% (38)Foreign-born:
99.2% (332)
Other race - Speak only English Native:
100.0% (575)Foreign-born:
14.8% (13)
Other race - Speak another language Native:
1.6% (9)Foreign-born:
79.4% (69)
Two or more races - Speak only English Native:
71.9% (1,283)Foreign-born:
10.7% (34)
Two or more races - Speak another language Native:
19.7% (352)Foreign-born:
85.8% (270)
White alone - Speak only English Native:
96.8% (15,817)Foreign-born:
42.0% (94)
White alone - Speak another language Native:
2.6% (432)Foreign-born:
57.4% (128)
Hispanic or Latino - Speak only English Native:
86.3% (1,341)Foreign-born:
9.3% (30)
Hispanic or Latino - Speak another language Native:
14.2% (221)Foreign-born:
90.6% (292)
Foreign-born residents in Pleasant Prairie 1,218 residents are foreign born (1.9% Latin America , 1.6% Asia , 1.2% Europe , 0.9% Africa ).
This city:
5.7%Wisconsin:
5.0%
Marital status for residents in Pleasant Prairie Marital status - White (Caucasian) population 15 years and over
Males 28.8% Never married58.2% Now married0.2% Separated3.7% Widowed9.1% DivorcedFemales 26.7% Never married55.0% Now married0.3% Separated8.2% Widowed9.8% DivorcedWomen who gave birth in the past 12 months Now married:
69.6% (120)Unmarried:
30.4% (53)
Women who did not give birth in the past 12 months Now married:
39.3% (1,251)Unmarried:
60.7% (1,929)
Marital status - Black or African American population 15 years and over
Males 36.2% Never married30.7% Now married23.1% Separated1.0% Widowed9.0% DivorcedFemales 21.3% Never married70.0% Now married7.2% Separated0.0% Widowed1.4% DivorcedWomen who gave birth in the past 12 months Now married:
100.0% (95)Unmarried:
0.0% (0)
Women who did not give birth in the past 12 months Now married:
38.2% (25)Unmarried:
61.8% (41)
Marital status - American Indian / Alaska Native population 15 years and over
Males 0.0% Never married100.0% Now married0.0% Separated0.0% Widowed0.0% DivorcedFemales 39.5% Never married60.5% Now married0.0% Separated0.0% Widowed0.0% DivorcedWomen who did not give birth in the past 12 months Now married:
60.5% (25)Unmarried:
39.5% (16)
Marital status - Asian population 15 years and over
Males 37.1% Never married62.9% Now married0.0% Separated0.0% Widowed0.0% DivorcedFemales 18.9% Never married70.8% Now married0.0% Separated10.3% Widowed0.0% DivorcedWomen who did not give birth in the past 12 months Now married:
61.1% (68)Unmarried:
38.9% (43)
Marital status - Other race population 15 years and over
Males 0.0% Never married100.0% Now married0.0% Separated0.0% Widowed0.0% DivorcedFemales 60.2% Never married32.3% Now married0.0% Separated0.0% Widowed7.5% DivorcedWomen who gave birth in the past 12 months Now married:
0.0% (0)Unmarried:
100.0% (48)
Women who did not give birth in the past 12 months Now married:
0.0% (0)Unmarried:
100.0% (66)
Marital status - Two or more races population 15 years and over
Males 63.8% Never married31.9% Now married0.0% Separated0.0% Widowed4.3% DivorcedFemales 60.7% Never married37.0% Now married0.0% Separated0.0% Widowed2.3% DivorcedWomen who gave birth in the past 12 months Now married:
0.0% (0)Unmarried:
100.0% (6)
Women who did not give birth in the past 12 months Now married:
29.0% (255)Unmarried:
71.0% (626)
Marital status - White alone, not Hispanic / Latino population 15 years and over
Males 27.7% Never married59.1% Now married0.3% Separated3.8% Widowed9.1% DivorcedFemales 26.7% Never married54.8% Now married0.3% Separated8.3% Widowed9.9% DivorcedWomen who gave birth in the past 12 months Now married:
69.6% (123)Unmarried:
30.4% (54)
Women who did not give birth in the past 12 months Now married:
39.5% (1,285)Unmarried:
60.5% (1,964)
Marital status - Hispanic or Latino population 15 years and over
Males 38.6% Never married56.9% Now married0.0% Separated0.0% Widowed4.5% DivorcedFemales 66.1% Never married29.9% Now married0.0% Separated0.0% Widowed4.0% DivorcedWomen who gave birth in the past 12 months Now married:
0.0% (0)Unmarried:
100.0% (59)
Women who did not give birth in the past 12 months Now married:
21.7% (127)Unmarried:
78.3% (458)
Ancestries in Pleasant Prairie
2,370 25.6% German938 10.1% Italian691 7.5% Polish663 7.1% American408 4.4% Irish363 3.9% English228 2.5% Danish188 2.0% Norwegian169 1.8% European140 1.5% Zimbabwean103 1.1% Czech99 1.1% Finnish94 1.0% Ukrainian92 1.0% Scandinavian79 0.9% Lithuanian49 0.5% Dutch43 0.5% Greek34 0.4% Swiss31 0.3% Nigerian30 0.3% Scottish25 0.3% Iranian23 0.2% British23 0.2% Eastern European19 0.2% Romanian18 0.2% Czechoslovakian18 0.2% Slovak17 0.2% Swedish17 0.2% Jamaican17 0.2% French Canadian16 0.2% Scotch-Irish16 0.2% Egyptian14 0.2% Hungarian12 0.1% Austrian9 0.10% Assyrian8 0.09% Croatian7 0.08% African6 0.06% Canadian6 0.06% Armenian4 0.04% French2 0.02% Icelander
Geographical mobility in Pleasant Prairie Same house 1 year ago 15,381 90.2% White (Caucasian)321 75.4% Black or African American70 100.0% American Indian / Alaska Native358 86.5% Asian387 64.1% Other race1,885 90.0% Two or more races15,486 90.3% White alone, not Hispanic / Latino1,407 71.7% Hispanic or LatinoMoved within same county 1,017 6.0% White / Caucasian16 3.7% Black or African American21 5.0% Asian191 31.6% Other race100 4.8% Two or more races1,023 6.0% White alone, not Hispanic / Latino305 15.5% Hispanic or LatinoMoved within same state 185 1.1% White / Caucasian90 21.0% Black or African American18 4.3% Asian189 1.1% White alone, not Hispanic / Latino42 2.1% Hispanic or LatinoMoved from different state 372 2.2% White / Caucasian14 3.4% Asian19 3.2% Other race347 2.0% White alone, not Hispanic / Latino60 3.0% Hispanic or LatinoMoved from abroad 29 0.2% White31 0.2% White alone, not Hispanic / Latino
Children Nativity (place of birth) in Pleasant Prairie
Children under 6 years - Living with two parents Both parents native 602 100.0% NativeOne native, one foreign-born parent 228 100.0% NativeChildren under 6 years - Living with one parent Native parent 473 100.0% NativeChildren 6 to 17 years - Living with two parents Both parents native 1,966 99.2% Native15 0.8% Foreign-bornBoth parents foreign-born 45 100.0% NativeOne native, one foreign-born parent 68 100.0% NativeChildren 6 to 17 years - Living with one parent Native parent 728 100.0% NativeForeign-born parent 22 50.0% Native22 50.0% Foreign-born
Grandparents responsible for own grandchildren in Pleasant Prairie
Grandparents (30 to 59 years) White / Caucasian 13 25.5% Responsible for grandchildren39 74.5% Not responsible for grandchildrenOther race 75 100.0% Not responsible for grandchildrenTwo or more races 9 100.0% Not responsible for grandchildrenWhite alone, not Hispanic / Latino 14 25.6% Responsible for grandchildren40 74.4% Not responsible for grandchildrenHispanic or Latino 70 100.0% Not responsible for grandchildrenGrandparents (60 years and over) White / Caucasian 50 24.5% Responsible for grandchildren154 75.5% Not responsible for grandchildrenWhite alone, not Hispanic / Latino 50 23.2% Responsible for grandchildren167 76.8% Not responsible for grandchildren