Races in Prospect, Connecticut (CT) Detailed Stats
Ancestries, Foreign-born residents, place of birth

Discuss Prospect, Connecticut races on our local forum with over 2,400,000 registered users
5.7% of Prospect, CT residents are foreign-born (3.9% born in Europe, 0.9% born in Asia), which is 164.4% less than the foreign-born rate of 15.0% across the entire state of Connecticut.
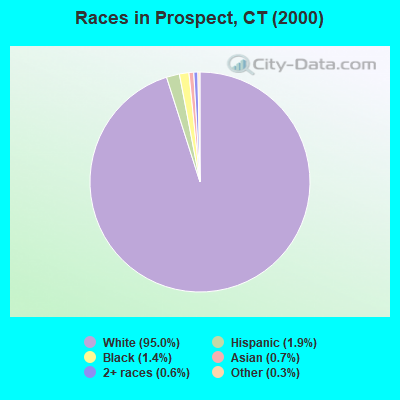
Race distribution in Prospect

- 8,26895.0%White alone
- 1681.9%Hispanic
- 1221.4%Black alone
- 630.7%Asian alone
- 550.6%Two or more races
- 240.3%Other race alone
- 70.08%American Indian alone
2000
2022
-
- 2,638,84577.5%White alone
- 320,3239.4%Hispanic
- 295,5718.7%Black alone
- 81,5642.4%Asian alone
- 52,8961.6%Two or more races
- 8,1410.2%Other race alone
- 7,2670.2%American Indian alone
- 9580.03%Native Hawaiian and Other
Pacific Islander alone

-
- 2,246,91362.0%White alone
- 658,97818.2%Hispanic
- 353,9739.8%Black alone
- 172,9294.8%Asian alone
- 159,6314.4%Two or more races
- 29,7610.8%Other race alone
- 3,4280.09%American Indian alone
- 5920.02%Native Hawaiian and Other
Pacific Islander alone

Income and house value in Prospect
- Median household income in 2022
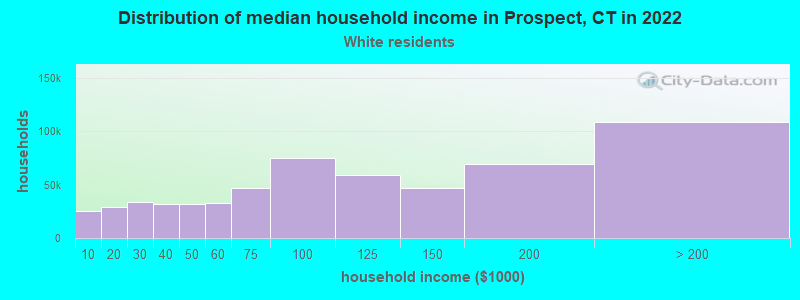
- $111,919White non-Hispanic householders
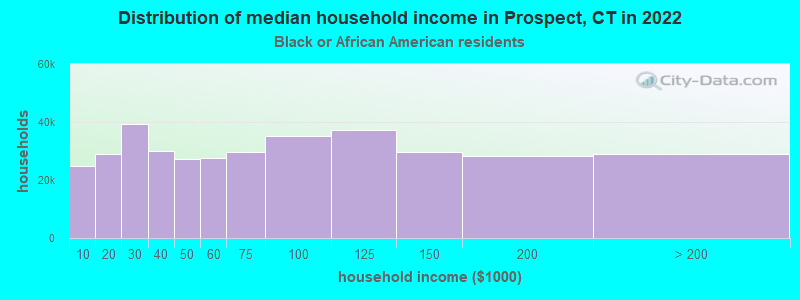
- $160,925Black householders
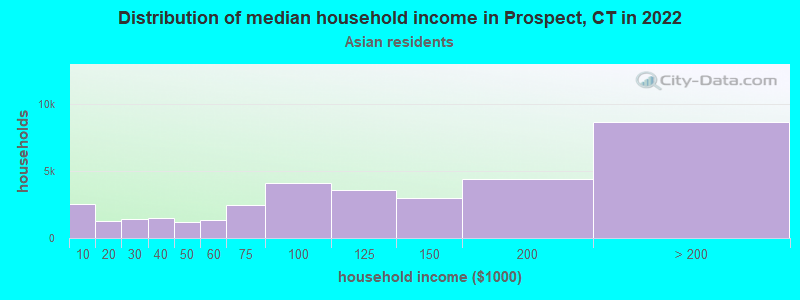
- $64,698Asian householders
- $189,001Some other race householders
- $146,673Two or more races householders
- $185,969Hispanic or Latino race householders
- Median 2022 house value
- $391,518White Non-Hispanic householders
- $457,024Black or African American householders
- $351,307Asian householders
- $355,847Some other race householders
- $243,212Two or more races householders
- $464,806Hispanic or Latino householders
Household income for White non-Hispanic householders
Household income for Black householders
Household income for Asian householders
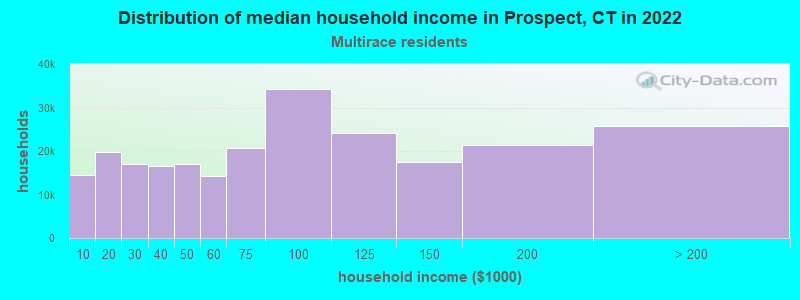
Household income for Two or more races householders
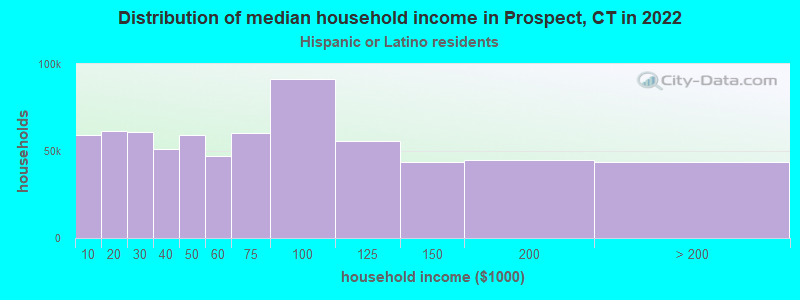
Household income for Hispanic or Latino race householders
Foreign-born residents in Prospect
494 residents are foreign born (3.9% Europe, 0.9% Asia).
| This city: | 5.7% |
| Connecticut: | 10.9% |
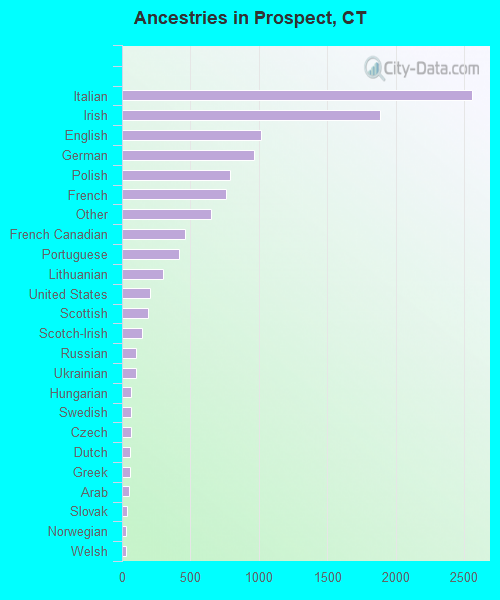
Ancestries in Prospect

- 2,55523.1%Italian
- 1,88417.0%Irish
- 1,0189.2%English
- 9668.7%German
- 7887.1%Polish
- 7616.9%French
- 6505.9%Other
- 4594.2%French Canadian
- 4163.8%Portuguese
- 3022.7%Lithuanian
- 2051.9%United States
- 1881.7%Scottish
- 1461.3%Scotch-Irish
- 1040.9%Russian
- 1000.9%Ukrainian
- 680.6%Hungarian
- 670.6%Swedish
- 640.6%Czech
- 620.6%Dutch
- 590.5%Greek
- 480.4%Arab
- 390.4%Slovak
- 290.3%Norwegian
- 260.2%Welsh
- 210.2%Swiss
- 160.1%West Indian
- 90.08%Danish
- 60.05%Subsaharan African
Zip codes: 06712.