Races in St. Francis, Wisconsin (WI) Detailed Stats
Ancestries, Foreign-born residents, place of birth
Settings
X


Recent posts about races in St. Francis, Wisconsin on our local forum with over 2,400,000 registered users:
 | Why are race relations so bad in the Milwaukee Metro Area (34 replies) |
| would like a short term (1 month) rental home while transitioning (1 reply) |
| Considering Milwaukee from Seattle (25 replies) |
| Should we move to Cudahy? (5 replies) |
| Brown Deer, potential new resident (7 replies) |
| Returning to WI (12 replies) |
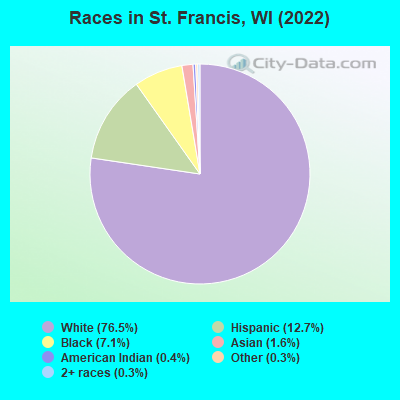
According to 2022 data, the most numerous races in St. Francis, WI are White alone (6,999 residents), Hispanic (1,162 residents), and Black alone (649 residents). 89.4% of St. Francis residents speak English at home. 5.0% of St. Francis, WI residents are foreign-born (2.2% born in Asia, 1.3% born in Europe, 0.8% born in Latin America), which is about the same as the foreign-born rate of 5.0% across the entire state of Wisconsin.
Race distribution in St. Francis
2000
2022

- 7,91491.4%White alone
- 3924.5%Hispanic
- 1171.4%Two or more races
- 911.1%Asian alone
- 800.9%Black alone
- 630.7%American Indian alone
- 30.03%Other race alone
- 20.02%Native Hawaiian and Other
Pacific Islander alone

-
- 6,99976.5%White alone
- 1,16212.7%Hispanic
- 6497.1%Black alone
- 1451.6%Asian alone
- 390.4%American Indian alone
- 260.3%Two or more races
- 320.3%Other race alone
2000
2022
-
- 4,681,63087.3%White alone
- 300,2455.6%Black alone
- 192,9213.6%Hispanic
- 87,9951.6%Asian alone
- 51,9211.0%Two or more races
- 43,9800.8%American Indian alone
- 3,6370.07%Other race alone
- 1,3460.03%Native Hawaiian and Other
Pacific Islander alone

-
- 4,654,03179.0%White alone
- 447,0227.6%Hispanic
- 345,6785.9%Black alone
- 217,5323.7%Two or more races
- 172,2422.9%Asian alone
- 33,7620.6%American Indian alone
- 19,6800.3%Other race alone
- 2,5920.04%Native Hawaiian and Other
Pacific Islander alone

Income and house value in St. Francis
- Median household income in 2022
- $51,347White non-Hispanic householders
- $2,535Black householders
- $33,023Asian householders
- over $200,000Two or more races householders
- $83,309Hispanic or Latino race householders
- Median 2022 house value
- $213,447White Non-Hispanic householders
- $122,542Black or African American householders
- $306,357American Indian or Alaska Native householders
- $144,823Asian householders
- $189,384Some other race householders
- $167,103Two or more races householders
- $197,850Hispanic or Latino householders
Household income for White non-Hispanic householders

Household income for Black householders

Household income for Asian householders

Household income for Some other race householders

Household income for Two or more races householders

Household income for Hispanic or Latino race householders

Median age by race in St. Francis
- 55.2Median age for White residents
- 54.0Males
- 56.3Females
- 53.7Median age for Black or African American residents
- 50.7Males
- 58.6Females
- -699,907,663.2Median age for American Indian / Alaska Native residents
- -833,824,974.6Males
- -627,763,040.9Females
- 68.7Median age for Asian residents
- 68.7Males
- 68.6Females
- -825,688,072.6Median age for Native Hawaiian / Pacific Islander residents
- -862,745,097.2Males
- -732,444,443.7Females
- 34.7Median age for Other race residents
- 33.4Males
- 35.8Females
- 37.2Median age for Two or more races residents
- 34.3Males
- 59.4Females
- 55.1Median age for White alone residents
- 54.0Males
- 56.1Females
- 33.1Median age for Hispanic or Latino residents
- 26.7Males
- 35.4Females
Owner/renter occupied households by race in St. Francis
- House owners and renters - White residents
- 2,09253.7%Owner occupied
- 1,80346.3%Renter occupied
- House owners and renters - Black or African American residents
- 4917.9%Owner occupied
- 22682.1%Renter occupied
- House owners and renters - Asian residents
- 6083.5%Owner occupied
- 1216.5%Renter occupied
- House owners and renters - Other race residents
- 4726.5%Owner occupied
- 13073.5%Renter occupied
- House owners and renters - Two or more races residents
- 19585.4%Owner occupied
- 3314.6%Renter occupied
- House owners and renters - White alone residents
- 2,08453.5%Owner occupied
- 1,81046.5%Renter occupied
- House owners and renters - Hispanic or Latino residents
- 20836.9%Owner occupied
- 35663.1%Renter occupied
Language usage in St. Francis
- English speakers - Total
- 89.4% of residents of St. Francis speak English at home.
- 5.1% of residents speak Spanish at home
- 35678.6%Speak English very well
- 9721.4%Speak English less than very well
- 5.1% of residents speak other language at home
- 25857.6%Speak English very well
- 19042.4%Speak English less than very well
- English speakers - Born in the United States
- 86.9% of residents of St. Francis speak English at home.
- 12.1% of residents speak Spanish at home
- 251100.0%Speak English very well
- 0.7% of residents speak other language at home
- 14100.0%Speak English very well
- English speakers - Native, born elsewhere
- 34.4% of residents of St. Francis speak English at home.
- 36.9% of residents speak Spanish at home
- 2555.6%Speak English very well
- 2044.4%Speak English less than very well
- 31.1% of residents speak other language at home
- 38100.0%Speak English very well
- English speakers - Foreign-born
- 18.6% of residents of St. Francis speak English at home.
- 17.9% of residents speak Spanish at home
- 1113.1%Speak English very well
- 7386.9%Speak English less than very well
- 64.1% of residents speak other language at home
- 10836.0%Speak English very well
- 19264.0%Speak English less than very well
White (Caucasian) - Speak only English
| Native: | 98.5% (6,614) |
| Foreign-born: | 7.0% (12) |
White (Caucasian) - Speak another language
| Native: | 2.4% (164) |
| Foreign-born: | 86.4% (144) |
Asian - Speak only English
| Native: | 96.3% (13) |
| Foreign-born: | 48.0% (61) |
Other race - Speak only English
| Native: | 76.6% (205) |
| Foreign-born: | 75.9% (9) |
Other race - Speak another language
| Native: | 35.3% (95) |
| Foreign-born: | 56.8% (7) |
Two or more races - Speak another language
| Native: | 38.9% (122) |
| Foreign-born: | 100.0% (31) |
White alone - Speak only English
| Native: | 97.7% (6,530) |
| Foreign-born: | 6.1% (12) |
White alone - Speak another language
| Native: | 2.3% (154) |
| Foreign-born: | 95.9% (195) |
Hispanic or Latino - Speak another language
| Native: | 41.8% (368) |
| Foreign-born: | 99.3% (81) |
Foreign-born residents in St. Francis
456 residents are foreign born (2.2% Asia, 1.3% Europe, 0.8% Latin America).
| This city: | 5.0% |
| Wisconsin: | 5.0% |


Marital status for residents in St. Francis
Marital status - White (Caucasian) population 15 years and over
- Males
- 41.4%Never married
- 40.3%Now married
- 2.1%Separated
- 4.1%Widowed
- 12.1%Divorced
- Females
- 22.8%Never married
- 37.8%Now married
- 2.9%Separated
- 17.4%Widowed
- 19.1%Divorced
Women who gave birth in the past 12 months
| Now married: | 0.0% (0) |
| Unmarried: | 100.0% (6) |
Women who did not give birth in the past 12 months
| Now married: | 41.8% (506) |
| Unmarried: | 58.2% (705) |
Marital status - Black or African American population 15 years and over
- Males
- 51.2%Never married
- 0.0%Now married
- 0.5%Separated
- 0.0%Widowed
- 48.3%Divorced
- Females
- 84.2%Never married
- 0.0%Now married
- 0.0%Separated
- 0.0%Widowed
- 15.8%Divorced
Women who did not give birth in the past 12 months
| Now married: | 0.0% (0) |
| Unmarried: | 100.0% (123) |
Marital status - Asian population 15 years and over
- Males
- 43.5%Never married
- 21.0%Now married
- 0.0%Separated
- 0.0%Widowed
- 35.5%Divorced
- Females
- 35.6%Never married
- 64.4%Now married
- 0.0%Separated
- 0.0%Widowed
- 0.0%Divorced
Women who did not give birth in the past 12 months
| Now married: | 0.0% (0) |
| Unmarried: | 100.0% (13) |
Marital status - Other race population 15 years and over
- Males
- 52.9%Never married
- 45.4%Now married
- 0.0%Separated
- 0.0%Widowed
- 1.7%Divorced
- Females
- 16.5%Never married
- 32.0%Now married
- 0.0%Separated
- 51.5%Widowed
- 0.0%Divorced
Women who did not give birth in the past 12 months
| Now married: | 57.8% (39) |
| Unmarried: | 42.2% (28) |
Marital status - Two or more races population 15 years and over
- Males
- 41.4%Never married
- 25.9%Now married
- 0.0%Separated
- 0.0%Widowed
- 32.8%Divorced
- Females
- 27.5%Never married
- 72.5%Now married
- 0.0%Separated
- 0.0%Widowed
- 0.0%Divorced
Women who did not give birth in the past 12 months
| Now married: | 24.1% (21) |
| Unmarried: | 75.9% (67) |
Marital status - White alone, not Hispanic / Latino population 15 years and over
- Males
- 40.5%Never married
- 40.7%Now married
- 2.2%Separated
- 4.2%Widowed
- 12.4%Divorced
- Females
- 22.7%Never married
- 37.5%Now married
- 2.7%Separated
- 18.3%Widowed
- 18.8%Divorced
Women who gave birth in the past 12 months
| Now married: | 0.0% (0) |
| Unmarried: | 100.0% (6) |
Women who did not give birth in the past 12 months
| Now married: | 41.2% (480) |
| Unmarried: | 58.8% (687) |
Marital status - Hispanic or Latino population 15 years and over
- Males
- 49.3%Never married
- 43.1%Now married
- 0.0%Separated
- 0.0%Widowed
- 7.6%Divorced
- Females
- 21.4%Never married
- 44.9%Now married
- 1.7%Separated
- 25.3%Widowed
- 6.8%Divorced
Women who did not give birth in the past 12 months
| Now married: | 47.5% (138) |
| Unmarried: | 52.5% (153) |
Ancestries in St. Francis

- 84321.3%German
- 63015.9%Polish
- 2355.9%American
- 2205.6%Irish
- 1343.4%Palestinian
- 962.4%French
- 892.2%Italian
- 691.7%Norwegian
- 671.7%Albanian
- 651.6%European
- 501.3%English
- 481.2%Finnish
- 451.1%Scotch-Irish
- 320.8%Ukrainian
- 270.7%Dutch
- 240.6%Scottish
- 220.6%Egyptian
- 190.5%Russian
- 170.4%Northern European
- 160.4%Swiss
- 130.3%Slovene
- 110.3%Scandinavian
- 90.2%Serbian
- 50.1%Danish

Geographical mobility in St. Francis

- Same house 1 year ago
- 6,02786.3%White (Caucasian)
- 25839.6%Black or African American
- 58100.0%American Indian / Alaska Native
- 9665.7%Asian
- 21561.0%Other race
- 25663.9%Two or more races
- 6,02586.2%White alone, not Hispanic / Latino
- 84072.2%Hispanic or Latino

-
- Moved within same county
- 72410.4%White / Caucasian
- 39260.3%Black or African American
- 16145.7%Other race
- 12431.0%Two or more races
- 76711.0%White alone, not Hispanic / Latino
- 23820.4%Hispanic or Latino

-
- Moved within same state
- 1101.6%White / Caucasian
- 1711.7%Asian
- 10.3%Other race
- 1091.6%White alone, not Hispanic / Latino
- 20.2%Hispanic or Latino

-
- Moved from different state
- 1141.6%White / Caucasian
- 92.3%Two or more races
- 761.1%White alone, not Hispanic / Latino
- 342.9%Hispanic or Latino

-
- Moved from abroad
- 2014.0%Asian

Children Nativity (place of birth) in St. Francis
Place of birth for residents in St. Francis
![Place of birth for the foreign-born population - Regions]()
- 204Asia
- 119Europe
- 108Eastern Europe
- 92Americas
- 77Latin America
- 77Central America
- 73Western Asia
- 62South Eastern Asia
- 42South Central Asia
- 38Africa
- 38Northern Africa
- 24Eastern Asia
- 14Northern America
- 10Southern Europe

![Place of birth for the foreign-born population - Countries]()
- 67Albania
- 55Mexico
- 48Laos
- 42India
- 39Lebanon
- 38Egypt
- 33Iraq
- 24Ukraine
- 24Korea
- 21Guatemala
- 15Serbia
- 14Canada
- 13Philippines
- 10Italy

Zip codes: 53235.