Races in Terrytown, Louisiana (LA) Detailed Stats
Data:
Races - White alone (%)
Races - White alone (% change since 2000)
Races - Black alone (%)
Races - Black alone (% change since 2000)
Races - American Indian alone (%)
Races - American Indian alone (% change since 2000)
Races - Asian alone (%)
Races - Asian alone (% change since 2000)
Races - Hispanic (%)
Races - Hispanic (% change since 2000)
Races - Native Hawaiian and Other Pacific Islander alone (%)
Races - Native Hawaiian and Other Pacific Islander alone (% change since 2000)
Races - Two or more races(%)
Races - Two or more races(% change since 2000)
Races - Other race alone (%)
Races - Other race alone (% change since 2000)
Racial diversity
Place of birth - Born in state of residence (%)
Place of birth - Born in state of residence (%) - White
Place of birth - Born in state of residence (%) - Black or African American
Place of birth - Born in state of residence (%) - Asian
Place of birth - Born in state of residence (%) - Hispanic or Latino
Place of birth - Born in state of residence (%) - American Indian and Alaska Native
Place of birth - Born in state of residence (%) - Multirace
Place of birth - Born in state of residence (%) - Other Race
Place of birth - Born in other state (%)
Place of birth - Born in other state (%) - White
Place of birth - Born in other state (%) - Black or African American
Place of birth - Born in other state (%) - Asian
Place of birth - Born in other state (%) - Hispanic or Latino
Place of birth - Born in other state (%) - American Indian and Alaska Native
Place of birth - Born in other state (%) - Multirace
Place of birth - Born in other state (%) - Other Race
Place of birth - Native, outside of US (%)
Place of birth - Native, outside of US (%) - White
Place of birth - Native, outside of US (%) - Black or African American
Place of birth - Native, outside of US (%) - Asian
Place of birth - Native, outside of US (%) - Hispanic or Latino
Place of birth - Native, outside of US (%) - American Indian and Alaska Native
Place of birth - Native, outside of US (%) - Multirace
Place of birth - Native, outside of US (%) - Other Race
Place of birth - Foreign born (%)
Place of birth - Foreign born (%) - White
Place of birth - Foreign born (%) - Black or African American
Place of birth - Foreign born (%) - Asian
Place of birth - Foreign born (%) - Hispanic or Latino
Place of birth - Foreign born (%) - American Indian and Alaska Native
Place of birth - Foreign born (%) - Multirace
Place of birth - Foreign born (%) - Other Race
Residents speaking English at home (%)
Residents speaking English at home - Born in the United States (%)
Residents speaking English at home - Native, born elsewhere (%)
Residents speaking English at home - Foreign born (%)
Residents speaking Spanish at home (%)
Residents speaking Spanish at home - Born in the United States (%)
Residents speaking Spanish at home - Native, born elsewhere (%)
Residents speaking Spanish at home - Foreign born (%)
Residents speaking other language at home (%)
Residents speaking other language at home - Born in the United States (%)
Residents speaking other language at home - Native, born elsewhere (%)
Residents speaking other language at home - Foreign born (%)
Marital status - Never married (%)
Marital status - Now married (%)
Marital status - Separated (%)
Marital status - Widowed (%)
Marital status - Divorced (%)
Ancestries Reported - Arab (%)
Ancestries Reported - Czech (%)
Ancestries Reported - Danish (%)
Ancestries Reported - Dutch (%)
Ancestries Reported - English (%)
Ancestries Reported - French (%)
Ancestries Reported - French Canadian (%)
Ancestries Reported - German (%)
Ancestries Reported - Greek (%)
Ancestries Reported - Hungarian (%)
Ancestries Reported - Irish (%)
Ancestries Reported - Italian (%)
Ancestries Reported - Lithuanian (%)
Ancestries Reported - Norwegian (%)
Ancestries Reported - Polish (%)
Ancestries Reported - Portuguese (%)
Ancestries Reported - Russian (%)
Ancestries Reported - Scotch-Irish (%)
Ancestries Reported - Scottish (%)
Ancestries Reported - Slovak (%)
Ancestries Reported - Subsaharan African (%)
Ancestries Reported - Swedish (%)
Ancestries Reported - Swiss (%)
Ancestries Reported - Ukrainian (%)
Ancestries Reported - United States (%)
Ancestries Reported - Welsh (%)
Ancestries Reported - West Indian (%)
Ancestries Reported - Other (%)
Geographical mobility - Same house 1 year ago (%)
Geographical mobility - Same house 1 year ago (%) - White
Geographical mobility - Same house 1 year ago (%) - Black or African American
Geographical mobility - Same house 1 year ago (%) - Asian
Geographical mobility - Same house 1 year ago (%) - Hispanic or Latino
Geographical mobility - Same house 1 year ago (%) - American Indian and Alaska Native
Geographical mobility - Same house 1 year ago (%) - Multirace
Geographical mobility - Same house 1 year ago (%) - Other Race
Geographical mobility - Moved within same county (%)
Geographical mobility - Moved within same county (%) - White
Geographical mobility - Moved within same county (%) - Black or African American
Geographical mobility - Moved within same county (%) - Asian
Geographical mobility - Moved within same county (%) - Hispanic or Latino
Geographical mobility - Moved within same county (%) - American Indian and Alaska Native
Geographical mobility - Moved within same county (%) - Multirace
Geographical mobility - Moved within same county (%) - Other Race
Geographical mobility - Moved from different county within same state (%)
Geographical mobility - Moved from different county within same state (%) - White
Geographical mobility - Moved from different county within same state (%) - Black or African American
Geographical mobility - Moved from different county within same state (%) - Asian
Geographical mobility - Moved from different county within same state (%) - Hispanic or Latino
Geographical mobility - Moved from different county within same state (%) - American Indian and Alaska Native
Geographical mobility - Moved from different county within same state (%) - Multirace
Geographical mobility - Moved from different county within same state (%) - Other Race
Geographical mobility - Moved from different state (%)
Geographical mobility - Moved from different state (%) - White
Geographical mobility - Moved from different state (%) - Black or African American
Geographical mobility - Moved from different state (%) - Asian
Geographical mobility - Moved from different state (%) - Hispanic or Latino
Geographical mobility - Moved from different state (%) - American Indian and Alaska Native
Geographical mobility - Moved from different state (%) - Multirace
Geographical mobility - Moved from different state (%) - Other Race
Geographical mobility - Moved from abroad (%)
Geographical mobility - Moved from abroad (%) - White
Geographical mobility - Moved from abroad (%) - Black or African American
Geographical mobility - Moved from abroad (%) - Asian
Geographical mobility - Moved from abroad (%) - Hispanic or Latino
Geographical mobility - Moved from abroad (%) - American Indian and Alaska Native
Geographical mobility - Moved from abroad (%) - Multirace
Geographical mobility - Moved from abroad (%) - Other Race
Place of birth for the foreign-born population - Ireland (%)
Place of birth for the foreign-born population - Denmark (%)
Place of birth for the foreign-born population - Norway (%)
Place of birth for the foreign-born population - Sweden (%)
Place of birth for the foreign-born population - United Kingdom (%)
Place of birth for the foreign-born population - England (%)
Place of birth for the foreign-born population - Scotland (%)
Place of birth for the foreign-born population - Other Northern Europe (%)
Place of birth for the foreign-born population - Austria (%)
Place of birth for the foreign-born population - Belgium (%)
Place of birth for the foreign-born population - France (%)
Place of birth for the foreign-born population - Germany (%)
Place of birth for the foreign-born population - Netherlands (%)
Place of birth for the foreign-born population - Switzerland (%)
Place of birth for the foreign-born population - Other Western Europe (%)
Place of birth for the foreign-born population - Greece (%)
Place of birth for the foreign-born population - Italy (%)
Place of birth for the foreign-born population - Portugal (%)
Place of birth for the foreign-born population - Spain (%)
Place of birth for the foreign-born population - Other Southern Europe (%)
Place of birth for the foreign-born population - Albania (%)
Place of birth for the foreign-born population - Belarus (%)
Place of birth for the foreign-born population - Bosnia and Herzegovina (%)
Place of birth for the foreign-born population - Bulgaria (%)
Place of birth for the foreign-born population - Croatia (%)
Place of birth for the foreign-born population - Czechoslovakia (%)
Place of birth for the foreign-born population - Hungary (%)
Place of birth for the foreign-born population - Latvia (%)
Place of birth for the foreign-born population - Lithuania (%)
Place of birth for the foreign-born population - North Macedonia (Macedonia) (%)
Place of birth for the foreign-born population - Moldova (%)
Place of birth for the foreign-born population - Poland (%)
Place of birth for the foreign-born population - Romania (%)
Place of birth for the foreign-born population - Russia (%)
Place of birth for the foreign-born population - Serbia (%)
Place of birth for the foreign-born population - Ukraine (%)
Place of birth for the foreign-born population - Other Eastern Europe (%)
Place of birth for the foreign-born population - China (%)
Place of birth for the foreign-born population - Hong Kong (%)
Place of birth for the foreign-born population - Taiwan (%)
Place of birth for the foreign-born population - Japan (%)
Place of birth for the foreign-born population - Korea (%)
Place of birth for the foreign-born population - Other Eastern Asia (%)
Place of birth for the foreign-born population - Afghanistan (%)
Place of birth for the foreign-born population - Bangladesh (%)
Place of birth for the foreign-born population - India (%)
Place of birth for the foreign-born population - Iran (%)
Place of birth for the foreign-born population - Kazakhstan (%)
Place of birth for the foreign-born population - Nepal (%)
Place of birth for the foreign-born population - Pakistan (%)
Place of birth for the foreign-born population - Sri Lanka (%)
Place of birth for the foreign-born population - Uzbekistan (%)
Place of birth for the foreign-born population - Other South Central Asia (%)
Place of birth for the foreign-born population - Burma (%)
Place of birth for the foreign-born population - Cambodia (%)
Place of birth for the foreign-born population - Indonesia (%)
Place of birth for the foreign-born population - Laos (%)
Place of birth for the foreign-born population - Malaysia (%)
Place of birth for the foreign-born population - Philippines (%)
Place of birth for the foreign-born population - Singapore (%)
Place of birth for the foreign-born population - Thailand (%)
Place of birth for the foreign-born population - Vietnam (%)
Place of birth for the foreign-born population - Other South Eastern Asia (%)
Place of birth for the foreign-born population - Armenia (%)
Place of birth for the foreign-born population - Iraq (%)
Place of birth for the foreign-born population - Israel (%)
Place of birth for the foreign-born population - Jordan (%)
Place of birth for the foreign-born population - Kuwait (%)
Place of birth for the foreign-born population - Lebanon (%)
Place of birth for the foreign-born population - Saudi Arabia (%)
Place of birth for the foreign-born population - Syria (%)
Place of birth for the foreign-born population - Turkey (%)
Place of birth for the foreign-born population - Yemen (%)
Place of birth for the foreign-born population - Other Western Asia (%)
Place of birth for the foreign-born population - Eritrea (%)
Place of birth for the foreign-born population - Ethiopia (%)
Place of birth for the foreign-born population - Kenya (%)
Place of birth for the foreign-born population - Somalia (%)
Place of birth for the foreign-born population - Uganda (%)
Place of birth for the foreign-born population - Zimbabwe (%)
Place of birth for the foreign-born population - Other Eastern Africa (%)
Place of birth for the foreign-born population - Cameroon (%)
Place of birth for the foreign-born population - Congo (%)
Place of birth for the foreign-born population - Democratic Republic of Congo (Zaire) (%)
Place of birth for the foreign-born population - Other Middle Africa (%)
Place of birth for the foreign-born population - Egypt (%)
Place of birth for the foreign-born population - Morocco (%)
Place of birth for the foreign-born population - Sudan (%)
Place of birth for the foreign-born population - Other Northern Africa (%)
Place of birth for the foreign-born population - South Africa (%)
Place of birth for the foreign-born population - Other Southern Africa (%)
Place of birth for the foreign-born population - Cabo Verde (%)
Place of birth for the foreign-born population - Ghana (%)
Place of birth for the foreign-born population - Liberia (%)
Place of birth for the foreign-born population - Nigeria (%)
Place of birth for the foreign-born population - Senegal (%)
Place of birth for the foreign-born population - Sierra Leone (%)
Place of birth for the foreign-born population - Other Western Africa (%)
Place of birth for the foreign-born population - Australia (%)
Place of birth for the foreign-born population - New Zealand (%)
Place of birth for the foreign-born population - Fiji (%)
Place of birth for the foreign-born population - Micronesia (%)
Place of birth for the foreign-born population - Bahamas (%)
Place of birth for the foreign-born population - Barbados (%)
Place of birth for the foreign-born population - Cuba (%)
Place of birth for the foreign-born population - Dominica (%)
Place of birth for the foreign-born population - Dominican Republic (%)
Place of birth for the foreign-born population - Grenada (%)
Place of birth for the foreign-born population - Haiti (%)
Place of birth for the foreign-born population - Jamaica (%)
Place of birth for the foreign-born population - St. Vincent and the Grenadines (%)
Place of birth for the foreign-born population - Trinidad and Tobago (%)
Place of birth for the foreign-born population - West Indies (%)
Place of birth for the foreign-born population - Other Caribbean (%)
Place of birth for the foreign-born population - Belize (%)
Place of birth for the foreign-born population - Costa Rica (%)
Place of birth for the foreign-born population - El Salvador (%)
Place of birth for the foreign-born population - Guatemala (%)
Place of birth for the foreign-born population - Honduras (%)
Place of birth for the foreign-born population - Mexico (%)
Place of birth for the foreign-born population - Nicaragua (%)
Place of birth for the foreign-born population - Panama (%)
Place of birth for the foreign-born population - Other Central America (%)
Place of birth for the foreign-born population - Argentina (%)
Place of birth for the foreign-born population - Bolivia (%)
Place of birth for the foreign-born population - Brazil (%)
Place of birth for the foreign-born population - Chile (%)
Place of birth for the foreign-born population - Colombia (%)
Place of birth for the foreign-born population - Ecuador (%)
Place of birth for the foreign-born population - Guyana (%)
Place of birth for the foreign-born population - Peru (%)
Place of birth for the foreign-born population - Uruguay (%)
Place of birth for the foreign-born population - Venezuela (%)
Place of birth for the foreign-born population - Other South America (%)
Place of birth for the foreign-born population - Canada (%)
Place of birth for the foreign-born population - Other Northern America (%)
Place of birth for the foreign-born population - Other (%)
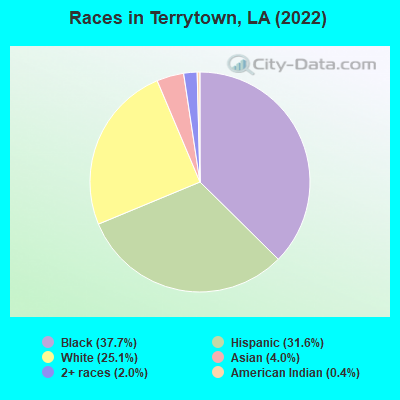
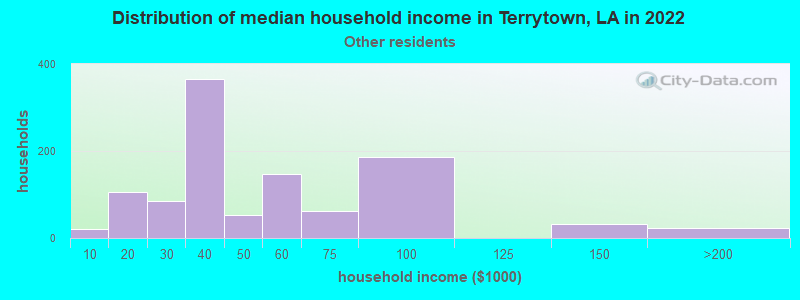
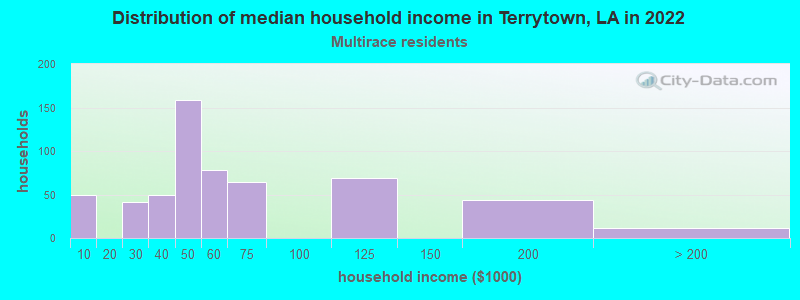
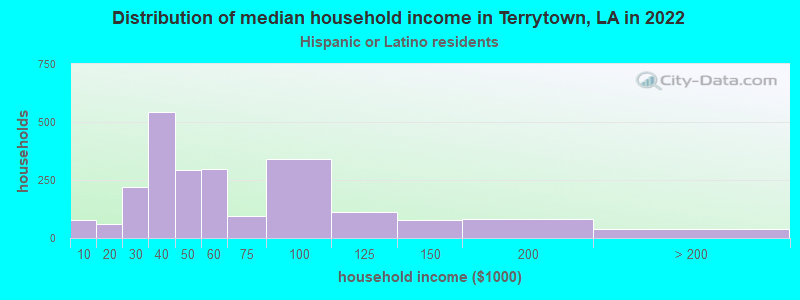
According to 2022 data, the most numerous races in Terrytown, LA are White alone (6,399 residents), Black alone (9,613 residents), and Hispanic (8,045 residents). 68.3% of Terrytown residents speak English at home. 23.3% of Terrytown, LA residents are foreign-born (18.8% born in Latin America, 3.2% born in Asia), which is 82.8% greater than the foreign-born rate of 4.0% across the entire state of Louisiana.
Race distribution in Terrytown
2000 2022
2,794,391 62.5% White alone 1,443,390 32.3% Black alone 107,738 2.4% Hispanic 54,256 1.2% Asian alone 39,260 0.9% Two or more races 24,129 0.5% American Indian alone 4,736 0.1% Other race alone 1,076 0.02% Native Hawaiian and Other
2,603,221 56.7% White alone 1,420,055 30.9% Black alone 262,213 5.7% Hispanic 183,270 4.0% Two or more races 81,169 1.8% Asian alone 19,991 0.4% American Indian alone 18,043 0.4% Other race alone 2,279 0.05% Native Hawaiian and Other
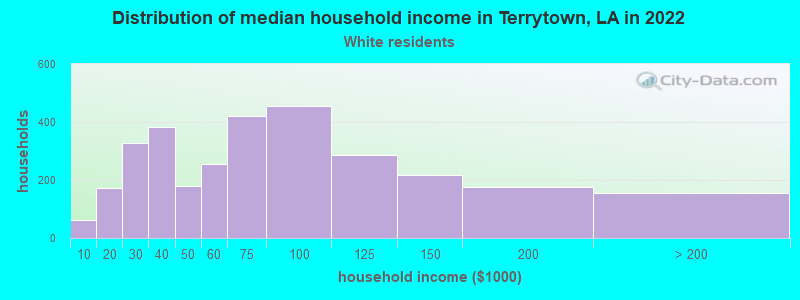
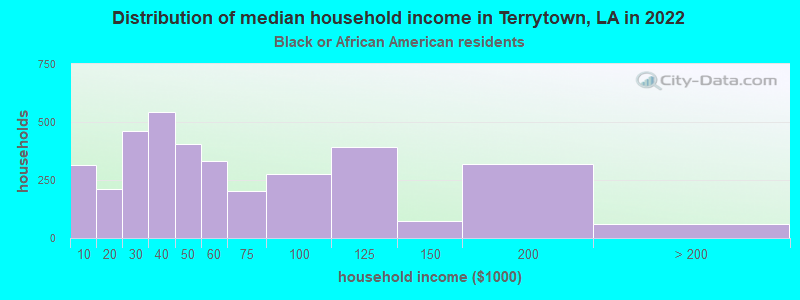
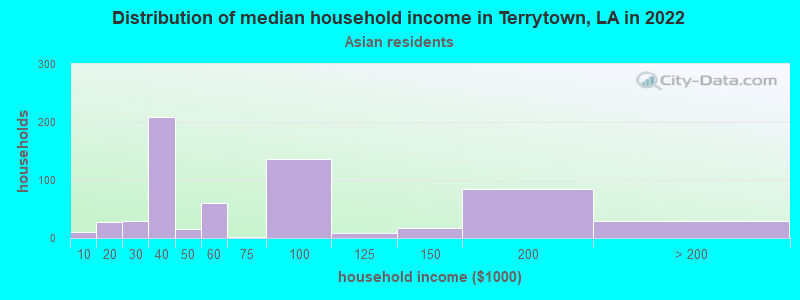
Income and house value in Terrytown Median household income in 2022 $65,729 White non-Hispanic householders$45,745 Black householders$74,876 Asian householders$43,753 Some other race householders$50,659 Two or more races householders$53,524 Hispanic or Latino race householdersMedian 2022 house value $227,746 White Non-Hispanic householders$226,526 Black or African American householders$183,076 American Indian or Alaska Native householders $216,030 Asian householders$231,896 Some other race householders$335,639 Two or more races householders$243,369 Hispanic or Latino householders
Median age by race in Terrytown
49.2 Median age for White residents42.3 52.6 33.3 Median age for Black or African American residents32.9 33.2 11.8 Median age for American Indian / Alaska Native residents8.9 -1,174,917,490.6 33.9 Median age for Asian residents47.2 24.8 -1,031,509,120.0 Median age for Native Hawaiian / Pacific Islander residents-868,167,201.7 -599,999,999.4 28.9 Median age for Other race residents26.5 30.3 24.8 Median age for Two or more races residents25.3 13.5 50.5 Median age for White alone residents44.1 54.9 27.6 Median age for Hispanic or Latino residents29.5 23.4
Owner/renter occupied households by race in Terrytown
House owners and renters - White residents 2,131 67.2% Owner occupied1,039 32.8% Renter occupiedHouse owners and renters - Black or African American residents 1,110 31.3% Owner occupied2,440 68.7% Renter occupiedHouse owners and renters - American Indian / Alaska Native residents 29 100.0% Owner occupiedHouse owners and renters - Asian residents 448 82.6% Owner occupied94 17.4% Renter occupiedHouse owners and renters - Other race residents 210 19.1% Owner occupied888 80.9% Renter occupiedHouse owners and renters - Two or more races residents 291 49.4% Owner occupied298 50.6% Renter occupiedHouse owners and renters - White alone residents 2,050 73.5% Owner occupied737 26.5% Renter occupiedHouse owners and renters - Hispanic or Latino residents 505 25.6% Owner occupied1,469 74.4% Renter occupied
Language usage in Terrytown
English speakers - Total 68.3% of residents of Terrytown speak English at home.
22.8% of residents speak Spanish at home 2,577 49.8% Speak English very well2,600 50.2% Speak English less than very well7.2% of residents speak other language at home 974 59.6% Speak English very well660 40.4% Speak English less than very well
English speakers - Born in the United States 77.9% of residents of Terrytown speak English at home.
17.8% of residents speak Spanish at home 372 75.5% Speak English very well121 24.5% Speak English less than very well2.4% of residents speak other language at home 66 100.0% Speak English very well
English speakers - Native, born elsewhere 24.1% of residents of Terrytown speak English at home.
32.4% of residents speak Spanish at home 82 78.1% Speak English very well23 21.9% Speak English less than very well1.9% of residents speak other language at home 6 100.0% Speak English very well
English speakers - Foreign-born 4.1% of residents of Terrytown speak English at home.
71.4% of residents speak Spanish at home 1,155 32.8% Speak English very well2,363 67.2% Speak English less than very well23.4% of residents speak other language at home 545 47.3% Speak English very well608 52.7% Speak English less than very well
White (Caucasian) - Speak only English Native:
92.9% (5,898)Foreign-born:
11.0% (74)
White (Caucasian) - Speak another language Native:
6.3% (400)Foreign-born:
81.7% (544)
Black or African American - Speak only English Native:
95.4% (8,430)Foreign-born:
13.8% (51)
Black or African American - Speak another language Native:
5.0% (444)Foreign-born:
86.5% (317)
Asian - Speak only English Native:
24.1% (50)Foreign-born:
4.9% (32)
Asian - Speak another language Native:
81.6% (170)Foreign-born:
95.4% (628)
Other race - Speak only English Native:
29.5% (279)Foreign-born:
3.4% (101)
Other race - Speak another language Native:
60.3% (573)Foreign-born:
91.7% (2,765)
Two or more races - Speak another language Native:
53.3% (581)Foreign-born:
100.0% (1,161)
White alone - Speak only English Native:
97.0% (5,796)Foreign-born:
10.6% (17)
White alone - Speak another language Native:
3.0% (179)Foreign-born:
93.8% (152)
Hispanic or Latino - Speak only English Native:
32.4% (886)Foreign-born:
4.4% (163)
Hispanic or Latino - Speak another language Native:
59.4% (1,627)Foreign-born:
94.2% (3,524)
Foreign-born residents in Terrytown 5,935 residents are foreign born (18.8% Latin America , 3.2% Asia ).
This city:
23.3%Louisiana:
4.2%
Marital status for residents in Terrytown Marital status - White (Caucasian) population 15 years and over
Males 32.9% Never married49.6% Now married0.3% Separated4.2% Widowed13.0% DivorcedFemales 20.8% Never married47.6% Now married1.9% Separated10.7% Widowed18.9% DivorcedWomen who gave birth in the past 12 months Now married:
73.9% (98)Unmarried:
26.1% (35)
Women who did not give birth in the past 12 months Now married:
52.9% (618)Unmarried:
47.1% (551)
Marital status - Black or African American population 15 years and over
Males 54.7% Never married30.6% Now married2.7% Separated0.9% Widowed11.2% DivorcedFemales 54.7% Never married24.0% Now married1.5% Separated4.9% Widowed14.9% DivorcedWomen who gave birth in the past 12 months Now married:
33.4% (149)Unmarried:
66.6% (297)
Women who did not give birth in the past 12 months Now married:
13.8% (353)Unmarried:
86.2% (2,206)
Marital status - Asian population 15 years and over
Males 29.3% Never married59.1% Now married0.0% Separated0.0% Widowed11.6% DivorcedFemales 27.8% Never married67.9% Now married0.0% Separated0.9% Widowed3.4% DivorcedWomen who gave birth in the past 12 months Now married:
100.0% (20)Unmarried:
0.0% (0)
Women who did not give birth in the past 12 months Now married:
61.1% (173)Unmarried:
38.9% (110)
Marital status - Other race population 15 years and over
Males 42.4% Never married52.0% Now married1.5% Separated0.0% Widowed4.1% DivorcedFemales 43.0% Never married46.9% Now married1.2% Separated0.9% Widowed8.0% DivorcedWomen who gave birth in the past 12 months Now married:
100.0% (168)Unmarried:
0.0% (0)
Women who did not give birth in the past 12 months Now married:
32.5% (311)Unmarried:
67.5% (647)
Marital status - Two or more races population 15 years and over
Males 25.2% Never married39.8% Now married18.7% Separated4.6% Widowed11.6% DivorcedFemales 42.8% Never married51.2% Now married0.0% Separated0.0% Widowed6.0% DivorcedWomen who gave birth in the past 12 months Now married:
0.0% (0)Unmarried:
100.0% (104)
Women who did not give birth in the past 12 months Now married:
60.9% (288)Unmarried:
39.1% (185)
Marital status - White alone, not Hispanic / Latino population 15 years and over
Males 32.7% Never married49.2% Now married0.4% Separated4.7% Widowed13.1% DivorcedFemales 20.5% Never married47.4% Now married2.0% Separated11.6% Widowed18.5% DivorcedWomen who did not give birth in the past 12 months Now married:
53.9% (608)Unmarried:
46.1% (520)
Marital status - Hispanic or Latino population 15 years and over
Males 38.4% Never married48.3% Now married4.7% Separated1.3% Widowed7.4% DivorcedFemales 42.0% Never married44.3% Now married0.8% Separated3.5% Widowed9.4% DivorcedWomen who gave birth in the past 12 months Now married:
63.6% (246)Unmarried:
36.4% (140)
Women who did not give birth in the past 12 months Now married:
35.4% (494)Unmarried:
64.6% (900)
Ancestries in Terrytown
1,050 6.2% American504 3.0% French474 2.8% Haitian363 2.1% Irish361 2.1% European216 1.3% English188 1.1% German164 1.0% Italian149 0.9% Palestinian136 0.8% African107 0.6% Jordanian98 0.6% French Canadian55 0.3% Scotch-Irish32 0.2% Belizean27 0.2% Arab22 0.1% Scottish19 0.1% Swedish17 0.1% Belgian17 0.1% Croatian13 0.08% British12 0.07% Yugoslavian11 0.06% Russian10 0.06% Canadian5 0.03% Slovak4 0.02% Cajun2 0.01% Dutch
Geographical mobility in Terrytown Same house 1 year ago 6,808 92.4% White (Caucasian)9,633 95.2% Black or African American131 99.4% American Indian / Alaska Native883 85.0% Asian3,683 81.7% Other race2,022 75.1% Two or more races6,023 94.1% White alone, not Hispanic / Latino6,402 82.1% Hispanic or LatinoMoved within same county 346 4.7% White / Caucasian461 4.6% Black or African American139 13.4% Asian469 10.4% Other race575 21.3% Two or more races154 2.4% White alone, not Hispanic / Latino1,108 14.2% Hispanic or LatinoMoved within same state 173 2.4% White / Caucasian102 1.0% Black or African American17 1.7% Asian16 0.4% Other race97 3.6% Two or more races185 2.9% White alone, not Hispanic / Latino76 1.0% Hispanic or LatinoMoved from different state 47 0.6% White / Caucasian14 0.1% Black or African American49 0.8% White alone, not Hispanic / LatinoMoved from abroad 39 0.5% White22 0.5% Other race132 1.7% Hispanic or Latino
Children Nativity (place of birth) in Terrytown
Children under 6 years - Living with two parents Both parents native 1,110 100.0% NativeBoth parents foreign-born 154 60.8% Native99 39.2% Foreign-bornOne native, one foreign-born parent 293 100.0% NativeChildren under 6 years - Living with one parent Native parent 626 100.0% NativeForeign-born parent 633 84.8% Native113 15.2% Foreign-bornChildren 6 to 17 years - Living with two parents Both parents native 1,295 100.0% NativeBoth parents foreign-born 227 76.7% Native69 23.3% Foreign-bornOne native, one foreign-born parent 254 92.9% Native19 7.1% Foreign-bornChildren 6 to 17 years - Living with one parent Native parent 950 100.0% NativeForeign-born parent 802 62.4% Native484 37.6% Foreign-born
Grandparents responsible for own grandchildren in Terrytown
Grandparents (30 to 59 years) White / Caucasian 339 86.7% Responsible for grandchildren52 13.3% Not responsible for grandchildrenBlack or African American 28 19.7% Responsible for grandchildren113 80.3% Not responsible for grandchildrenOther race 46 100.0% Not responsible for grandchildrenWhite alone, not Hispanic / Latino 100 58.0% Responsible for grandchildren72 42.0% Not responsible for grandchildrenHispanic or Latino 185 69.1% Responsible for grandchildren83 30.9% Not responsible for grandchildren
Grandparents (60 years and over) White / Caucasian 41 96.6% Responsible for grandchildren1 3.4% Not responsible for grandchildrenBlack or African American 355 100.0% Not responsible for grandchildrenOther race 292 100.0% Not responsible for grandchildrenWhite alone, not Hispanic / Latino 44 96.4% Responsible for grandchildren2 3.6% Not responsible for grandchildrenHispanic or Latino 294 100.0% Not responsible for grandchildren