Races in Villa Park, Illinois (IL) Detailed Stats
Data:
Races - White alone (%)
Races - White alone (% change since 2000)
Races - Black alone (%)
Races - Black alone (% change since 2000)
Races - American Indian alone (%)
Races - American Indian alone (% change since 2000)
Races - Asian alone (%)
Races - Asian alone (% change since 2000)
Races - Hispanic (%)
Races - Hispanic (% change since 2000)
Races - Native Hawaiian and Other Pacific Islander alone (%)
Races - Native Hawaiian and Other Pacific Islander alone (% change since 2000)
Races - Two or more races(%)
Races - Two or more races(% change since 2000)
Races - Other race alone (%)
Races - Other race alone (% change since 2000)
Racial diversity
Place of birth - Born in state of residence (%)
Place of birth - Born in state of residence (%) - White
Place of birth - Born in state of residence (%) - Black or African American
Place of birth - Born in state of residence (%) - Asian
Place of birth - Born in state of residence (%) - Hispanic or Latino
Place of birth - Born in state of residence (%) - American Indian and Alaska Native
Place of birth - Born in state of residence (%) - Multirace
Place of birth - Born in state of residence (%) - Other Race
Place of birth - Born in other state (%)
Place of birth - Born in other state (%) - White
Place of birth - Born in other state (%) - Black or African American
Place of birth - Born in other state (%) - Asian
Place of birth - Born in other state (%) - Hispanic or Latino
Place of birth - Born in other state (%) - American Indian and Alaska Native
Place of birth - Born in other state (%) - Multirace
Place of birth - Born in other state (%) - Other Race
Place of birth - Native, outside of US (%)
Place of birth - Native, outside of US (%) - White
Place of birth - Native, outside of US (%) - Black or African American
Place of birth - Native, outside of US (%) - Asian
Place of birth - Native, outside of US (%) - Hispanic or Latino
Place of birth - Native, outside of US (%) - American Indian and Alaska Native
Place of birth - Native, outside of US (%) - Multirace
Place of birth - Native, outside of US (%) - Other Race
Place of birth - Foreign born (%)
Place of birth - Foreign born (%) - White
Place of birth - Foreign born (%) - Black or African American
Place of birth - Foreign born (%) - Asian
Place of birth - Foreign born (%) - Hispanic or Latino
Place of birth - Foreign born (%) - American Indian and Alaska Native
Place of birth - Foreign born (%) - Multirace
Place of birth - Foreign born (%) - Other Race
Residents speaking English at home (%)
Residents speaking English at home - Born in the United States (%)
Residents speaking English at home - Native, born elsewhere (%)
Residents speaking English at home - Foreign born (%)
Residents speaking Spanish at home (%)
Residents speaking Spanish at home - Born in the United States (%)
Residents speaking Spanish at home - Native, born elsewhere (%)
Residents speaking Spanish at home - Foreign born (%)
Residents speaking other language at home (%)
Residents speaking other language at home - Born in the United States (%)
Residents speaking other language at home - Native, born elsewhere (%)
Residents speaking other language at home - Foreign born (%)
Marital status - Never married (%)
Marital status - Now married (%)
Marital status - Separated (%)
Marital status - Widowed (%)
Marital status - Divorced (%)
Ancestries Reported - Arab (%)
Ancestries Reported - Czech (%)
Ancestries Reported - Danish (%)
Ancestries Reported - Dutch (%)
Ancestries Reported - English (%)
Ancestries Reported - French (%)
Ancestries Reported - French Canadian (%)
Ancestries Reported - German (%)
Ancestries Reported - Greek (%)
Ancestries Reported - Hungarian (%)
Ancestries Reported - Irish (%)
Ancestries Reported - Italian (%)
Ancestries Reported - Lithuanian (%)
Ancestries Reported - Norwegian (%)
Ancestries Reported - Polish (%)
Ancestries Reported - Portuguese (%)
Ancestries Reported - Russian (%)
Ancestries Reported - Scotch-Irish (%)
Ancestries Reported - Scottish (%)
Ancestries Reported - Slovak (%)
Ancestries Reported - Subsaharan African (%)
Ancestries Reported - Swedish (%)
Ancestries Reported - Swiss (%)
Ancestries Reported - Ukrainian (%)
Ancestries Reported - United States (%)
Ancestries Reported - Welsh (%)
Ancestries Reported - West Indian (%)
Ancestries Reported - Other (%)
Geographical mobility - Same house 1 year ago (%)
Geographical mobility - Same house 1 year ago (%) - White
Geographical mobility - Same house 1 year ago (%) - Black or African American
Geographical mobility - Same house 1 year ago (%) - Asian
Geographical mobility - Same house 1 year ago (%) - Hispanic or Latino
Geographical mobility - Same house 1 year ago (%) - American Indian and Alaska Native
Geographical mobility - Same house 1 year ago (%) - Multirace
Geographical mobility - Same house 1 year ago (%) - Other Race
Geographical mobility - Moved within same county (%)
Geographical mobility - Moved within same county (%) - White
Geographical mobility - Moved within same county (%) - Black or African American
Geographical mobility - Moved within same county (%) - Asian
Geographical mobility - Moved within same county (%) - Hispanic or Latino
Geographical mobility - Moved within same county (%) - American Indian and Alaska Native
Geographical mobility - Moved within same county (%) - Multirace
Geographical mobility - Moved within same county (%) - Other Race
Geographical mobility - Moved from different county within same state (%)
Geographical mobility - Moved from different county within same state (%) - White
Geographical mobility - Moved from different county within same state (%) - Black or African American
Geographical mobility - Moved from different county within same state (%) - Asian
Geographical mobility - Moved from different county within same state (%) - Hispanic or Latino
Geographical mobility - Moved from different county within same state (%) - American Indian and Alaska Native
Geographical mobility - Moved from different county within same state (%) - Multirace
Geographical mobility - Moved from different county within same state (%) - Other Race
Geographical mobility - Moved from different state (%)
Geographical mobility - Moved from different state (%) - White
Geographical mobility - Moved from different state (%) - Black or African American
Geographical mobility - Moved from different state (%) - Asian
Geographical mobility - Moved from different state (%) - Hispanic or Latino
Geographical mobility - Moved from different state (%) - American Indian and Alaska Native
Geographical mobility - Moved from different state (%) - Multirace
Geographical mobility - Moved from different state (%) - Other Race
Geographical mobility - Moved from abroad (%)
Geographical mobility - Moved from abroad (%) - White
Geographical mobility - Moved from abroad (%) - Black or African American
Geographical mobility - Moved from abroad (%) - Asian
Geographical mobility - Moved from abroad (%) - Hispanic or Latino
Geographical mobility - Moved from abroad (%) - American Indian and Alaska Native
Geographical mobility - Moved from abroad (%) - Multirace
Geographical mobility - Moved from abroad (%) - Other Race
Place of birth for the foreign-born population - Ireland (%)
Place of birth for the foreign-born population - Denmark (%)
Place of birth for the foreign-born population - Norway (%)
Place of birth for the foreign-born population - Sweden (%)
Place of birth for the foreign-born population - United Kingdom (%)
Place of birth for the foreign-born population - England (%)
Place of birth for the foreign-born population - Scotland (%)
Place of birth for the foreign-born population - Other Northern Europe (%)
Place of birth for the foreign-born population - Austria (%)
Place of birth for the foreign-born population - Belgium (%)
Place of birth for the foreign-born population - France (%)
Place of birth for the foreign-born population - Germany (%)
Place of birth for the foreign-born population - Netherlands (%)
Place of birth for the foreign-born population - Switzerland (%)
Place of birth for the foreign-born population - Other Western Europe (%)
Place of birth for the foreign-born population - Greece (%)
Place of birth for the foreign-born population - Italy (%)
Place of birth for the foreign-born population - Portugal (%)
Place of birth for the foreign-born population - Spain (%)
Place of birth for the foreign-born population - Other Southern Europe (%)
Place of birth for the foreign-born population - Albania (%)
Place of birth for the foreign-born population - Belarus (%)
Place of birth for the foreign-born population - Bosnia and Herzegovina (%)
Place of birth for the foreign-born population - Bulgaria (%)
Place of birth for the foreign-born population - Croatia (%)
Place of birth for the foreign-born population - Czechoslovakia (%)
Place of birth for the foreign-born population - Hungary (%)
Place of birth for the foreign-born population - Latvia (%)
Place of birth for the foreign-born population - Lithuania (%)
Place of birth for the foreign-born population - North Macedonia (Macedonia) (%)
Place of birth for the foreign-born population - Moldova (%)
Place of birth for the foreign-born population - Poland (%)
Place of birth for the foreign-born population - Romania (%)
Place of birth for the foreign-born population - Russia (%)
Place of birth for the foreign-born population - Serbia (%)
Place of birth for the foreign-born population - Ukraine (%)
Place of birth for the foreign-born population - Other Eastern Europe (%)
Place of birth for the foreign-born population - China (%)
Place of birth for the foreign-born population - Hong Kong (%)
Place of birth for the foreign-born population - Taiwan (%)
Place of birth for the foreign-born population - Japan (%)
Place of birth for the foreign-born population - Korea (%)
Place of birth for the foreign-born population - Other Eastern Asia (%)
Place of birth for the foreign-born population - Afghanistan (%)
Place of birth for the foreign-born population - Bangladesh (%)
Place of birth for the foreign-born population - India (%)
Place of birth for the foreign-born population - Iran (%)
Place of birth for the foreign-born population - Kazakhstan (%)
Place of birth for the foreign-born population - Nepal (%)
Place of birth for the foreign-born population - Pakistan (%)
Place of birth for the foreign-born population - Sri Lanka (%)
Place of birth for the foreign-born population - Uzbekistan (%)
Place of birth for the foreign-born population - Other South Central Asia (%)
Place of birth for the foreign-born population - Burma (%)
Place of birth for the foreign-born population - Cambodia (%)
Place of birth for the foreign-born population - Indonesia (%)
Place of birth for the foreign-born population - Laos (%)
Place of birth for the foreign-born population - Malaysia (%)
Place of birth for the foreign-born population - Philippines (%)
Place of birth for the foreign-born population - Singapore (%)
Place of birth for the foreign-born population - Thailand (%)
Place of birth for the foreign-born population - Vietnam (%)
Place of birth for the foreign-born population - Other South Eastern Asia (%)
Place of birth for the foreign-born population - Armenia (%)
Place of birth for the foreign-born population - Iraq (%)
Place of birth for the foreign-born population - Israel (%)
Place of birth for the foreign-born population - Jordan (%)
Place of birth for the foreign-born population - Kuwait (%)
Place of birth for the foreign-born population - Lebanon (%)
Place of birth for the foreign-born population - Saudi Arabia (%)
Place of birth for the foreign-born population - Syria (%)
Place of birth for the foreign-born population - Turkey (%)
Place of birth for the foreign-born population - Yemen (%)
Place of birth for the foreign-born population - Other Western Asia (%)
Place of birth for the foreign-born population - Eritrea (%)
Place of birth for the foreign-born population - Ethiopia (%)
Place of birth for the foreign-born population - Kenya (%)
Place of birth for the foreign-born population - Somalia (%)
Place of birth for the foreign-born population - Uganda (%)
Place of birth for the foreign-born population - Zimbabwe (%)
Place of birth for the foreign-born population - Other Eastern Africa (%)
Place of birth for the foreign-born population - Cameroon (%)
Place of birth for the foreign-born population - Congo (%)
Place of birth for the foreign-born population - Democratic Republic of Congo (Zaire) (%)
Place of birth for the foreign-born population - Other Middle Africa (%)
Place of birth for the foreign-born population - Egypt (%)
Place of birth for the foreign-born population - Morocco (%)
Place of birth for the foreign-born population - Sudan (%)
Place of birth for the foreign-born population - Other Northern Africa (%)
Place of birth for the foreign-born population - South Africa (%)
Place of birth for the foreign-born population - Other Southern Africa (%)
Place of birth for the foreign-born population - Cabo Verde (%)
Place of birth for the foreign-born population - Ghana (%)
Place of birth for the foreign-born population - Liberia (%)
Place of birth for the foreign-born population - Nigeria (%)
Place of birth for the foreign-born population - Senegal (%)
Place of birth for the foreign-born population - Sierra Leone (%)
Place of birth for the foreign-born population - Other Western Africa (%)
Place of birth for the foreign-born population - Australia (%)
Place of birth for the foreign-born population - New Zealand (%)
Place of birth for the foreign-born population - Fiji (%)
Place of birth for the foreign-born population - Micronesia (%)
Place of birth for the foreign-born population - Bahamas (%)
Place of birth for the foreign-born population - Barbados (%)
Place of birth for the foreign-born population - Cuba (%)
Place of birth for the foreign-born population - Dominica (%)
Place of birth for the foreign-born population - Dominican Republic (%)
Place of birth for the foreign-born population - Grenada (%)
Place of birth for the foreign-born population - Haiti (%)
Place of birth for the foreign-born population - Jamaica (%)
Place of birth for the foreign-born population - St. Vincent and the Grenadines (%)
Place of birth for the foreign-born population - Trinidad and Tobago (%)
Place of birth for the foreign-born population - West Indies (%)
Place of birth for the foreign-born population - Other Caribbean (%)
Place of birth for the foreign-born population - Belize (%)
Place of birth for the foreign-born population - Costa Rica (%)
Place of birth for the foreign-born population - El Salvador (%)
Place of birth for the foreign-born population - Guatemala (%)
Place of birth for the foreign-born population - Honduras (%)
Place of birth for the foreign-born population - Mexico (%)
Place of birth for the foreign-born population - Nicaragua (%)
Place of birth for the foreign-born population - Panama (%)
Place of birth for the foreign-born population - Other Central America (%)
Place of birth for the foreign-born population - Argentina (%)
Place of birth for the foreign-born population - Bolivia (%)
Place of birth for the foreign-born population - Brazil (%)
Place of birth for the foreign-born population - Chile (%)
Place of birth for the foreign-born population - Colombia (%)
Place of birth for the foreign-born population - Ecuador (%)
Place of birth for the foreign-born population - Guyana (%)
Place of birth for the foreign-born population - Peru (%)
Place of birth for the foreign-born population - Uruguay (%)
Place of birth for the foreign-born population - Venezuela (%)
Place of birth for the foreign-born population - Other South America (%)
Place of birth for the foreign-born population - Canada (%)
Place of birth for the foreign-born population - Other Northern America (%)
Place of birth for the foreign-born population - Other (%)
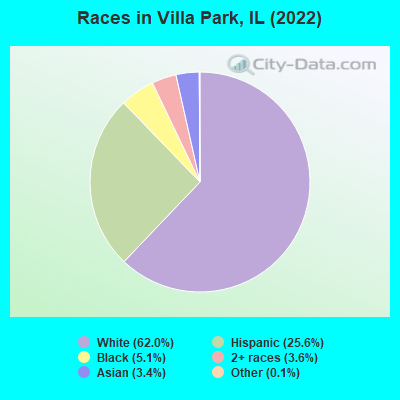
According to 2022 data, the most numerous races in Villa Park, IL are White alone (13,968 residents), Hispanic (5,771 residents), and Black alone (1,151 residents). 73.3% of Villa Park residents speak English at home. 16.2% of Villa Park, IL residents are foreign-born (8.9% born in Latin America, 3.9% born in Europe, 2.2% born in Asia), which is 13.8% greater than the foreign-born rate of 14.0% across the entire state of Illinois.
Race distribution in Villa Park
2000 2022
8,424,140 67.8% White alone 1,856,152 14.9% Black alone 1,530,262 12.3% Hispanic 419,916 3.4% Asian alone 153,996 1.2% Two or more races 13,479 0.1% Other race alone 18,232 0.1% American Indian alone 3,116 0.03% Native Hawaiian and Other
7,356,301 58.5% White alone 2,299,726 18.3% Hispanic 1,660,423 13.2% Black alone 747,296 5.9% Asian alone 458,599 3.6% Two or more races 45,386 0.4% Other race alone 10,405 0.08% American Indian alone 3,896 0.03% Native Hawaiian and Other
Income and house value in Villa Park Median household income in 2022 $93,323 White non-Hispanic householders$69,655 Black householders$125,955 American Indian and Alaska Native householders$100,549 Asian householders$63,891 Some other race householders$90,731 Two or more races householders$74,801 Hispanic or Latino race householdersMedian 2022 house value $296,185 White Non-Hispanic householders$296,943 Black or African American householders$260,726 American Indian or Alaska Native householders $296,374 Asian householders$311,544 Some other race householders$289,548 Two or more races householders$289,548 Hispanic or Latino householders
Median age by race in Villa Park
41.1 Median age for White residents41.2 41.1 26.3 Median age for Black or African American residents32.3 23.0 28.9 Median age for American Indian / Alaska Native residents36.5 19.5 34.3 Median age for Asian residents34.5 33.5 -593,236,714.4 Median age for Native Hawaiian / Pacific Islander residents-658,536,584.7 -576,015,108.0 36.6 Median age for Other race residents35.9 38.0 29.2 Median age for Two or more races residents34.0 22.6 42.4 Median age for White alone residents41.8 44.1 27.9 Median age for Hispanic or Latino residents33.5 22.2
Owner/renter occupied households by race in Villa Park
House owners and renters - White residents 4,978 79.2% Owner occupied1,304 20.8% Renter occupiedHouse owners and renters - Black or African American residents 132 38.9% Owner occupied206 61.1% Renter occupiedHouse owners and renters - American Indian / Alaska Native residents 41 71.9% Owner occupied16 28.1% Renter occupiedHouse owners and renters - Asian residents 146 57.8% Owner occupied106 42.2% Renter occupiedHouse owners and renters - Other race residents 221 41.6% Owner occupied310 58.4% Renter occupiedHouse owners and renters - Two or more races residents 485 58.0% Owner occupied351 42.0% Renter occupiedHouse owners and renters - White alone residents 4,814 81.6% Owner occupied1,085 18.4% Renter occupiedHouse owners and renters - Hispanic or Latino residents 738 48.2% Owner occupied794 51.8% Renter occupied
Language usage in Villa Park
English speakers - Total 73.3% of residents of Villa Park speak English at home.
18.9% of residents speak Spanish at home 2,381 59.7% Speak English very well1,606 40.3% Speak English less than very well8.4% of residents speak other language at home 1,112 62.3% Speak English very well674 37.7% Speak English less than very well
English speakers - Born in the United States 90.0% of residents of Villa Park speak English at home.
6.3% of residents speak Spanish at home 184 100.0% Speak English very well2.2% of residents speak other language at home 64 100.0% Speak English very well
English speakers - Native, born elsewhere 62.4% of residents of Villa Park speak English at home.
33.9% of residents speak Spanish at home 35 34.7% Speak English very well66 65.3% Speak English less than very well7.4% of residents speak other language at home 22 100.0% Speak English very well
English speakers - Foreign-born 8.8% of residents of Villa Park speak English at home.
57.9% of residents speak Spanish at home 700 33.2% Speak English very well1,410 66.8% Speak English less than very well36.0% of residents speak other language at home 724 55.2% Speak English very well587 44.8% Speak English less than very well
White (Caucasian) - Speak only English Native:
93.3% (12,199)Foreign-born:
18.4% (307)
White (Caucasian) - Speak another language Native:
6.4% (841)Foreign-born:
81.7% (1,364)
Black or African American - Speak another language Native:
2.3% (22)Foreign-born:
100.0% (48)
American Indian / Alaska Native - Speak another language Native:
31.8% (42)Foreign-born:
100.0% (34)
Asian - Speak only English Native:
38.0% (93)Foreign-born:
1.5% (7)
Asian - Speak another language Native:
57.2% (140)Foreign-born:
99.8% (473)
Other race - Speak another language Native:
72.9% (645)Foreign-born:
100.0% (926)
Two or more races - Speak only English Native:
72.2% (1,740)Foreign-born:
2.1% (11)
Two or more races - Speak another language Native:
26.6% (642)Foreign-born:
99.6% (498)
White alone - Speak only English Native:
97.0% (11,952)Foreign-born:
30.2% (308)
White alone - Speak another language Native:
3.2% (390)Foreign-born:
70.3% (715)
Hispanic or Latino - Speak only English Native:
43.7% (1,401)Foreign-born:
1.7% (37)
Hispanic or Latino - Speak another language Native:
56.2% (1,799)Foreign-born:
99.0% (2,107)
Foreign-born residents in Villa Park 3,659 residents are foreign born (8.9% Latin America , 3.9% Europe , 2.2% Asia ).
This city:
16.2%Illinois:
14.1%
Marital status for residents in Villa Park Marital status - White (Caucasian) population 15 years and over
Males 35.7% Never married52.8% Now married1.0% Separated1.9% Widowed8.5% DivorcedFemales 29.8% Never married50.5% Now married0.9% Separated9.0% Widowed9.8% DivorcedWomen who gave birth in the past 12 months Now married:
85.9% (124)Unmarried:
14.1% (20)
Women who did not give birth in the past 12 months Now married:
45.3% (1,536)Unmarried:
54.7% (1,857)
Marital status - Black or African American population 15 years and over
Males 48.1% Never married43.5% Now married0.0% Separated0.0% Widowed8.3% DivorcedFemales 43.4% Never married32.6% Now married0.0% Separated12.2% Widowed11.8% DivorcedWomen who gave birth in the past 12 months Now married:
25.5% (12)Unmarried:
74.5% (36)
Women who did not give birth in the past 12 months Now married:
31.0% (73)Unmarried:
69.0% (163)
Marital status - American Indian / Alaska Native population 15 years and over
Males 58.9% Never married25.0% Now married0.0% Separated0.0% Widowed16.1% DivorcedFemales 45.2% Never married54.8% Now married0.0% Separated0.0% Widowed0.0% DivorcedWomen who did not give birth in the past 12 months Now married:
50.0% (47)Unmarried:
50.0% (47)
Marital status - Asian population 15 years and over
Males 31.9% Never married68.1% Now married0.0% Separated0.0% Widowed0.0% DivorcedFemales 15.8% Never married75.5% Now married0.0% Separated4.2% Widowed4.5% DivorcedWomen who gave birth in the past 12 months Now married:
86.7% (13)Unmarried:
13.3% (2)
Women who did not give birth in the past 12 months Now married:
69.7% (115)Unmarried:
30.3% (50)
Marital status - Other race population 15 years and over
Males 41.3% Never married56.2% Now married0.0% Separated0.0% Widowed2.5% DivorcedFemales 29.7% Never married59.6% Now married5.3% Separated4.6% Widowed0.7% DivorcedWomen who gave birth in the past 12 months Now married:
100.0% (67)Unmarried:
0.0% (0)
Women who did not give birth in the past 12 months Now married:
61.8% (230)Unmarried:
38.2% (142)
Marital status - Two or more races population 15 years and over
Males 55.3% Never married40.0% Now married1.0% Separated0.0% Widowed3.7% DivorcedFemales 40.2% Never married55.6% Now married0.0% Separated2.3% Widowed1.9% DivorcedWomen who gave birth in the past 12 months Now married:
74.4% (46)Unmarried:
25.6% (16)
Women who did not give birth in the past 12 months Now married:
51.2% (419)Unmarried:
48.8% (399)
Marital status - White alone, not Hispanic / Latino population 15 years and over
Males 34.0% Never married55.0% Now married0.8% Separated2.1% Widowed8.1% DivorcedFemales 25.3% Never married53.5% Now married0.9% Separated10.3% Widowed10.1% DivorcedWomen who gave birth in the past 12 months Now married:
85.9% (132)Unmarried:
14.1% (22)
Women who did not give birth in the past 12 months Now married:
49.5% (1,443)Unmarried:
50.5% (1,470)
Marital status - Hispanic or Latino population 15 years and over
Males 51.1% Never married40.1% Now married1.6% Separated0.0% Widowed7.1% DivorcedFemales 48.4% Never married43.9% Now married1.6% Separated1.9% Widowed4.3% DivorcedWomen who gave birth in the past 12 months Now married:
100.0% (50)Unmarried:
0.0% (0)
Women who did not give birth in the past 12 months Now married:
41.5% (636)Unmarried:
58.5% (897)
Ancestries in Villa Park
1,005 9.0% Irish865 7.8% Italian727 6.5% German583 5.2% English563 5.1% Polish515 4.6% European315 2.8% Dutch211 1.9% American203 1.8% Albanian166 1.5% African133 1.2% Czech131 1.2% Lithuanian114 1.0% Swedish102 0.9% Bulgarian96 0.9% Norwegian85 0.8% Yugoslavian68 0.6% Austrian56 0.5% Greek46 0.4% Serbian38 0.3% Senegalese34 0.3% Moroccan31 0.3% Eastern European29 0.3% Northern European29 0.3% Ukrainian27 0.2% Latvian24 0.2% Palestinian21 0.2% Maltese18 0.2% Scottish14 0.1% British13 0.1% Croatian12 0.1% French Canadian11 0.10% French11 0.10% Finnish10 0.09% Scotch-Irish8 0.07% Canadian7 0.06% Welsh2 0.02% Jordanian2 0.02% Portuguese1 0.01% Russian
Geographical mobility in Villa Park Same house 1 year ago 13,856 90.3% White (Caucasian)1,016 95.1% Black or African American233 99.7% American Indian / Alaska Native654 84.8% Asian1,570 84.4% Other race3,084 94.8% Two or more races12,578 91.1% White alone, not Hispanic / Latino5,023 87.5% Hispanic or LatinoMoved within same county 769 5.0% White / Caucasian12 1.2% Black or African American23 3.0% Asian209 11.2% Other race37 1.1% Two or more races584 4.2% White alone, not Hispanic / Latino410 7.1% Hispanic or LatinoMoved within same state 340 2.2% White / Caucasian14 1.3% Black or African American110 14.2% Asian10 0.5% Other race110 3.4% Two or more races360 2.6% White alone, not Hispanic / Latino58 1.0% Hispanic or LatinoMoved from different state 201 1.3% White / Caucasian10 0.9% Black or African American26 1.4% Other race27 0.8% Two or more races165 1.2% White alone, not Hispanic / Latino145 2.5% Hispanic or LatinoMoved from abroad 130 0.8% White28 2.6% Black or African American13 1.7% Asian93 0.7% White alone, not Hispanic / Latino62 1.1% Hispanic or Latino
Children Nativity (place of birth) in Villa Park
Children under 6 years - Living with two parents Both parents native 1,063 100.0% NativeBoth parents foreign-born 142 100.0% NativeOne native, one foreign-born parent 114 100.0% NativeChildren under 6 years - Living with one parent Native parent 261 100.0% NativeForeign-born parent 4 100.0% NativeChildren 6 to 17 years - Living with two parents Both parents native 1,600 100.0% NativeBoth parents foreign-born 667 95.9% Native28 4.1% Foreign-bornOne native, one foreign-born parent 151 100.0% NativeChildren 6 to 17 years - Living with one parent Native parent 376 100.0% NativeForeign-born parent 368 51.7% Native343 48.3% Foreign-born
Grandparents responsible for own grandchildren in Villa Park
Grandparents (30 to 59 years) White / Caucasian 23 100.0% Not responsible for grandchildrenBlack or African American 24 100.0% Not responsible for grandchildrenOther race 6 100.0% Not responsible for grandchildrenTwo or more races 25 57.5% Responsible for grandchildren19 42.5% Not responsible for grandchildrenWhite alone, not Hispanic / Latino 21 100.0% Not responsible for grandchildrenHispanic or Latino 6 26.7% Responsible for grandchildren16 73.3% Not responsible for grandchildrenGrandparents (60 years and over) White / Caucasian 38 39.8% Responsible for grandchildren58 60.2% Not responsible for grandchildrenBlack or African American 32 100.0% Not responsible for grandchildrenOther race 10 100.0% Not responsible for grandchildrenTwo or more races 10 100.0% Not responsible for grandchildrenWhite alone, not Hispanic / Latino 35 38.6% Responsible for grandchildren56 61.4% Not responsible for grandchildrenHispanic or Latino 24 38.7% Responsible for grandchildren38 61.3% Not responsible for grandchildren