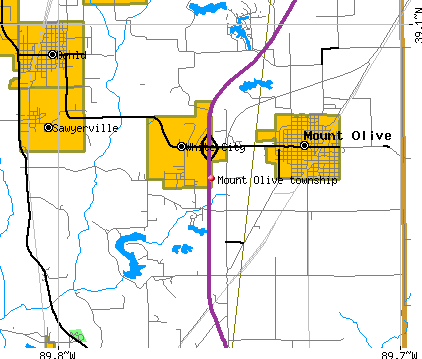
Mount Olive township, Macoupin County, Illinois (IL) detailed profile
Number of foreign born residents: 1 (83% naturalized citizens)
| Mount Olive township: | 0.9% |
| Whole state: | 12.3% |
74% of Mount Olive township residents lived in the same house 5 years ago.
Out of people who lived in different houses, 60% lived in this county.
Out of people who lived in different counties, 75% lived in Illinois.
Place of birth for U.S.-born residents:
- This state: 2863
- Northeast: 32
- Midwest: 379
- South: 77
- West: 62
Median price asked for vacant for-sale houses in 2000: $26,500
Percentage of households with unmarried partners: 5.3%
Likely homosexual households (counted as self-reported same-sex unmarried-partner households)
- Lesbian couples: 0.1% of all households
- Gay men: 0.3% of all households
Housing units in structures:
- One, detached: 1,295
- One, attached: 5
- Two: 43
- 3 or 4: 47
- 5 to 9: 15
- Mobile homes: 141
Median worth of mobile homes: $26,000
Housing units in Mount Olive township with a mortgage: 507 (47 second mortgage, 50 home equity loan, 0 both second mortgage and home equity loan)
Houses without a mortgage: 501
- Construction (12%)
- Metal and metal products (11%)
- Paper (6%)
- Truck transportation (5%)
- Professional, scientific, and technical services (5%)
- Educational services (4%)
- Accommodation and food services (4%)
- Health care (21%)
- Educational services (10%)
- Accommodation and food services (9%)
- Public administration (6%)
- Finance and insurance (6%)
- Food and beverage stores (6%)
- Administrative and support and waste management services (4%)
- Other production occupations including supervisors (10%)
- Driver/sales workers and truck drivers (9%)
- Building and grounds cleaning and maintenance occupations (6%)
- Electrical equipment mechanics and other installation, maintenance, and repair occupations including supervisors (6%)
- Laborers and material movers, hand (4%)
- Metal workers and plastic workers (4%)
- Printing workers (4%)
- Secretaries and administrative assistants (7%)
- Cashiers (7%)
- Cooks and food preparation workers (6%)
- Other production occupations including supervisors (5%)
- Registered nurses (5%)
- Other office and administrative support workers including supervisors (5%)
- Preschool, kindergarten, elementary and middle school teachers (5%)
Most common first ancestries reported in Mount Olive township:
- German (37.1%)
- United States or American (15.0%)
- Italian (7.5%)
- Irish (6.9%)
- Slovak (5.3%)
- English (4.0%)
- Scottish (2.3%)
Most common places of birth for the foreign-born residents:
- Germany (41%)
- Canada (31%)
- Czechoslovakia (includes Czech Republic and Slovakia) (14%)
- Yugoslavia (14%)
Means of transportation to work:
- Drove a car alone: 1,161 (82%)
- Carpooled: 192 (14%)
- Motorcycle: 3 (0%)
- Bicycle: 8 (1%)
- Walked: 22 (2%)
- Worked at home: 34 (2%)
Most commonly used house heating fuel:
- Utility gas (75%)
- Bottled, tank, or LP gas (16%)
- Electricity (7%)
- Wood (1%)
- No fuel used (1%)
96.9% of residents of Mount Olive township speak English at home.
0.4% of residents speak Spanish at home (100% speak English very well).
2.5% of residents speak other Indo-European language at home (87% speak English very well, 8% speak English well, 5% speak English not well).
0.1% of residents speak other language at home (100% speak English very well).
Household type by relationship:
Households: 3,452- In family households: 2,994 (737 male householders, 243 female householders)
796 spouses, 1,078 children (955 natural, 27 adopted, 96 stepchildren), 31 grandchildren, 35 brothers or sisters, 3 parents, 16 other relatives, 55 non-relatives
- In nonfamily households: 458 (148 male householders (109 living alone)), 255 female householders (240 living alone)), 55 nonrelatives
Size of family households: 439 2-persons, 242 3-persons, 188 4-persons, 61 5-persons, 39 6-persons, 11 7-or-more-persons,
Size of nonfamily households: 349 1-person, 46 2-persons, 8 3-persons,
586 married couples with children.
168 single-parent households (50 men, 118 women).
Private vs. public school enrollment:
Students in private schools in grades 1 to 8 (elementary and middle school): 21
| Here: | 5.6% |
| Illinois: | 13.4% |
Students in private schools in grades 9 to 12 (high school): 9
| Here: | 4.0% |
| Illinois: | 11.1% |
Students in private undergraduate colleges: 15
| Here: | 10.9% |
| Illinois: | 25.8% |