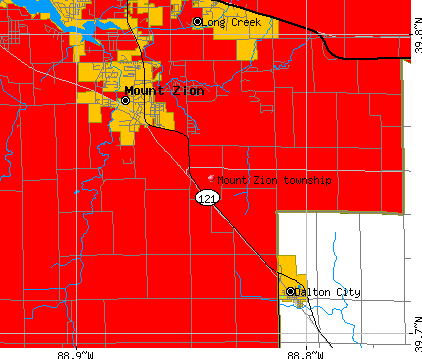
Mount Zion township, Macon County, Illinois (IL) detailed profile
Number of foreign born residents: 1 (60% naturalized citizens)
| Mount Zion township: | 1.2% |
| Whole state: | 12.3% |
57% of Mount Zion township residents lived in the same house 5 years ago.
Out of people who lived in different houses, 65% lived in this county.
Out of people who lived in different counties, 63% lived in Illinois.
Place of birth for U.S.-born residents:
- This state: 4898
- Northeast: 127
- Midwest: 716
- South: 289
- West: 161
Median price asked for vacant for-sale houses in 2000: $80,600
Percentage of households with unmarried partners: 3.4%
Likely homosexual households (counted as self-reported same-sex unmarried-partner households)
- Lesbian couples: 0.2% of all households
- Gay men: 0.3% of all households
59 people in nursing homes
Housing units in structures:
- One, detached: 2,027
- One, attached: 16
- Two: 10
- 3 or 4: 51
- 5 to 9: 222
- 10 to 19: 109
- Mobile homes: 6
Median worth of mobile homes: $37,500
Housing units in Mount Zion township with a mortgage: 1,341 (94 second mortgage, 129 home equity loan, 2 both second mortgage and home equity loan)
Houses without a mortgage: 458
- Machinery (8%)
- Construction (8%)
- Food (7%)
- Agriculture, forestry, fishing and hunting (5%)
- Educational services (5%)
- Plastics and rubber products (5%)
- Metal and metal products (4%)
- Health care (23%)
- Educational services (14%)
- Finance and insurance (9%)
- Social assistance (6%)
- Accommodation and food services (4%)
- Professional, scientific, and technical services (3%)
- Food (3%)
- Other production occupations including supervisors (9%)
- Electrical equipment mechanics and other installation, maintenance, and repair occupations including supervisors (5%)
- Driver/sales workers and truck drivers (5%)
- Other sales and related workers including supervisors (4%)
- Assemblers and fabricators (4%)
- Top executives (4%)
- Retail sales workers except cashiers (3%)
- Secretaries and administrative assistants (9%)
- Registered nurses (7%)
- Preschool, kindergarten, elementary and middle school teachers (6%)
- Health technologists and technicians (6%)
- Child care workers (4%)
- Other office and administrative support workers including supervisors (4%)
- Other healthcare support occupations (4%)
Most common first ancestries reported in Mount Zion township:
- German (31.2%)
- United States or American (19.5%)
- English (13.5%)
- Irish (10.2%)
- Italian (2.7%)
- Norwegian (2.3%)
- Swedish (1.6%)
Most common places of birth for the foreign-born residents:
- Mexico (38%)
- Korea (27%)
- Philippines (22%)
- Germany (13%)
Means of transportation to work:
- Drove a car alone: 3,007 (92%)
- Carpooled: 115 (4%)
- Bus or trolley bus: 7 (0%)
- Walked: 16 (0%)
- Other means: 8 (0%)
- Worked at home: 99 (3%)
Most commonly used house heating fuel:
- Utility gas (73%)
- Electricity (20%)
- Bottled, tank, or LP gas (7%)
59 people in nursing homes
97.0% of residents of Mount Zion township speak English at home.
1.0% of residents speak Spanish at home (44% speak English very well, 44% speak English not well, 11% don't speak English at all).
1.4% of residents speak other Indo-European language at home (73% speak English very well, 9% speak English well, 19% speak English not well).
0.4% of residents speak Asian or Pacific Island language at home (69% speak English very well, 31% speak English well).
0.1% of residents speak other language at home (38% speak English well, 63% speak English not well).
Household type by relationship:
Households: 6,255- In family households: 5,706 (1,560 male householders, 321 female householders)
1,662 spouses, 1,971 children (1,771 natural, 66 adopted, 134 stepchildren), 79 grandchildren, 2 brothers or sisters, 29 parents, 62 other relatives, 20 non-relatives
- In nonfamily households: 549 (264 male householders (212 living alone)), 223 female householders (212 living alone)), 62 nonrelatives
- In group quarters: 58 (all institutionalized)
Size of family households: 811 2-persons, 425 3-persons, 434 4-persons, 159 5-persons, 39 6-persons, 13 7-or-more-persons,
Size of nonfamily households: 424 1-person, 55 2-persons, 8 3-persons,
1,416 married couples with children.
234 single-parent households (50 men, 184 women).
Private vs. public school enrollment:
Students in private schools in grades 1 to 8 (elementary and middle school): 21
| Here: | 2.5% |
| Illinois: | 13.4% |
Students in private schools in grades 9 to 12 (high school): 30
| Here: | 7.3% |
| Illinois: | 11.1% |
Students in private undergraduate colleges: 21
| Here: | 8.6% |
| Illinois: | 25.8% |