Estimated zip code population in 2022: 15,811 Zip code population in 2010: 16,796 Zip code population in 2000: 17,553
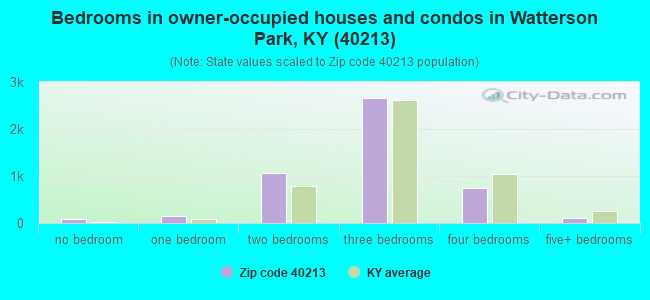
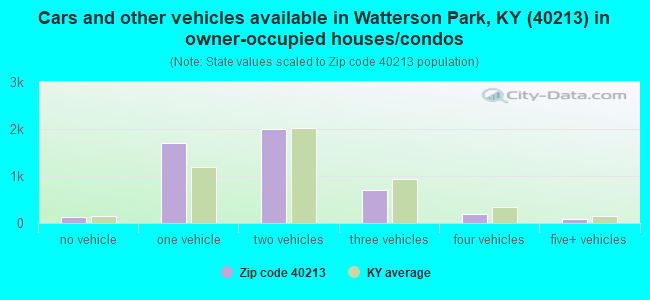
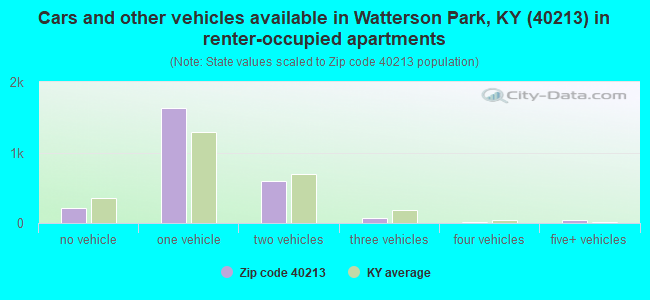
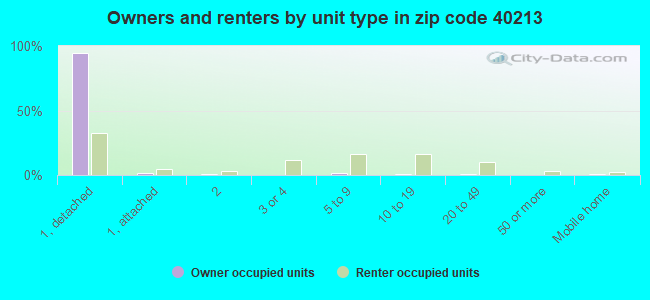
Houses and condos: 7,871 Renter-occupied apartments: 2,547
% of renters here:
35%
State:
31%
March 2022 cost of living index in zip code 40213: 87.5 (less than average, U.S. average is 100)
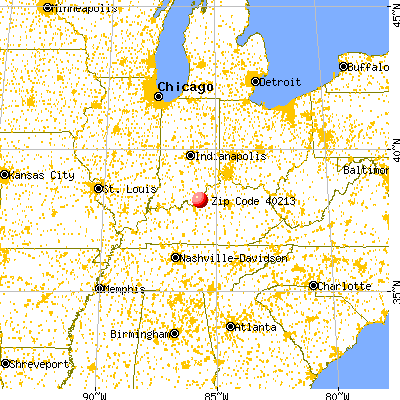
Land area: 12.5 sq. mi. Water area: 0.2 sq. mi.
Population density: 1,270 people per square mile
(low).
OSM Map
General Map
Google Map
MSN Map
OSM Map
General Map
Google Map
MSN Map
OSM Map
General Map
Google Map
MSN Map
OSM Map
General Map
Google Map
MSN Map
Please wait while loading the map...
Real estate property taxes paid for housing units in 2022:
This zip code:
0.8% ($1,472)
Kentucky:
0.7% ($1,456)
Median real estate property taxes paid for housing units with mortgages in 2022: $1,542 (0.8%) Median real estate property taxes paid for housing units with no mortgage in 2022: $1,329 (0.8%)
Estimated median house/condo value in 2022: $181,882
40213:
$181,882
Kentucky:
$196,300
According to our research of Kentucky and other state lists, there were 22 registered sex offenders living in 40213 zip code as of June 01, 2024. The ratio of all residents to sex offenders in zip code 40213 is 743 to 1. The ratio of registered sex offenders to all residents in this zip code is lower than the state average.
Median resident age:
This zip code:
39.0 years
Kentucky median age:
39.4 years
Average household size:
This zip code:
2.2 people
Kentucky:
2.4 people
Averages for the 2020 tax year for zip code 40213, filed in 2021:
Average Adjusted Gross Income (AGI) in 2020: $46,542 (Individual Income Tax Returns)
Here:
$46,542
State:
$61,342
Salary/wage: $40,816 (reported on 84.8% of returns)
Here:
$40,816
State:
$50,827
(% of AGI for various income ranges: 1260.4% for AGIs below $25k, 3737.5% for AGIs $25k-50k, 6347.1% for AGIs $50k-75k, 9301.4% for AGIs $75k-100k, 18383.4% for AGIs $100k-200k, 95483.3% for AGIs over 200k)
Taxable interest for individuals: $1,067 (reported on 17.7% of returns)
This zip code:
$1,067
Kentucky:
$1,441
(% of AGI for various income ranges: 6.8% for AGIs below $25k, 6.5% for AGIs $25k-50k, 26.6% for AGIs $50k-75k, 45.3% for AGIs $75k-100k, 121.2% for AGIs $100k-200k, 1656.7% for AGIs over 200k)
Ordinary dividends: $3,939 (reported on 12.3% of returns)
Here:
$3,939
State:
$7,388
(% of AGI for various income ranges: 14.5% for AGIs below $25k, 17.3% for AGIs $25k-50k, 49.1% for AGIs $50k-75k, 153.6% for AGIs $75k-100k, 370.9% for AGIs $100k-200k, 3913.3% for AGIs over 200k)
Net capital gain/loss in AGI: +$8,877 (reported on 9.9% of returns)
Here:
+$8,877
State:
+$19,475
(% of AGI for various income ranges: 9.5% for AGIs below $25k, 15.6% for AGIs $25k-50k, 61.1% for AGIs $50k-75k, 113.6% for AGIs $75k-100k, 631.2% for AGIs $100k-200k, 12980.0% for AGIs over 200k)
Profit/loss from business: +$8,165 (reported on 16.4% of returns)
Here:
+$8,165
State:
+$11,386
(% of AGI for various income ranges: 101.8% for AGIs below $25k, 94.8% for AGIs $25k-50k, 158.8% for AGIs $50k-75k, 268.1% for AGIs $75k-100k, 637.8% for AGIs $100k-200k, 7746.7% for AGIs over 200k)
Taxable individual retirement arrangement distribution: $15,738 (reported on 6.3% of returns)
40213:
$15,738
Kentucky:
$18,941
(% of AGI for various income ranges: 30.8% for AGIs below $25k, 66.2% for AGIs $25k-50k, 150.3% for AGIs $50k-75k, 339.4% for AGIs $75k-100k, 1100.6% for AGIs $100k-200k)
Total itemized deductions: $27,014 (reported on 4.3% of returns)
Here:
$27,014
State:
$32,473
(% of AGI for various income ranges: 29.5% for AGIs below $25k, 53.8% for AGIs $25k-50k, 198.4% for AGIs $50k-75k, 364.7% for AGIs $75k-100k, 647.8% for AGIs $100k-200k, 8720.0% for AGIs over 200k)
Charity contributions: $9,188 (reported on 3.1% of returns)
Here:
$9,188
State:
$13,472
(% of AGI for various income ranges: 7.8% for AGIs $25k-50k, 36.2% for AGIs $50k-75k, 70.8% for AGIs $75k-100k, 194.4% for AGIs $100k-200k, 3360.0% for AGIs over 200k)
Taxes paid: $6,997 (reported on 4.1% of returns)
40213:
$6,997
State:
$7,830
(% of AGI for various income ranges: 3.6% for AGIs below $25k, 11.5% for AGIs $25k-50k, 58.9% for AGIs $50k-75k, 120.6% for AGIs $75k-100k, 228.4% for AGIs $100k-200k, 1343.3% for AGIs over 200k)
Earned income credit: $2,043 (reported on 21.5% of returns)
Here:
$2,043
State:
$2,336
(% of AGI for various income ranges: 101.7% for AGIs below $25k, 56.8% for AGIs $25k-50k)
Percentage of individuals using paid preparers for their 2020 taxes: 92.8%
Here:
93%
State:
94%
(% for various income ranges: 91.8% for AGIs below $25k, 93.6% for AGIs $25k-50k, 94.2% for AGIs $50k-75k, 94.2% for AGIs $75k-100k, 90.3% for AGIs $100k-200k, 91.7% for AGIs over 200k)
Averages for the 2012 tax year for zip code 40213, filed in 2013:
Average Adjusted Gross Income (AGI) in 2012: $40,590 (Individual Income Tax Returns)
Here:
$40,590
State:
$50,814
Salary/wage: $34,324 (reported on 87.0% of returns)
Here:
$34,324
State:
$42,723
(% of AGI for various income ranges: 79.7% for AGIs below $25k, 84.5% for AGIs $25k-50k, 76.4% for AGIs $50k-75k, 77.1% for AGIs $75k-100k, 75.1% for AGIs $100k-200k, 38.7% for AGIs over 200k)
Taxable interest for individuals: $1,072 (reported on 21.0% of returns)
This zip code:
$1,072
Kentucky:
$1,381
(% of AGI for various income ranges: 0.6% for AGIs below $25k, 0.5% for AGIs $25k-50k, 0.6% for AGIs $50k-75k, 0.6% for AGIs $75k-100k, 0.7% for AGIs $100k-200k, 0.3% for AGIs over 200k)
Ordinary dividends: $3,599 (reported on 13.6% of returns)
Here:
$3,599
State:
$6,239
(% of AGI for various income ranges: 0.7% for AGIs below $25k, 0.6% for AGIs $25k-50k, 1.0% for AGIs $50k-75k, 1.2% for AGIs $75k-100k, 1.5% for AGIs $100k-200k, 2.7% for AGIs over 200k)
Net capital gain/loss in AGI: +$3,945 (reported on 8.9% of returns)
Here:
+$3,945
State:
+$11,336
(% of AGI for various income ranges: 0.1% for AGIs $25k-50k, 0.2% for AGIs $50k-75k, 1.1% for AGIs $75k-100k, 1.4% for AGIs $100k-200k, 3.4% for AGIs over 200k)
Profit/loss from business: +$9,659 (reported on 11.4% of returns)
Here:
+$9,659
State:
+$10,862
(% of AGI for various income ranges: 6.1% for AGIs below $25k, 2.1% for AGIs $25k-50k, 2.2% for AGIs $50k-75k, 1.5% for AGIs $75k-100k, 3.0% for AGIs $100k-200k, 1.6% for AGIs over 200k)
Taxable individual retirement arrangement distribution: $11,867 (reported on 7.3% of returns)
40213:
$11,867
Kentucky:
$14,296
(% of AGI for various income ranges: 1.9% for AGIs below $25k, 1.5% for AGIs $25k-50k, 2.4% for AGIs $50k-75k, 2.6% for AGIs $75k-100k, 4.6% for AGIs $100k-200k)
Total itemized deductions: $17,079 (21% of AGI, reported on 24.6% of returns)
Here:
$17,079
State:
$21,160
Here:
21.2% of AGI
State:
20.0% of AGI
(% of AGI for various income ranges: 5.0% for AGIs below $25k, 9.0% for AGIs $25k-50k, 12.5% for AGIs $50k-75k, 13.2% for AGIs $75k-100k, 15.2% for AGIs $100k-200k, 7.9% for AGIs over 200k)
Charity contributions: $3,109 (reported on 19.8% of returns)
Here:
$3,109
State:
$4,303
(% of AGI for various income ranges: 0.5% for AGIs below $25k, 1.0% for AGIs $25k-50k, 1.8% for AGIs $50k-75k, 1.9% for AGIs $75k-100k, 2.5% for AGIs $100k-200k, 1.8% for AGIs over 200k)
Taxes paid: $7,160 (reported on 24.3% of returns)
40213:
$7,160
State:
$8,496
(% of AGI for various income ranges: 0.8% for AGIs below $25k, 3.0% for AGIs $25k-50k, 4.7% for AGIs $50k-75k, 5.9% for AGIs $75k-100k, 7.8% for AGIs $100k-200k, 4.5% for AGIs over 200k)
Earned income credit: $2,139 (reported on 24.5% of returns)
Here:
$2,139
State:
$2,273
(% of AGI for various income ranges: 6.7% for AGIs below $25k, 1.1% for AGIs $25k-50k)
Percentage of individuals using paid preparers for their 2012 taxes: 50.1%
Here:
50%
State:
60%
(% for various income ranges: 48.3% for AGIs below $25k, 48.3% for AGIs $25k-50k, 55.7% for AGIs $50k-75k, 51.1% for AGIs $75k-100k, 58.5% for AGIs $100k-200k, 75.0% for AGIs over 200k)
Averages for the 2004 tax year for zip code 40213, filed in 2005:
Average Adjusted Gross Income (AGI) in 2004: $34,067 (Individual Income Tax Returns)
Here:
$34,067
State:
$41,540
Salary/wage: $30,727 (reported on 86.0% of returns)
Here:
$30,727
State:
$36,432
(% of AGI for various income ranges: 86.0% for AGIs below $10k, 78.2% for AGIs $10k-25k, 82.5% for AGIs $25k-50k, 81.1% for AGIs $50k-75k, 81.9% for AGIs $75k-100k, 62.8% for AGIs over 100k)
Taxable interest for individuals: $1,365 (reported on 34.3% of returns)
This zip code:
$1,365
Kentucky:
$1,571
(% of AGI for various income ranges: 3.2% for AGIs below $10k, 2.1% for AGIs $10k-25k, 1.2% for AGIs $25k-50k, 1.1% for AGIs $50k-75k, 0.9% for AGIs $75k-100k, 1.3% for AGIs over 100k)
Taxable dividends: $2,071 (reported on 18.0% of returns)
Here:
$2,071
State:
$3,453
(% of AGI for various income ranges: 1.7% for AGIs below $10k, 1.2% for AGIs $10k-25k, 0.8% for AGIs $25k-50k, 0.9% for AGIs $50k-75k, 0.8% for AGIs $75k-100k, 1.7% for AGIs over 100k)
Net capital gain/loss: +$4,593 (reported on 12.6% of returns)
Here:
+$4,593
State:
+$9,663
(% of AGI for various income ranges: -0.7% for AGIs below $10k, 0.3% for AGIs $10k-25k, 0.3% for AGIs $25k-50k, 0.6% for AGIs $50k-75k, 1.4% for AGIs $75k-100k, 6.4% for AGIs over 100k)
Profit/loss from business: +$8,326 (reported on 10.9% of returns)
Here:
+$8,326
State:
+$9,233
(% of AGI for various income ranges: 6.2% for AGIs below $10k, 3.7% for AGIs $10k-25k, 1.9% for AGIs $25k-50k, 2.3% for AGIs $50k-75k, 2.7% for AGIs $75k-100k, 2.8% for AGIs over 100k)
IRA payment deduction: $2,571 (reported on 2.1% of returns)
40213:
$2,571
Kentucky:
$2,955
(% of AGI for various income ranges: 0.1% for AGIs $10k-25k, 0.2% for AGIs $25k-50k, 0.1% for AGIs $50k-75k, 0.2% for AGIs $75k-100k, 0.1% for AGIs over 100k)
Self-employed pension: $6,867 (reported on 0.4% of returns)
Here:
$6,867
Kentucky:
$14,996
Total itemized deductions: $14,664 (23% of AGI, reported on 28.4% of returns)
Here:
$14,664
State:
$17,474
Here:
22.6% of AGI
State:
21.0% of AGI
(% of AGI for various income ranges: 7.2% for AGIs below $10k, 6.2% for AGIs $10k-25k, 10.9% for AGIs $25k-50k, 14.5% for AGIs $50k-75k, 16.1% for AGIs $75k-100k, 15.2% for AGIs over 100k)
Charity contributions deductions: $2,459 (4% of AGI, reported on 25.2% of returns)
Here:
$2,459
State:
$3,494
Here:
3.6% of AGI
State:
4.0% of AGI
(% of AGI for various income ranges: 0.5% for AGIs below $10k, 0.8% for AGIs $10k-25k, 1.4% for AGIs $25k-50k, 2.1% for AGIs $50k-75k, 2.6% for AGIs $75k-100k, 2.7% for AGIs over 100k)
Total tax: $4,392 (reported on 72.1% of returns)
40213:
$4,392
State:
$6,162
(% of AGI for various income ranges: 2.2% for AGIs below $10k, 3.9% for AGIs $10k-25k, 7.0% for AGIs $25k-50k, 9.0% for AGIs $50k-75k, 10.5% for AGIs $75k-100k, 17.5% for AGIs over 100k)
Earned income credit: $1,803 (reported on 20.2% of returns)
Here:
$1,803
State:
$1,723
Percentage of individuals using paid preparers for their 2004 taxes: 57.8%
Here:
58%
State:
66%
(% for various income ranges: 52.1% for AGIs below $10k, 59.0% for AGIs $10k-25k, 58.8% for AGIs $25k-50k, 59.0% for AGIs $50k-75k, 57.1% for AGIs $75k-100k, 68.3% for AGIs over 100k)
Likely homosexual households (counted as self-reported same-sex unmarried-partner households)
Lesbian couples: 0.3% of all households
Gay men: 0.2% of all households
Household received Food Stamps/SNAP in the past 12 months: 544 Household did not receive Food Stamps/SNAP in the past 12 months: 6,769
Women who had a birth in the past 12 months: 242 (165 now married, 75 unmarried) Women who did not have a birth in the past 12 months: 3,648 (1,404 now married, 2,238 unmarried)
Housing units in zip code 40213 with a mortgage: 2,823 (303 second mortgage, 269 both second mortgage and home equity loan) Houses without a mortgage: 109
Median monthly owner costs for units with a mortgage: $1,206 Median monthly owner costs for units without a mortgage: $478
Residents with income below the poverty level in 2022:
This zip code:
15.1%
Whole state:
16.5%
Residents with income below 50% of the poverty level in 2022:
This zip code:
8.4%
Whole state:
9.0%
Median number of rooms in houses and condos:
Here:
6.0
State:
6.4
Median number of rooms in apartments:
Here:
4.5
State:
4.4
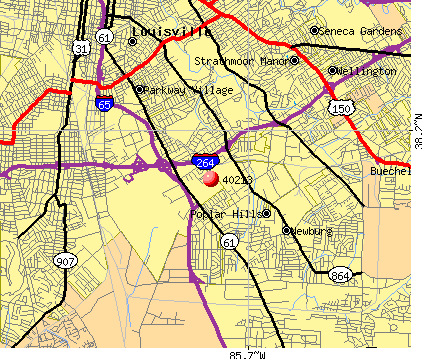
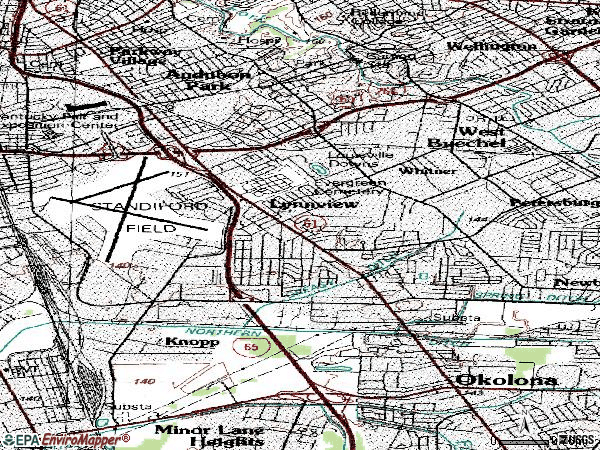
Notable locations in this zip code not listed on our city pages
Notable locations in zip code 40213: Strawberry Yards (A), Louisville Downs (B), Audubon Country Club (C), Rural Metro Ambulance Service (D), Kentucky Air National Guard Fire Department (E), Camp Taylor Fire District Station 2 (F), Louisville Fire Department Haz - Mat 1 (G), Louisville Fire Department Quint 9 (H), Okolona Fire Department Station 4 (I), Lee Terminal (J), Colonel Sanders Museum (K), Louisville International Airport Fire Department (L). Display/hide their locations on the map
Churches in zip code 40213 include: Gethsemane Church (A), Louisville Outreach Ministries (B), Kingdom Hall of Jehovahs Witnesses (C), Kentucky Avenue Church of Christ (D), Spirit of the Living God Church (E), Saint Luke United Methodist Church (F), Poplar Level Church of God of Anderson Indiana (G), Pilgrim Lutheran Church (H), Peace Presbyterian Church (I). Display/hide their locations on the map
2,106 married couples with children.
1,007 single-parent households (232 men, 775 women).
85.8% of residents of 40213 zip code speak English at home.
12.4% of residents speak Spanish at home (39% very well, 28% well, 20% not well, 13% not at all).
1.0% of residents speak other Indo-European language at home (24% very well, 35% well, 40% not well).
0.1% of residents speak Asian or Pacific Island language at home (90% very well, 10% not well).
0.2% of residents speak other language at home (88% very well, 12% well).
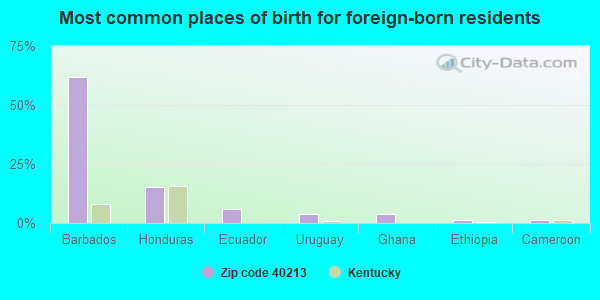
Foreign born population: 1,557 (9.9%) (38.0% of them are naturalized citizens)
This zip code:
9.9%
Whole state:
4.0%
62%Barbados
15%Honduras
6%Ecuador
4%Uruguay
4%Ghana
1%Ethiopia
1%Cameroon
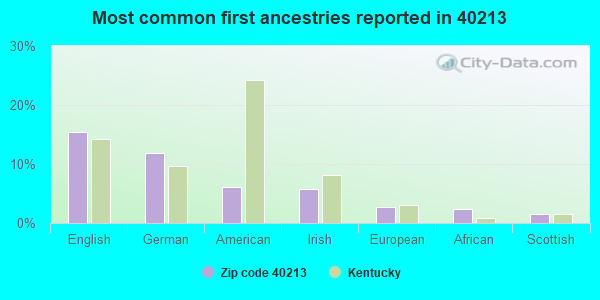
15%English
12%German
6%American
6%Irish
3%European
2%African
2%Scottish
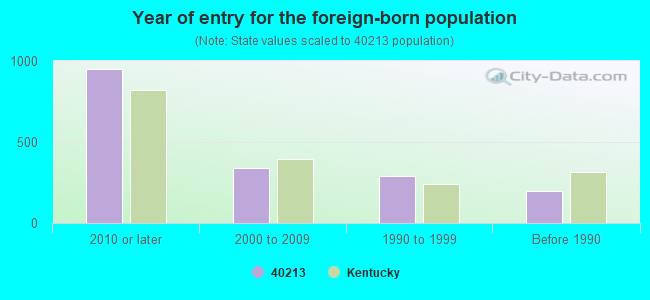
Year of entry for the foreign-born population
9522010 or later
3372000 to 2009
2891990 to 1999
195Before 1990
Major facilities with environmental interests located in this zip code:
BUNTON COMPANY (4601 EAST INDIAN TRAIL in LOUISVILLE, KY)
AIR MINOR (AIRS/AFS) COMPLIANCE ACTIVITY (Tracking inspections of insecticide, fungicide, and rodenticide, and toxic substances) CRITERIA AND HAZARDOUS AIR POLLUTANT INVENTORY (Inventory of air pollution sources) National Pollutant Discharge Elimination System NON-MAJOR (Tracking pollutant discharge elimination systems) - permit Small Quantity Generators, between 100 kg and 1000 kg of hazardous waste/month (Resource Conservation and Recovery Act (tracking hazardous waste)) - notification TRI REPORTER (Tracking of toxic chemicals releasing facilities) Business SIC classification: FABRICATED METAL PRODUCTS; FARM MACHINERY AND EQUIPMENT; LAWN AND GARDEN TRACTORS AND HOME LAWN AND GARDEN EQUIPMENT Business NAICS classification: ALL OTHER MISCELLANEOUS FABRICATED METAL PRODUCT MANUFACTURING. Organizations: GREENLEE TEXTRON INC (CONTACT/OWNER)
, TEXTRON INC (CONTACT/OWNER)
Alternative names: GREENLEE TEXTRON INC, GREENLEE TEXTRON INC LOUISVILLE
BROWN WOOD PRESERVING COMPANY INCORPORATED (5200 CRITTENDEN DRIVE in LOUISVILLE, KY)
AIR MINOR (AIRS/AFS) SUPERFUND (Superfund database) (Resource Conservation and Recovery Act (tracking hazardous waste)) TRI REPORTER (Tracking of toxic chemicals releasing facilities) Business SIC classification: WOOD PRESERVING; NONCLASSIFIABLE ESTABLISHMENTS Business NAICS classification: WOOD PRESERVATION. Organizations: BROWN WOOD PRESERVING/JAMES GRAHAM BROWN (CONTACT/OWNER)
CAMP TAYLOR ELEMENTARY SCHOOL (1446 BELMAR DRIVE in LOUISVILLE, KY)
(National Center for Education Statistics) - STATE ID-056275004 Organizations: JEFFERSON COUNTY (SCHOOL DISTRICT)
LOUISVILLE MALE TRADITIONAL HIGH SCHOOL (4409 PRESTON HIGHWAY in LOUISVILLE, KY)
(National Center for Education Statistics) - STATE ID-056275047 Organizations: JEFFERSON COUNTY (SCHOOL DISTRICT)
ALLIED SYSTEMS LTD (6709 GRADE LANE in LOUISVILLE, KY)
National Pollutant Discharge Elimination System NON-MAJOR (Tracking pollutant discharge elimination systems) - permit (Resource Conservation and Recovery Act (tracking hazardous waste)) Business SIC classification: TRUCKING, EXCEPT LOCAL Organizations: BOB RUTLAND (CONTACT/OWNER)
LIBERTY ALTERNATIVE HIGH SCHOOL (3307 E INDIAN TR in LOUISVILLE, KY)
(National Center for Education Statistics) - STATE ID-056275030 Organizations: JEFFERSON COUNTY (SCHOOL DISTRICT)
LAIDLAW INC (4446 POPLAR LEVEL ROAD in LOUISVILLE, KY)
National Pollutant Discharge Elimination System NON-MAJOR (Tracking pollutant discharge elimination systems) - permit Conditionally Exempt Small Quantity Generators, less than 100 kg/month of hazardous waste (Resource Conservation and Recovery Act (tracking hazardous waste)) - notification Business SIC classification: LOCAL TRUCKING WITHOUT STORAGE Business NAICS classification: OTHER COMMERCIAL AND SERVICE INDUSTRY MACHINERY MANUFACTURING. Organizations: ALLIED WASTE INDUSTRIES INC (CONTACT/OWNER)
Alternative names: LAIDLAW WASTE/ALLIED WASTE INDUSTRIES
CARRIER VIBRATING EQ (3400 FERN VALLEY RD in LOUISVILLE, KY)
AIR MINOR (AIRS/AFS) COMPLIANCE ACTIVITY (Tracking inspections of insecticide, fungicide, and rodenticide, and toxic substances) Conditionally Exempt Small Quantity Generators, less than 100 kg/month of hazardous waste (Resource Conservation and Recovery Act (tracking hazardous waste)) - notification Business SIC classification: CONVEYORS AND CONVEYING EQUIPMENT Business NAICS classification: CONVEYOR AND CONVEYING EQUIPMENT MANUFACTURING. Organizations: CARRIER VIBRATING EQUIPMENT INC (CONTACT/OWNER)
Alternative names: CARRIER VIBRATING CO INC, CARRIER VIBRATING EQUIPMENT, INC
CENTRAL TRANSPORT INC (4500 MASON DIXON LN in LOUISVILLE, KY)
COMPLIANCE ACTIVITY (Tracking inspections of insecticide, fungicide, and rodenticide, and toxic substances) National Pollutant Discharge Elimination System NON-MAJOR (Tracking pollutant discharge elimination systems) - permit Business SIC classification: TRUCKING, EXCEPT LOCAL; TERMINAL AND JOINT TERMINAL MAINTENANCE FACILITIES FOR MOTOR FREIGHT TRANSPORTATION
BREMNER INCORPORATED (1001 STANDIFORD LANE in LOUISVILLE, KY)
CRITERIA AND HAZARDOUS AIR POLLUTANT INVENTORY (Inventory of air pollution sources) (Resource Conservation and Recovery Act (tracking hazardous waste)) TRI REPORTER (Tracking of toxic chemicals releasing facilities) Business SIC classification: COOKIES AND CRACKERS Organizations: BREMNER DIVISION (CONTACT/OWNER)
Alternative names: BREMMER INC., BREMNER DIVISION
NATIONAL ICEE CORP (4391 POPLAR LEVEL RD in LOUISVILLE, KY)
National Pollutant Discharge Elimination System NON-MAJOR (Tracking pollutant discharge elimination systems) - permit Business SIC classification: AIR-CONDITIONING AND WARM AIR HEATING EQUIPMENT AND COMMERCIAL AND INDUSTRIAL REFRIGERATION EQUIPMENT
ALUMINUM CRUISER INCORPORATED (STANDIFORD FIELD in LOUISVILLE, KY)
CRITERIA AND HAZARDOUS AIR POLLUTANT INVENTORY (Inventory of air pollution sources) (Resource Conservation and Recovery Act (tracking hazardous waste)) Business SIC classification: SHIP BUILDING AND REPAIRING Organizations: ERNST-WESTERN (CONTACT/OWNER)
Alternative names: ALUMINUM CRUISERS INC (CLOSED 10/9
NATIONAL ICEE CORP (3318 GILMORE INDUSTRIAL BLVD in LOUISVILLE, KY)
National Pollutant Discharge Elimination System NON-MAJOR (Tracking pollutant discharge elimination systems) - permit Business SIC classification: FOOD PRODUCTS MACHINERY
Housing units lacking complete plumbing facilities: 0.7% Housing units lacking complete kitchen facilities: 0.2%
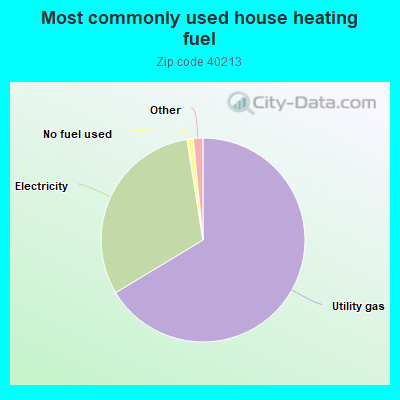
66.3%Utility gas
31.1%Electricity
1.0%No fuel used
0.9%Bottled, tank, or LP gas
0.6%Other fuel
Population in 1990: 21,288.
Place of birth for U.S.-born residents:
This state: 10,446
Northeast: 278
Midwest: 1,566
South: 1,347
West: 395
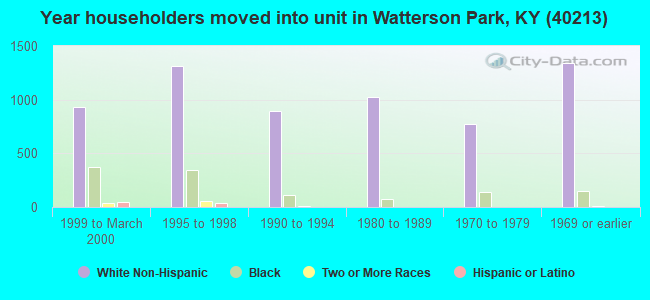
62% of the 40213 zip code residents lived in the same house 5 years ago. Out of people who lived in different houses, 78% lived in this county. Out of people who lived in different counties, 50% lived in Kentucky.
93% of the 40213 zip code residents lived in the same house 1 year ago. Out of people who lived in different houses, 64% moved from this county. Out of people who lived in different houses, 5% moved from different county within same state. Out of people who lived in different houses, 23% moved from different state. Out of people who lived in different houses, 11% moved from abroad.
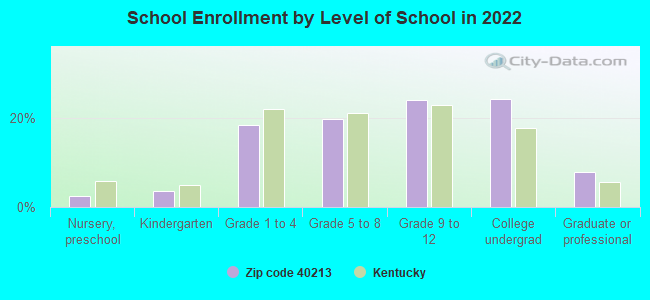
Private vs. public school enrollment:
Students in private schools in grades 1 to 8 (elementary and middle school): 397
Here:
34.4%
Kentucky:
17.2%
Students in private schools in grades 9 to 12 (high school): 209
Here:
29.1%
Kentucky:
15.2%
Students in private undergraduate colleges: 194
Here:
27.0%
Kentucky:
19.6%
Occupation by median earnings in the past 12 months ($)
80,499Architecture and engineering occupations
64,560Health diagnosing and treating practitioners and other technical occupations
62,562Construction and extraction occupations
58,278Business and financial operations occupations
56,842Installation, maintenance, and repair occupations
56,332Law enforcement workers including supervisors
Companies with biggest federal contracts located in this zip code (LOUISVILLE, KY):
UPS CONTRACTOR TEAM (825 LOTUS AVE) : $193,257,709 in 174 contractsfrom 2005 to 2006
Contracts for Air Charter for Things, Passenger Air Charter Service by Air Force Signed by year:2000: $0; 2001: $0; 2002: $0; 2003: $0; 2004: $0; 2005: $93,393,250; 2006: $99,864,459.
Biggest contracts:
$10,665,613 with Air Force for Air Charter for Things. Signed on 2005-10-01. Completion date: 2006-09-30.
$9,028,153, same as above.Signed on 2005-12-21. Completion date: 2006-09-30.
$8,889,726, same as above.Signed on 2005-10-01. Completion date: 2006-09-30.
$8,126,131 with Air Force for Passenger Air Charter Service. Signed on 2006-03-02. Completion date: 2006-09-30.
MACQUARIE AVIATION NORTH AMERI (1131 STANDIFORD AVENUE; small business) : $36,216,275 in 6 contractsfrom 2001 to 2005
Contracts for Liquid Propellants and Fuels, Petroleum Base by Defense Logistics Agency Signed by year:2000: $0; 2001: $8,891,312; 2002: $0; 2003: $0; 2004: $2,307,987; 2005: $25,016,976; 2006: $0.
Biggest contracts:
$24,862,800 with Defense Logistics Agency for Liquid Propellants and Fuels, Petroleum Base. Signed on 2005-04-11. Completion date: 2010-07-31.
$8,172,500, same as above.Signed on 2001-09-28. Completion date: 2004-09-30.
$2,307,987, same as above.Signed on 2004-10-22. Completion date: 2008-09-30.
$718,812, same as above.Signed on 2001-09-30. Completion date: 2004-09-30.
ARCO ENGINEERING INC (3317 GILMORE INDUSTRIAL B; small business) 1000 employees, $0 revenue. : $950,217 in 30 contractsfrom 2000 to 2006
Contracts for Electric Lamps, Electric Vehicular Lights and Fixtures, Miscellaneous Battery Retaining Fixtures and Liners, Airframe Structural Components, and moreby Defense Logistics Agency Signed by year:2000: $116,540; 2001: $228,810; 2002: $188,712; 2003: $45,714; 2004: $152,096; 2005: $135,384; 2006: $82,961.
Biggest contracts:
$98,982 with Defense Logistics Agency for Electric Lamps. Signed on 2001-02-14. Completion date: 2001-02-14.
$78,972 with Defense Logistics Agency for Electric Vehicular Lights and Fixtures. Signed on 2001-02-17. Completion date: 2001-06-30.
$50,856 with Defense Logistics Agency for Miscellaneous Battery Retaining Fixtures and Liners. Signed on 2001-05-22. Completion date: 2001-08-20.
$48,516, same as above.Signed on 2000-06-12. Completion date: 2000-09-10.
RECREONICS, INC (4200 SCHMITT AVENUE; small business) : $659,378 in 47 contractsfrom 2001 to 2006
Contracts for Athletic and Sporting Equipment, Recreational and Gymnastic Equipment, Miscellaneous Furniture and Fixtures, , and moreby Navy, Federal Supply Service, Air Force, Army, and others Signed by year:2000: $0; 2001: $68,213; 2002: $3,961; 2003: $127,560; 2004: $163,324; 2005: $251,755; 2006: $44,565.
Biggest contracts:
$92,186 with Navy for Athletic and Sporting Equipment. Signed on 2005-07-26. Completion date: 2005-09-02.
$76,844 with Navy for Recreational and Gymnastic Equipment. Taking place in MD. Signed on 2005-08-10. Completion date: 2005-09-06.
$52,815 with Navy for Athletic and Sporting Equipment. Signed on 2004-09-29. Completion date: 2004-12-29.
$46,173 with Navy for Recreational and Gymnastic Equipment. Taking place in WA. Signed on 2003-02-06. Completion date: 2003-02-21.
CARDINAL CARRYOR INC (1055 GRADE LN; small business) : $290,934 in 30 contractsfrom 2002 to 2006
Contracts for Maintenance, Repair and Rebuilding of Equipment -- Materials Handling Equipment, Cabinets, Lockers, Bins, and Shelving, Miscellaneous Items, Miscellaneous Materials Handling Equipment, and moreby Army, Bureau of the Census, Department of Veterans Affairs Signed by year:2000: $0; 2001: $0; 2002: $64,602; 2003: $122,172; 2004: $73,195; 2005: $29,121; 2006: $1,844.
Biggest contracts:
$65,600 with Army for Maintenance, Repair and Rebuilding of Equipment -- Materials Handling Equipment. Signed on 2004-12-07. Completion date: 2003-09-23.
$43,400 with Army for Cabinets, Lockers, Bins, and Shelving. Signed on 2003-09-09. Completion date: 2003-12-10.
$38,937 with Army for Miscellaneous Items. Signed on 2003-09-30. Completion date: 2003-11-28.
$30,000 with Army for Maintenance, Repair and Rebuilding of Equipment -- Materials Handling Equipment. Signed on 2005-10-07. Completion date: 2003-09-23.
UNITED CONSTRUCTION & DESIGN G (4637 ILLINOIS AVE; small business) : $259,259 in 14 contractsfrom 2002 to 2005
Contracts for Maintenance, Repair or Alteration of Real Property -- Other Administrative Facilities and Service Buildings, Industrial Buildings, Miscellaneous Items, Equipment and Materials Testing -- Construction and Building Materials by Bureau of the Census, Army Signed by year:2000: $0; 2001: $0; 2002: $82,000; 2003: $149,330; 2004: $17,262; 2005: $10,667; 2006: $0.
Biggest contracts:
$82,000 with Bureau of the Census for Maintenance, Repair or Alteration of Real Property -- Other Administrative Facilities and Service Buildings. Taking place in IN. Signed on 2002-07-15. Completion date: 2002-10-15.
$51,026 with Army for Industrial Buildings. Signed on 2003-07-31. Completion date: 2003-10-31.
$38,937 with Army for Miscellaneous Items. Signed on 2003-09-30. Completion date: 2003-09-30.
$31,827, same as above.Signed on 2003-10-04. Completion date: 2003-09-30.
SANG CORPORATION (4574 MELTON AVENUE; small business) : $212,257 in 14 contractsin 2000
Contracts for Construction of Structures and Facilities -- Water Supply Facilities, Mineral Construction Materials, Bulk, Construction of Structures and Facilities -- Other Non-Building Facilities by U.S. Army Corps of Engineers - civil program financing only, Army Signed by year:2000: $212,257; 2001: $0; 2002: $0; 2003: $0; 2004: $0; 2005: $0; 2006: $0.
Biggest contracts:
$82,948 with U.S. Army Corps of Engineers - civil program financing only for Construction of Structures and Facilities -- Water Supply Facilities. Signed on 2000-02-10. Completion date: 2000-02-15.
$42,522, same as above.Signed on 2000-02-18. Completion date: 2000-02-15.
$29,000 with Army for Mineral Construction Materials, Bulk. Signed on 2000-06-26. Completion date: 2000-06-30.
$29,000, same as above.Signed on 2000-05-19. Completion date: 2000-05-19.
METAL SOLUTIONS LLC (4560 KNOPP AVE; small business) : $108,879 in 6 contractsin 2005
Contracts for Hardware, Commercial, Cabinets, Lockers, Bins, and Shelving, Electrical Hardware and Supplies, Guns, 75 mm through 125 mm by Navy Signed by year:2000: $0; 2001: $0; 2002: $0; 2003: $0; 2004: $0; 2005: $108,879; 2006: $0.
Biggest contracts:
$72,528 with Navy for Hardware, Commercial. Signed on 2005-07-22. Completion date: 2005-08-31.
$16,400 with Navy for Cabinets, Lockers, Bins, and Shelving. Signed on 2005-05-24. Completion date: 2005-06-24.
$7,200 with Navy for Hardware, Commercial. Signed on 2005-02-04. Completion date: 2005-03-16.
$4,513 with Navy for Electrical Hardware and Supplies. Signed on 2005-09-20. Completion date: 2005-10-19.
STANLEY EMBERTON (2812 SMILAX AVE; small business) : $102,338 in 9 contractsfrom 2003 to 2006
Contracts for Facilities Operations Support Services by U.S. Army Corps of Engineers - civil program financing only, Army Signed by year:2000: $0; 2001: $0; 2002: $0; 2003: $39,184; 2004: $42,904; 2005: $0; 2006: $20,250.
Biggest contracts:
$20,956 with U.S. Army Corps of Engineers - civil program financing only for Facilities Operations Support Services. Signed on 2004-12-30. Completion date: 2005-01-01.
$20,956 with Army for Facilities Operations Support Services. Signed on 2004-12-30. Completion date: 2005-01-01.
$20,250, same as above.Signed on 2006-05-10. Completion date: 2005-01-01.
$19,592, same as above.Signed on 2003-12-30. Completion date: 2004-12-31.
HENDERSON SERVICES, LLC (4502 POPLAR LEVEL RD) : $63,605 in 2 contractsfrom 2003 to 2004
$60,055 with Army for Miscellaneous Electrical and Electronic Components. Signed on 2003-09-16. Completion date: 2004-01-31.
$3,550 with Army for Miscellaneous Items. Signed on 2004-01-22. Completion date: 2004-01-28.
Top industries in this zip code by the number of employees in 2005:
Information: Data Processing, Hosting, and Related Services (over 1000 employees: 1 establishment)
2002 - 2018 National Fire Incident Reporting System (NFIRS) incidents
According to the data from the years 2002 - 2018 the average number of fires per year is 100. The highest number of fires - 145 took place in 2018, and the least - 51 in 2002. The data has a growing trend.
When looking into fire subcategories, the most incidents belonged to: Structure Fires (36.8%), and Outside Fires (30.6%).
Fire incident types reported to NFIRS in Zip Code 40213


 Nearest zip codes: 40231, 40209, 40217, 40219, 40205, 40204.


 According to the data from the years 2002 - 2018 the average number of fires per year is 100. The highest number of fires - 145 took place in 2018, and the least - 51 in 2002. The data has a growing trend.
 When looking into fire subcategories, the most incidents belonged to: Structure Fires (36.8%), and Outside Fires (30.6%).