Estimated zip code population in 2022: 33,401 Zip code population in 2010: 31,361 Zip code population in 2000: 32,208
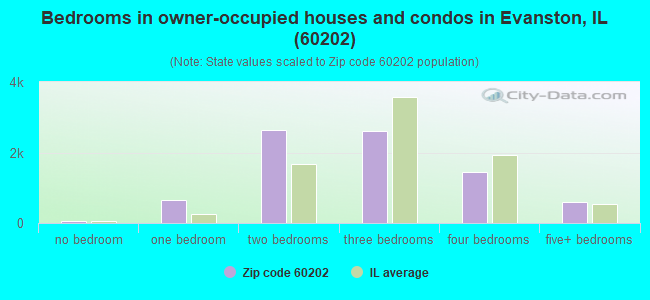
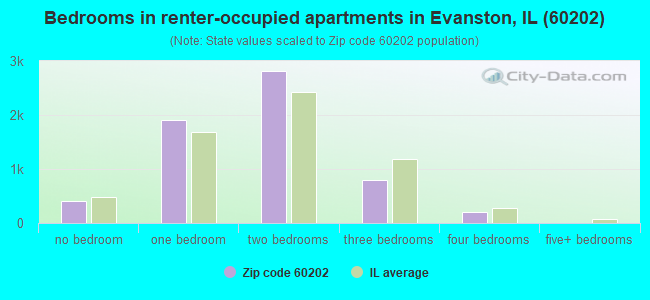
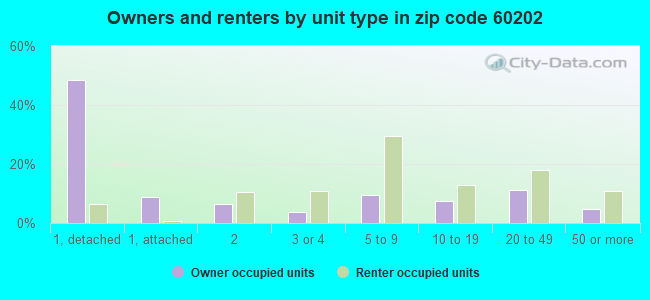
Houses and condos: 15,159 Renter-occupied apartments: 6,122
% of renters here:
43%
State:
33%
March 2022 cost of living index in zip code 60202: 102.3 (near average, U.S. average is 100)
Land area: 3.1 sq. mi. Water area: 0.6 sq. mi.
Population density: 10,932 people per square mile
(high).
OSM Map
General Map
Google Map
MSN Map
OSM Map
General Map
Google Map
MSN Map
OSM Map
General Map
Google Map
MSN Map
OSM Map
General Map
Google Map
MSN Map
Please wait while loading the map...
Real estate property taxes paid for housing units in 2022:
This zip code:
1.8% ($7,039)
Illinois:
2.0% ($4,912)
Median real estate property taxes paid for housing units with mortgages in 2022: $7,343 (1.8%) Median real estate property taxes paid for housing units with no mortgage in 2022: $6,613 (2.0%)
Estimated median house/condo value in 2022: $388,396
60202:
$388,396
Illinois:
$251,600
According to our research of Illinois and other state lists, there were 10 registered sex offenders living in 60202 zip code as of June 10, 2024. The ratio of all residents to sex offenders in zip code 60202 is 3,288 to 1. The ratio of registered sex offenders to all residents in this zip code is much lower than the state average.
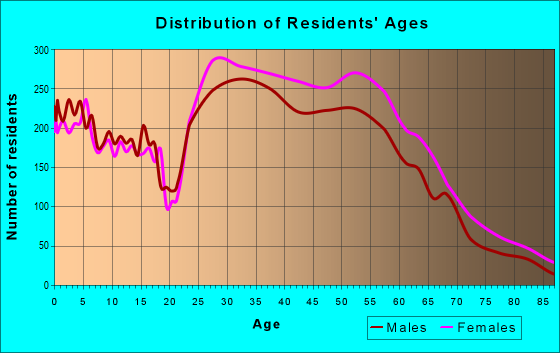
Median resident age:
This zip code:
40.2 years
Illinois median age:
39.1 years
Average household size:
This zip code:
2.3 people
Illinois:
2.4 people
Averages for the 2020 tax year for zip code 60202, filed in 2021:
Average Adjusted Gross Income (AGI) in 2020: $104,372 (Individual Income Tax Returns)
Here:
$104,372
State:
$82,626
Salary/wage: $80,779 (reported on 81.8% of returns)
Here:
$80,779
State:
$66,640
(% of AGI for various income ranges: 1125.1% for AGIs below $25k, 3778.4% for AGIs $25k-50k, 6949.7% for AGIs $50k-75k, 10058.1% for AGIs $75k-100k, 18651.6% for AGIs $100k-200k, 94847.4% for AGIs over 200k)
Taxable interest for individuals: $2,341 (reported on 34.3% of returns)
This zip code:
$2,341
Illinois:
$2,376
(% of AGI for various income ranges: 15.5% for AGIs below $25k, 24.8% for AGIs $25k-50k, 36.2% for AGIs $50k-75k, 65.9% for AGIs $75k-100k, 142.3% for AGIs $100k-200k, 1842.2% for AGIs over 200k)
Ordinary dividends: $13,241 (reported on 30.6% of returns)
Here:
$13,241
State:
$9,061
(% of AGI for various income ranges: 62.9% for AGIs below $25k, 82.8% for AGIs $25k-50k, 147.6% for AGIs $50k-75k, 297.7% for AGIs $75k-100k, 664.1% for AGIs $100k-200k, 10022.4% for AGIs over 200k)
Net capital gain/loss in AGI: +$40,957 (reported on 27.1% of returns)
Here:
+$40,957
State:
+$31,684
(% of AGI for various income ranges: 26.1% for AGIs below $25k, 74.7% for AGIs $25k-50k, 120.5% for AGIs $50k-75k, 282.4% for AGIs $75k-100k, 751.1% for AGIs $100k-200k, 35110.9% for AGIs over 200k)
Profit/loss from business: +$15,910 (reported on 22.5% of returns)
Here:
+$15,910
State:
+$12,175
(% of AGI for various income ranges: 173.5% for AGIs below $25k, 191.8% for AGIs $25k-50k, 283.3% for AGIs $50k-75k, 448.7% for AGIs $75k-100k, 996.7% for AGIs $100k-200k, 5070.2% for AGIs over 200k)
Taxable individual retirement arrangement distribution: $27,795 (reported on 9.1% of returns)
60202:
$27,795
Illinois:
$21,613
(% of AGI for various income ranges: 52.1% for AGIs below $25k, 110.2% for AGIs $25k-50k, 230.3% for AGIs $50k-75k, 375.2% for AGIs $75k-100k, 854.3% for AGIs $100k-200k, 3461.3% for AGIs over 200k)
Self-employed (Keogh) retirement plans: $29,683 (reported on 1.8% of returns)
60202:
$29,683
Illinois:
$30,962
(% of AGI for various income ranges: 21.6% for AGIs $50k-75k, 75.8% for AGIs $100k-200k, 1540.0% for AGIs over 200k)
Total itemized deductions: $39,943 (reported on 14.9% of returns)
Here:
$39,943
State:
$34,948
(% of AGI for various income ranges: 80.4% for AGIs below $25k, 180.0% for AGIs $25k-50k, 448.6% for AGIs $50k-75k, 665.2% for AGIs $75k-100k, 1346.1% for AGIs $100k-200k, 11865.2% for AGIs over 200k)
Charity contributions: $17,829 (reported on 12.7% of returns)
Here:
$17,829
State:
$13,122
(% of AGI for various income ranges: 5.6% for AGIs below $25k, 23.3% for AGIs $25k-50k, 56.6% for AGIs $50k-75k, 116.1% for AGIs $75k-100k, 295.9% for AGIs $100k-200k, 6406.1% for AGIs over 200k)
Taxes paid: $8,566 (reported on 14.9% of returns)
60202:
$8,566
State:
$8,563
(% of AGI for various income ranges: 16.4% for AGIs below $25k, 42.6% for AGIs $25k-50k, 117.0% for AGIs $50k-75k, 227.7% for AGIs $75k-100k, 426.0% for AGIs $100k-200k, 1805.7% for AGIs over 200k)
Earned income credit: $1,944 (reported on 11.4% of returns)
Here:
$1,944
State:
$2,311
(% of AGI for various income ranges: 76.7% for AGIs below $25k, 52.0% for AGIs $25k-50k)
Percentage of individuals using paid preparers for their 2020 taxes: 91.9%
Here:
92%
State:
93%
(% for various income ranges: 90.2% for AGIs below $25k, 92.2% for AGIs $25k-50k, 92.2% for AGIs $50k-75k, 91.2% for AGIs $75k-100k, 92.2% for AGIs $100k-200k, 95.1% for AGIs over 200k)
Averages for the 2012 tax year for zip code 60202, filed in 2013:
Average Adjusted Gross Income (AGI) in 2012: $83,022 (Individual Income Tax Returns)
Here:
$83,022
State:
$68,058
Salary/wage: $65,774 (reported on 84.7% of returns)
Here:
$65,774
State:
$55,396
(% of AGI for various income ranges: 75.5% for AGIs below $25k, 83.2% for AGIs $25k-50k, 80.6% for AGIs $50k-75k, 77.7% for AGIs $75k-100k, 77.5% for AGIs $100k-200k, 49.5% for AGIs over 200k)
Taxable interest for individuals: $1,990 (reported on 37.1% of returns)
This zip code:
$1,990
Illinois:
$1,969
(% of AGI for various income ranges: 1.1% for AGIs below $25k, 0.5% for AGIs $25k-50k, 0.6% for AGIs $50k-75k, 0.7% for AGIs $75k-100k, 0.7% for AGIs $100k-200k, 1.2% for AGIs over 200k)
Ordinary dividends: $9,229 (reported on 29.1% of returns)
Here:
$9,229
State:
$7,786
(% of AGI for various income ranges: 3.0% for AGIs below $25k, 1.5% for AGIs $25k-50k, 1.7% for AGIs $50k-75k, 2.2% for AGIs $75k-100k, 2.4% for AGIs $100k-200k, 4.9% for AGIs over 200k)
Net capital gain/loss in AGI: +$31,202 (reported on 23.3% of returns)
Here:
+$31,202
State:
+$22,183
(% of AGI for various income ranges: 0.3% for AGIs below $25k, 0.6% for AGIs $25k-50k, 0.7% for AGIs $50k-75k, 0.9% for AGIs $75k-100k, 1.2% for AGIs $100k-200k, 20.4% for AGIs over 200k)
Profit/loss from business: +$16,242 (reported on 21.3% of returns)
Here:
+$16,242
State:
+$12,903
(% of AGI for various income ranges: 11.6% for AGIs below $25k, 5.1% for AGIs $25k-50k, 3.9% for AGIs $50k-75k, 3.5% for AGIs $75k-100k, 4.0% for AGIs $100k-200k, 3.4% for AGIs over 200k)
Taxable individual retirement arrangement distribution: $25,632 (reported on 9.8% of returns)
60202:
$25,632
Illinois:
$17,929
(% of AGI for various income ranges: 2.9% for AGIs below $25k, 2.1% for AGIs $25k-50k, 2.5% for AGIs $50k-75k, 3.2% for AGIs $75k-100k, 2.7% for AGIs $100k-200k, 3.5% for AGIs over 200k)
Self-employment retirement plans: $24,023 (reported on 1.9% of returns)
60202:
$24,023
Illinois:
$24,666
(% of AGI for various income ranges: 0.3% for AGIs below $25k, 0.2% for AGIs $50k-75k, 0.2% for AGIs $75k-100k, 0.3% for AGIs $100k-200k, 1.0% for AGIs over 200k)
Total itemized deductions: $30,088 (20% of AGI, reported on 42.1% of returns)
Here:
$30,088
State:
$26,433
Here:
20.0% of AGI
State:
19.2% of AGI
(% of AGI for various income ranges: 14.2% for AGIs below $25k, 11.4% for AGIs $25k-50k, 14.7% for AGIs $50k-75k, 16.7% for AGIs $75k-100k, 16.6% for AGIs $100k-200k, 15.3% for AGIs over 200k)
Charity contributions: $4,383 (reported on 35.7% of returns)
Here:
$4,383
State:
$4,525
(% of AGI for various income ranges: 0.9% for AGIs below $25k, 1.1% for AGIs $25k-50k, 1.5% for AGIs $50k-75k, 1.7% for AGIs $75k-100k, 1.9% for AGIs $100k-200k, 2.3% for AGIs over 200k)
Taxes paid: $13,600 (reported on 42.0% of returns)
60202:
$13,600
State:
$11,968
(% of AGI for various income ranges: 4.3% for AGIs below $25k, 4.0% for AGIs $25k-50k, 5.8% for AGIs $50k-75k, 7.0% for AGIs $75k-100k, 7.8% for AGIs $100k-200k, 7.6% for AGIs over 200k)
Earned income credit: $2,050 (reported on 14.0% of returns)
Here:
$2,050
State:
$2,349
(% of AGI for various income ranges: 5.9% for AGIs below $25k, 0.8% for AGIs $25k-50k)
Percentage of individuals using paid preparers for their 2012 taxes: 51.8%
Here:
52%
State:
57%
(% for various income ranges: 48.8% for AGIs below $25k, 48.8% for AGIs $25k-50k, 50.6% for AGIs $50k-75k, 52.3% for AGIs $75k-100k, 54.8% for AGIs $100k-200k, 70.9% for AGIs over 200k)
Averages for the 2004 tax year for zip code 60202, filed in 2005:
Average Adjusted Gross Income (AGI) in 2004: $70,088 (Individual Income Tax Returns)
Here:
$70,088
State:
$54,625
Salary/wage: $56,403 (reported on 86.6% of returns)
Here:
$56,403
State:
$46,811
(% of AGI for various income ranges: 151.4% for AGIs below $10k, 79.3% for AGIs $10k-25k, 88.0% for AGIs $25k-50k, 83.5% for AGIs $50k-75k, 81.9% for AGIs $75k-100k, 58.2% for AGIs over 100k)
Taxable interest for individuals: $2,138 (reported on 51.4% of returns)
This zip code:
$2,138
Illinois:
$2,101
(% of AGI for various income ranges: 19.7% for AGIs below $10k, 2.0% for AGIs $10k-25k, 1.1% for AGIs $25k-50k, 1.1% for AGIs $50k-75k, 1.1% for AGIs $75k-100k, 1.6% for AGIs over 100k)
Taxable dividends: $6,113 (reported on 34.3% of returns)
Here:
$6,113
State:
$4,306
(% of AGI for various income ranges: 14.3% for AGIs below $10k, 2.3% for AGIs $10k-25k, 1.4% for AGIs $25k-50k, 1.6% for AGIs $50k-75k, 1.6% for AGIs $75k-100k, 3.9% for AGIs over 100k)
Net capital gain/loss: +$21,418 (reported on 26.6% of returns)
Here:
+$21,418
State:
+$17,321
(% of AGI for various income ranges: -5.2% for AGIs below $10k, 1.2% for AGIs $10k-25k, 0.6% for AGIs $25k-50k, 1.0% for AGIs $50k-75k, 1.4% for AGIs $75k-100k, 13.6% for AGIs over 100k)
Profit/loss from business: +$14,739 (reported on 19.7% of returns)
Here:
+$14,739
State:
+$11,771
(% of AGI for various income ranges: 11.4% for AGIs below $10k, 7.5% for AGIs $10k-25k, 3.3% for AGIs $25k-50k, 4.8% for AGIs $50k-75k, 4.3% for AGIs $75k-100k, 3.8% for AGIs over 100k)
IRA payment deduction: $2,729 (reported on 3.2% of returns)
60202:
$2,729
Illinois:
$3,087
(% of AGI for various income ranges: 0.7% for AGIs below $10k, 0.3% for AGIs $10k-25k, 0.3% for AGIs $25k-50k, 0.1% for AGIs $50k-75k, 0.1% for AGIs $75k-100k, 0.1% for AGIs over 100k)
Self-employed pension: $17,679 (reported on 2.5% of returns)
Here:
$17,679
Illinois:
$16,965
(% of AGI for various income ranges: 0.1% for AGIs $10k-25k, 0.1% for AGIs $25k-50k, 0.3% for AGIs $50k-75k, 0.3% for AGIs $75k-100k, 0.9% for AGIs over 100k)
Total itemized deductions: $22,093 (18% of AGI, reported on 44.4% of returns)
Here:
$22,093
State:
$20,239
Here:
18.2% of AGI
State:
19.5% of AGI
(% of AGI for various income ranges: 28.1% for AGIs below $10k, 13.8% for AGIs $10k-25k, 14.2% for AGIs $25k-50k, 17.1% for AGIs $50k-75k, 17.9% for AGIs $75k-100k, 12.3% for AGIs over 100k)
Charity contributions deductions: $4,488 (3% of AGI, reported on 38.9% of returns)
Here:
$4,488
State:
$3,719
Here:
3.4% of AGI
State:
3.4% of AGI
(% of AGI for various income ranges: 1.2% for AGIs below $10k, 1.2% for AGIs $10k-25k, 1.5% for AGIs $25k-50k, 2.1% for AGIs $50k-75k, 2.4% for AGIs $75k-100k, 2.9% for AGIs over 100k)
Total tax: $14,233 (reported on 79.6% of returns)
60202:
$14,233
State:
$9,882
(% of AGI for various income ranges: 6.8% for AGIs below $10k, 4.5% for AGIs $10k-25k, 7.9% for AGIs $25k-50k, 10.9% for AGIs $50k-75k, 12.0% for AGIs $75k-100k, 21.2% for AGIs over 100k)
Earned income credit: $1,668 (reported on 12.1% of returns)
Here:
$1,668
State:
$1,788
Percentage of individuals using paid preparers for their 2004 taxes: 54.7%
Here:
55%
State:
61%
(% for various income ranges: 52.4% for AGIs below $10k, 58.9% for AGIs $10k-25k, 51.4% for AGIs $25k-50k, 51.3% for AGIs $50k-75k, 51.8% for AGIs $75k-100k, 62.5% for AGIs over 100k)
Likely homosexual households (counted as self-reported same-sex unmarried-partner households)
Lesbian couples: 0.2% of all households
Gay men: 0.5% of all households
Household received Food Stamps/SNAP in the past 12 months: 1,023 Household did not receive Food Stamps/SNAP in the past 12 months: 13,006
Women who had a birth in the past 12 months: 415 (413 now married, 0 unmarried) Women who did not have a birth in the past 12 months: 8,168 (3,314 now married, 4,851 unmarried)
Housing units in zip code 60202 with a mortgage: 5,225 (481 second mortgage, 25 home equity loan, 425 both second mortgage and home equity loan) Houses without a mortgage: 50
Median monthly owner costs for units with a mortgage: $2,325 Median monthly owner costs for units without a mortgage: $1,015
Residents with income below the poverty level in 2022:
This zip code:
8.8%
Whole state:
11.9%
Residents with income below 50% of the poverty level in 2022:
This zip code:
4.5%
Whole state:
5.7%
Median number of rooms in houses and condos:
Here:
6.1
State:
6.4
Median number of rooms in apartments:
Here:
4.0
State:
4.1
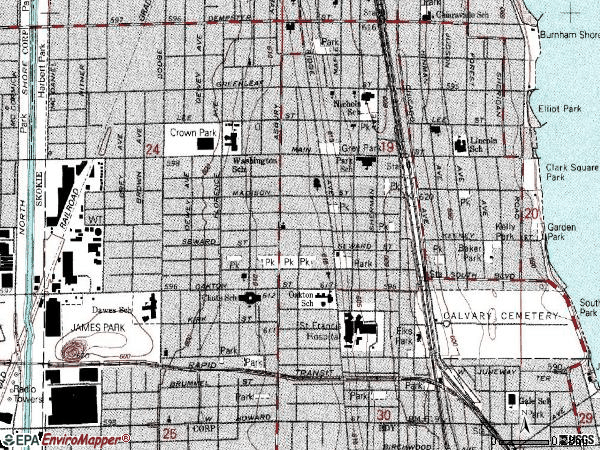
Notable locations in this zip code not listed on our city pages
Notable locations in zip code 60202: Carter House (A), Robert Crown Community Center (B), Bruce Gordon Memorial Library (C), Evanston Fire and Life Safety Services Station 2 (D), Evanston Fire and Life Safety Services Station 4 (E). Display/hide their locations on the map
Churches in zip code 60202 include: Christ Church of the North Shore (A), Shalom Center of the Assemblies of God (B), Fisher Memorial African Methodist Episcopal Zion Church (C), Mikdosh El Hebrew Center (D), Oakton Community Church (E), Saint Johns United Church of Christ (F), Saint Lukes Episcopal Church (G), Saint Nicholas Roman Catholic Church (H), Second Presbyterian Church (I). Display/hide their locations on the map
Parks in zip code 60202 include: Clyde-Brummel Park (1), Brummel Park (2), Dobson-Brummel Park (3), Leah Lomar Park (4), Levinson Tot-Lot (5), Southwest Park (6), Thomas E Snyder Park (7), Baker Park (8), Burnham Shores Park (9). Display/hide their locations on the map
4,066 married couples with children.
1,853 single-parent households (482 men, 1,371 women).
73.1% of residents of 60202 zip code speak English at home.
11.0% of residents speak Spanish at home (78% very well, 15% well, 5% not well, 2% not at all).
6.7% of residents speak other Indo-European language at home (79% very well, 17% well, 4% not well).
4.7% of residents speak Asian or Pacific Island language at home (76% very well, 18% well, 5% not well).
4.5% of residents speak other language at home (74% very well, 18% well, 9% not well).
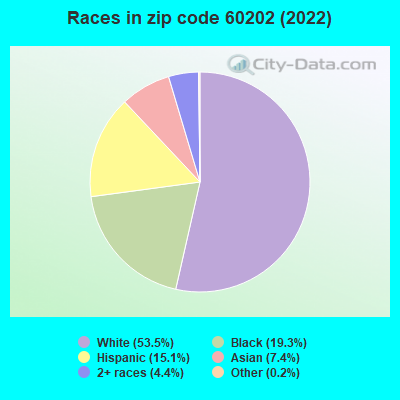
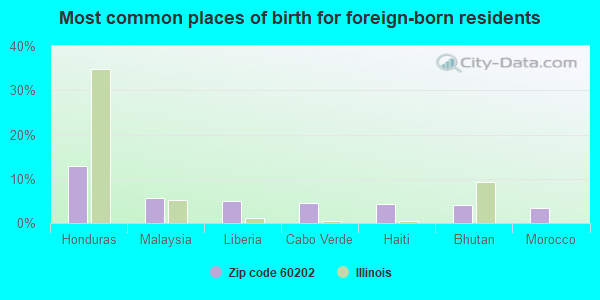
Foreign born population: 6,122 (18.3%) (45.2% of them are naturalized citizens)
Major facilities with environmental interests located in this zip code:
A SUBURBAN AUTO WRECKING CORP (640 PITNER in EVANSTON, IL)
STATE MASTER (Illinois EPA Project) - SOLID WASTE PROGRAM, HAZARDOUS WASTE PROGRAM STATE MASTER (Illinois EPA Project) - National Pollutant Discharge Elimination System Permit National Pollutant Discharge Elimination System NON-MAJOR (Tracking pollutant discharge elimination systems) - permit Large Quantity Generators, more that 1000 kg of hazardous waste/month (Resource Conservation and Recovery Act (tracking hazardous waste)) - notification Organizations: A-SUBURBAN AUTO WRECKING CORP (CONTACT/OWNER)
, GURTZ WILLIAM (CONTACT/OWNER)
PARK SPECIAL ED SCHOOL (828 MAIN ST in EVANSTON, IL)
(Geographic Names Information System) (National Center for Education Statistics) - STATE ID-1401606506101 (National Center for Education Statistics) - STATE ID-1401606503016 Organizations: EVANSTON DISTS 65/202 JNT AGR (SCHOOL DISTRICT)
, EVANSTON C C SCHOOL DIST 65 (SCHOOL DISTRICT)
CRUSH INTERNATIONAL INC (2201 MAIN ST in EVANSTON, IL)
STATE MASTER (Illinois EPA Project) - AIR PROGRAM, SOLID WASTE PROGRAM AIR MINOR (AIRS/AFS) Large Quantity Generators, more that 1000 kg of hazardous waste/month (Resource Conservation and Recovery Act (tracking hazardous waste)) - notification Business SIC classification: CUT STONE AND STONE PRODUCTS Organizations: CRUSH INTERNATIONAL USA INC (CONTACT/OWNER)
Alternative names: CRUSH INTERNATIONAL (USA INC)
DFG MERCURY CORP (909 PITNER AVE. in EVANSTON, IL)
STATE MASTER (Illinois EPA Project) - SOLID WASTE PROGRAM, HAZARDOUS WASTE PROGRAM, AIR PROGRAM AIR MINOR (AIRS/AFS) Conditionally Exempt Small Quantity Generators, less than 100 kg/month of hazardous waste (Resource Conservation and Recovery Act (tracking hazardous waste)) - notification TRANSPORTER (Resource Conservation and Recovery Act (tracking hazardous waste)) - notification TRI REPORTER (Tracking of toxic chemicals releasing facilities) Business SIC classification: JEWELRY, WATCHES, PRECIOUS STONES, AND PRECIOUS METALS Organizations: GOLDSMITH DL CHEMICAL AND METAL CORP (CONTACT/OWNER)
Alternative names: D F GOLDSMITH CHEMICAL & METAL CORPORATION
SAM S CLUB (2450 MAIN STREET in EVANSTON, IL)
STATE MASTER (Illinois EPA Project) - HAZARDOUS WASTE PROGRAM, SCRAP TIRE MANAGEMENT, AIR PROGRAM AIR MINOR (AIRS/AFS) Conditionally Exempt Small Quantity Generators, less than 100 kg/month of hazardous waste (Resource Conservation and Recovery Act (tracking hazardous waste)) - notification Business SIC classification: MISCELLANEOUS GENERAL MERCHANDISE STORES Organizations: WAL MART STORES INC (CONTACT/OWNER)
Alternative names: SAMS CLUB #6444
IRMCO-INTERNATIONAL REF & MFG CO (2117 GREENLEAF STREET in EVANSTON, IL)
STATE MASTER (Illinois EPA Project) - AIR PROGRAM AIR MINOR (AIRS/AFS) CRITERIA AND HAZARDOUS AIR POLLUTANT INVENTORY (Inventory of air pollution sources) TRI REPORTER (Tracking of toxic chemicals releasing facilities) Business SIC classification: CHEMICALS AND CHEMICAL PREPARATIONS
KIPP MFG CO (626 HARTREY AVENUE in EVANSTON, IL)
STATE MASTER (Illinois EPA Project) - AIR PROGRAM AIR MINOR (AIRS/AFS) Business SIC classification: AUTOMOTIVE STAMPINGS; MANUFACTURING INDUSTRIES
AMERICAN SCIENCE CENTER INC (601 LINDEN PLACE in EVANSTON, IL)
STATE MASTER (Illinois EPA Project) - AIR PROGRAM AIR MINOR (AIRS/AFS) Business SIC classification: GENERAL INDUSTRIAL MACHINERY AND EQUIPMENT
PICOMATIC (1011 PITNER in EVANSTON, IL)
STATE MASTER (Illinois EPA Project) - HAZARDOUS WASTE PROGRAM (Resource Conservation and Recovery Act (tracking hazardous waste)) Organizations: SANDERS MAX (CONTACT/OWNER)
APPETIZERS & INC (537 CUSTER in EVANSTON, IL)
STATE MASTER (Illinois EPA Project) - HAZARDOUS WASTE PROGRAM Large Quantity Generators, more that 1000 kg of hazardous waste/month (Resource Conservation and Recovery Act (tracking hazardous waste)) - notification Organizations: LUNDAHL RON (CONTACT/OWNER)
PHILIP LOCHMAN & CO (2405 OAKTON ST in EVANSTON, IL)
STATE MASTER (Illinois EPA Project) - AIR PROGRAM AIR MINOR (AIRS/AFS) CRITERIA AND HAZARDOUS AIR POLLUTANT INVENTORY (Inventory of air pollution sources) Business SIC classification: PHOTOGRAPHIC EQUIPMENT AND SUPPLIES
NORTH SHORE UNIFORM SERVICE INC (1818 DEMPSTER ST. in EVANSTON, IL)
STATE MASTER (Illinois EPA Project) - AIR PROGRAM, SOLID WASTE PROGRAM AIR MINOR (AIRS/AFS) Business SIC classification: DRYCLEANING PLANTS, EXCEPT RUG CLEANING
CLARK STORE 2099 (2401 DEMPSTER AVE. in EVANSTON, IL)
STATE MASTER (Illinois EPA Project) - AIR PROGRAM, SOLID WASTE PROGRAM AIR MINOR (AIRS/AFS) CRITERIA AND HAZARDOUS AIR POLLUTANT INVENTORY (Inventory of air pollution sources) Business SIC classification: PETROLEUM BULK STATIONS AND TERMINALS
Housing units lacking complete plumbing facilities: 0.4% Housing units lacking complete kitchen facilities: 1.1%
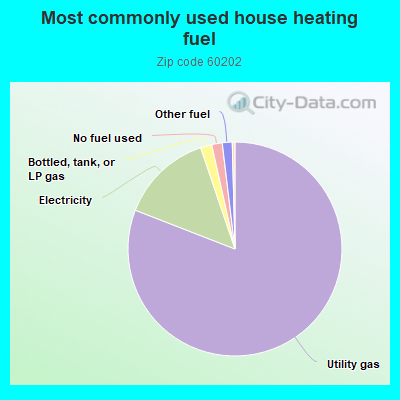
81.0%Utility gas
13.9%Electricity
1.7%Bottled, tank, or LP gas
1.6%No fuel used
1.5%Other fuel
Population in 1990: 31,509. Population change in the 1990s: +699 (+2.2%).
Place of birth for U.S.-born residents:
This state: 17,234
Northeast: 1,979
Midwest: 4,072
South: 1,894
West: 1,505
49% of the 60202 zip code residents lived in the same house 5 years ago. Out of people who lived in different houses, 73% lived in this county. Out of people who lived in different counties, 50% lived in Illinois.
83% of the 60202 zip code residents lived in the same house 1 year ago. Out of people who lived in different houses, 57% moved from this county. Out of people who lived in different houses, 2% moved from different county within same state. Out of people who lived in different houses, 24% moved from different state. Out of people who lived in different houses, 18% moved from abroad.
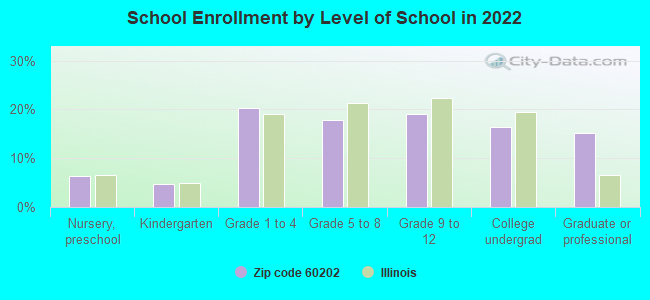
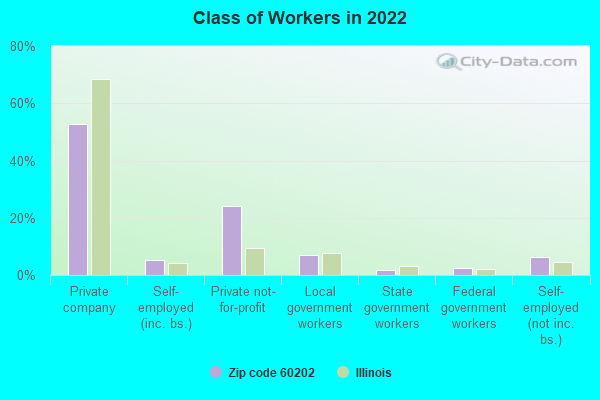
Private vs. public school enrollment:
Students in private schools in grades 1 to 8 (elementary and middle school): 664
Here:
21.5%
Illinois:
13.3%
Students in private schools in grades 9 to 12 (high school): 184
Here:
12.0%
Illinois:
9.9%
Students in private undergraduate colleges: 648
Here:
48.8%
Illinois:
27.4%
Occupation by median earnings in the past 12 months ($)
105,588Management occupations
92,423Architecture and engineering occupations
90,803Computer and mathematical occupations
87,076Legal occupations
80,064Health diagnosing and treating practitioners and other technical occupations
70,974Business and financial operations occupations
Companies with federal contracts located in this zip code (EVANSTON, IL):
C E NIEHOFF & CO (2021 LEE STREET; small business) : $131,497,403 in 273 contractsfrom 1999 to 2006
Contracts for Engine Electrical System Components, Nonaircraft, Generators and Generators Sets, Electrical, Miscellaneous Electric Power and Distribution Equipment, Electrical Control Equipment, and moreby Army, Defense Logistics Agency, Navy Signed by year:2000: $8,996,603; 2001: $9,057,174; 2002: $12,529,204; 2003: $16,800,238; 2004: $47,860,341; 2005: $25,437,430; 2006: $10,301,197.
Biggest contracts:
$8,617,455 with Army for Engine Electrical System Components, Nonaircraft. Signed on 2004-03-22. Completion date: 2007-04-30.
$6,155,325, same as above.Signed on 2004-03-31. Completion date: 2007-04-30.
$5,471,400, same as above.Signed on 2004-11-08. Completion date: 2007-04-30.
$5,051,470, same as above.Signed on 2004-06-02. Completion date: 2007-04-30.
HINMAN GROUP INC, THE (1732 DOBSON ST; small business)
$35,745,150 with Defense Logistics Agency for Liquid Propellants and Fuels, Petroleum Base. Taking place in LA. Signed on 2006-03-23. Completion date: 2007-04-30.
DEL MAR/ ENVIROPLUS JOINT VENT (600 HARTREY AVE; small business)
$506,200 with Navy for Maintenance, Repair or Alteration of Real Property -- Other Administrative Facilities and Service Buildings. Taking place in WI. Signed on 2005-09-29. Completion date: 2006-05-28.
ARENS CONTROLS COMPANY LLC DEL (2017 GREENLEAF ST; small business) : $203,091 in 6 contractsfrom 2001 to 2003
Contracts for Miscellaneous Aircraft Accessories and Components, Miscellaneous Engine Accessories, Nonaircraft by Defense Logistics Agency Signed by year:2000: $0; 2001: $37,637; 2002: $110,338; 2003: $55,116; 2004: $0; 2005: $0; 2006: $0.
Biggest contracts:
$75,132 with Defense Logistics Agency for Miscellaneous Aircraft Accessories and Components. Signed on 2002-07-22. Completion date: 2002-10-30.
$55,116, same as above.Signed on 2003-11-10. Completion date: 2004-02-02.
$37,637, same as above.Signed on 2001-11-13. Completion date: 2002-02-21.
$35,206, same as above.Signed on 2002-08-06. Completion date: 2002-11-04.
PETER J KIM (515; small business) : $35,732 in 5 contractsfrom 2000 to 2004
Contracts for Dentistry Services by Navy Signed by year:2000: $152,294; 2001: $0; 2002: -$82,184; 2003: $0; 2004: -$34,378; 2005: $0; 2006: $0.
Biggest contracts:
$77,126 with Navy for Dentistry Services. Signed on 2000-10-01. Completion date: 2004-09-30.
$75,168, same as above.Signed on 2000-02-16. Completion date: 2000-09-30.
$0, same as above.Signed on 2000-02-16. Completion date: 2000-09-30.
-$34,378, same as above.Signed on 2004-04-16. Completion date: 2004-09-30.
TURF CARE LANDSCAPING INC. (942 PITNER AVENUE, SUITE A; small business)
$35,273 with Navy for Snow Removal/Salt Service (also spreading aggregate or other snow melting material). Signed on 2000-01-27. Completion date: 2000-01-28.
STERLING PRECISIONS OPTICS, IN (1916 GREENLEAF ST; small business) : $7,722 in 2 contractsfrom 2004 to 2005
$4,720 with Army for Household Furniture. Signed on 2004-02-17. Completion date: 2004-03-31.
$3,002, same as above.Signed on 2005-01-24. Completion date: 2005-04-30.
MEASUREMENT EQUIPMENT CORP (1113 HULL TER; small business)
$5,687 with Army for Miscellaneous Office Machines. Signed on 2002-03-29. Completion date: 2002-04-19.
Top industries in this zip code by the number of employees in 2005:
Health Care and Social Assistance: General Medical and Surgical Hospitals (over 1000 employees: 1 establishment)
Health Care and Social Assistance: Residential Mental Health and Substance Abuse Facilities (250-499: 1)
Health Care and Social Assistance: Offices of Physicians (except Mental Health Specialists) (20-49: 2, 10-19: 3, 5-9: 13, 1-4: 35)
Other Services (except Public Administration): Religious Organizations (50-99: 2, 20-49: 1, 10-19: 1, 5-9: 1, 1-4: 8)
Administrative and Support and Waste Management and Remediation Services: Professional Employer Organizations (50-99: 2, 20-49: 2)
Management of Companies and Enterprises: Corporate, Subsidiary, and Regional Managing Offices (100-249: 1, 10-19: 2, 1-4: 1)
People in group quarters in 2010:
567 people in nursing facilities/skilled-nursing facilities
72 people in other noninstitutional facilities
45 people in residential treatment centers for juveniles (non-correctional)
25 people in group homes intended for adults
People in group quarters in 2000:
386 people in other nonhousehold living situations
146 people in nursing homes
79 people in other noninstitutional group quarters
28 people in homes for the mentally retarded
16 people in homes for the mentally ill
2 people in religious group quarters
Fatal accident statistics in 2014:
Fatal accident count: 1
Vehicles involved in fatal accidents: 1
Fatal accidents caused by drunken drivers: 1
Fatalities: 1
Persons involved in fatal accidents: 1
Pedestrians involved in fatal accidents: 0
Fatal accident statistics in 2013:
Fatal accident count: 1
Vehicles involved in fatal accidents: 1
Fatal accidents caused by drunken drivers: 1
Fatalities: 1
Persons involved in fatal accidents: 6
Pedestrians involved in fatal accidents: 0
Home Mortgage Disclosure Act Aggregated Statistics For Year 2009 (Based on 12 full tracts)
A) FHA, FSA/RHS & VA Home Purchase Loans
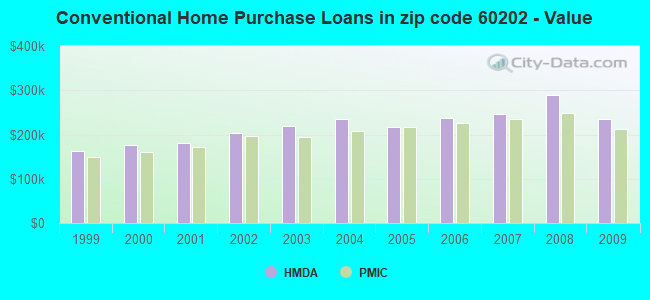
B) Conventional Home Purchase Loans
C) Refinancings
D) Home Improvement Loans
E) Loans on Dwellings For 5+ Families
F) Non-occupant Loans on < 5 Family Dwellings (A B C & D)
G) Loans On Manufactured Home Dwelling (A B C & D)
Number
Average Value
Number
Average Value
Number
Average Value
Number
Average Value
Number
Average Value
Number
Average Value
Number
Average Value
LOANS ORIGINATED
72
$244,062
341
$235,287
1,297
$267,336
26
$81,705
11
$1,587,422
67
$264,947
3
$205,530
APPLICATIONS APPROVED, NOT ACCEPTED
4
$262,800
22
$401,936
116
$275,388
4
$121,140
0
$0
2
$129,500
0
$0
APPLICATIONS DENIED
18
$214,436
44
$302,457
350
$268,463
25
$79,563
0
$0
24
$276,739
0
$0
APPLICATIONS WITHDRAWN
6
$134,028
20
$254,884
149
$239,515
4
$50,500
0
$0
12
$222,197
0
$0
FILES CLOSED FOR INCOMPLETENESS
1
$183,000
8
$248,596
72
$298,301
3
$239,417
0
$0
4
$238,628
0
$0
Aggregated Statistics For Year 2008 (Based on 12 full tracts)
A) FHA, FSA/RHS & VA Home Purchase Loans
B) Conventional Home Purchase Loans
C) Refinancings
D) Home Improvement Loans
E) Loans on Dwellings For 5+ Families
F) Non-occupant Loans on < 5 Family Dwellings (A B C & D)
G) Loans On Manufactured Home Dwelling (A B C & D)
Number
Average Value
Number
Average Value
Number
Average Value
Number
Average Value
Number
Average Value
Number
Average Value
Number
Average Value
LOANS ORIGINATED
30
$228,555
394
$290,262
849
$267,827
54
$107,348
39
$1,420,246
70
$278,233
0
$0
APPLICATIONS APPROVED, NOT ACCEPTED
11
$251,421
27
$280,667
111
$232,315
5
$87,118
0
$0
26
$197,347
0
$0
APPLICATIONS DENIED
12
$194,189
84
$236,211
344
$266,277
43
$82,292
0
$0
26
$188,015
1
$69,000
APPLICATIONS WITHDRAWN
9
$310,607
33
$415,538
137
$248,250
7
$136,363
0
$0
18
$257,232
0
$0
FILES CLOSED FOR INCOMPLETENESS
3
$203,920
13
$272,932
66
$251,245
0
$0
0
$0
7
$219,274
0
$0
Aggregated Statistics For Year 2007 (Based on 12 full tracts)
A) FHA, FSA/RHS & VA Home Purchase Loans
B) Conventional Home Purchase Loans
C) Refinancings
D) Home Improvement Loans
E) Loans on Dwellings For 5+ Families
F) Non-occupant Loans on < 5 Family Dwellings (A B C & D)
G) Loans On Manufactured Home Dwelling (A B C & D)
Number
Average Value
Number
Average Value
Number
Average Value
Number
Average Value
Number
Average Value
Number
Average Value
Number
Average Value
LOANS ORIGINATED
3
$275,787
716
$245,542
983
$256,649
72
$169,458
38
$2,202,855
176
$306,606
0
$0
APPLICATIONS APPROVED, NOT ACCEPTED
0
$0
83
$228,623
152
$227,489
37
$102,083
2
$1,705,725
21
$207,737
2
$100,985
APPLICATIONS DENIED
0
$0
123
$247,084
541
$251,614
59
$107,742
3
$674,460
67
$247,975
0
$0
APPLICATIONS WITHDRAWN
0
$0
70
$238,709
177
$258,187
10
$222,782
1
$50,000
12
$260,400
0
$0
FILES CLOSED FOR INCOMPLETENESS
0
$0
19
$194,534
87
$287,030
5
$183,792
0
$0
9
$183,539
0
$0
Aggregated Statistics For Year 2006 (Based on 12 full tracts)
A) FHA, FSA/RHS & VA Home Purchase Loans
B) Conventional Home Purchase Loans
C) Refinancings
D) Home Improvement Loans
E) Loans on Dwellings For 5+ Families
F) Non-occupant Loans on < 5 Family Dwellings (A B C & D)
G) Loans On Manufactured Home Dwelling (A B C & D)
Number
Average Value
Number
Average Value
Number
Average Value
Number
Average Value
Number
Average Value
Number
Average Value
Number
Average Value
LOANS ORIGINATED
3
$254,113
1,078
$236,864
1,111
$249,479
104
$143,986
44
$1,307,798
159
$273,480
0
$0
APPLICATIONS APPROVED, NOT ACCEPTED
0
$0
149
$198,279
183
$237,571
20
$77,226
3
$315,667
22
$225,023
2
$125,285
APPLICATIONS DENIED
1
$224,000
255
$233,820
545
$247,410
80
$115,249
0
$0
70
$249,101
0
$0
APPLICATIONS WITHDRAWN
2
$243,185
126
$226,802
270
$235,869
14
$248,709
1
$105,000
14
$208,148
0
$0
FILES CLOSED FOR INCOMPLETENESS
2
$166,755
45
$259,798
91
$219,564
1
$100,000
0
$0
5
$342,888
0
$0
Aggregated Statistics For Year 2005 (Based on 12 full tracts)
A) FHA, FSA/RHS & VA Home Purchase Loans
B) Conventional Home Purchase Loans
C) Refinancings
D) Home Improvement Loans
E) Loans on Dwellings For 5+ Families
F) Non-occupant Loans on < 5 Family Dwellings (A B C & D)
G) Loans On Manufactured Home Dwelling (A B C & D)
Number
Average Value
Number
Average Value
Number
Average Value
Number
Average Value
Number
Average Value
Number
Average Value
Number
Average Value
LOANS ORIGINATED
1
$266,000
1,464
$217,625
1,354
$236,809
73
$175,423
36
$817,104
239
$229,788
8
$69,171
APPLICATIONS APPROVED, NOT ACCEPTED
2
$223,130
187
$202,919
206
$196,446
14
$52,939
0
$0
29
$215,064
0
$0
APPLICATIONS DENIED
0
$0
278
$201,453
475
$208,020
76
$65,805
3
$451,617
65
$195,370
0
$0
APPLICATIONS WITHDRAWN
1
$236,000
159
$208,649
371
$231,085
25
$208,662
3
$732,203
24
$220,817
0
$0
FILES CLOSED FOR INCOMPLETENESS
4
$173,520
84
$204,823
83
$202,679
2
$194,200
0
$0
12
$187,891
0
$0
Aggregated Statistics For Year 2004 (Based on 12 full tracts)
A) FHA, FSA/RHS & VA Home Purchase Loans
B) Conventional Home Purchase Loans
C) Refinancings
D) Home Improvement Loans
E) Loans on Dwellings For 5+ Families
F) Non-occupant Loans on < 5 Family Dwellings (A B C & D)
G) Loans On Manufactured Home Dwelling (A B C & D)
Number
Average Value
Number
Average Value
Number
Average Value
Number
Average Value
Number
Average Value
Number
Average Value
Number
Average Value
LOANS ORIGINATED
10
$188,564
1,214
$235,525
1,578
$224,917
101
$107,911
41
$827,475
182
$259,974
11
$50,918
APPLICATIONS APPROVED, NOT ACCEPTED
0
$0
121
$254,432
250
$204,878
31
$68,793
1
$411,000
29
$259,579
0
$0
APPLICATIONS DENIED
5
$207,542
168
$217,264
511
$208,646
74
$82,701
2
$341,600
57
$263,371
6
$62,147
APPLICATIONS WITHDRAWN
3
$151,667
97
$255,915
295
$231,132
14
$154,566
3
$902,137
27
$216,974
0
$0
FILES CLOSED FOR INCOMPLETENESS
4
$117,020
23
$252,857
114
$257,184
8
$171,110
0
$0
13
$250,197
0
$0
Aggregated Statistics For Year 2003 (Based on 12 full tracts)
A) FHA, FSA/RHS & VA Home Purchase Loans
B) Conventional Home Purchase Loans
C) Refinancings
D) Home Improvement Loans
E) Loans on Dwellings For 5+ Families
F) Non-occupant Loans on < 5 Family Dwellings (A B C & D)
Number
Average Value
Number
Average Value
Number
Average Value
Number
Average Value
Number
Average Value
Number
Average Value
LOANS ORIGINATED
11
$210,754
1,276
$218,113
3,656
$209,542
62
$73,472
72
$1,338,449
242
$203,445
APPLICATIONS APPROVED, NOT ACCEPTED
2
$222,140
96
$191,857
344
$205,108
23
$40,534
3
$775,247
20
$187,794
APPLICATIONS DENIED
7
$196,897
147
$206,649
743
$196,720
52
$32,832
9
$1,262,618
49
$202,820
APPLICATIONS WITHDRAWN
4
$177,750
88
$174,365
389
$196,225
3
$50,000
2
$297,510
23
$185,540
FILES CLOSED FOR INCOMPLETENESS
0
$0
31
$179,852
111
$225,928
4
$25,610
0
$0
3
$154,203
Aggregated Statistics For Year 2002 (Based on 12 full tracts)
A) FHA, FSA/RHS & VA Home Purchase Loans
B) Conventional Home Purchase Loans
C) Refinancings
D) Home Improvement Loans
E) Loans on Dwellings For 5+ Families
F) Non-occupant Loans on < 5 Family Dwellings (A B C & D)
Number
Average Value
Number
Average Value
Number
Average Value
Number
Average Value
Number
Average Value
Number
Average Value
LOANS ORIGINATED
22
$171,292
1,166
$204,370
2,501
$206,672
51
$62,998
40
$733,018
149
$203,663
APPLICATIONS APPROVED, NOT ACCEPTED
0
$0
115
$206,171
295
$176,673
25
$41,750
6
$456,297
18
$160,715
APPLICATIONS DENIED
7
$186,306
91
$194,042
344
$163,515
55
$35,256
4
$365,262
45
$159,300
APPLICATIONS WITHDRAWN
3
$153,387
68
$159,520
201
$182,825
3
$98,667
2
$875,000
14
$163,314
FILES CLOSED FOR INCOMPLETENESS
1
$122,000
40
$217,441
248
$193,016
0
$0
0
$0
3
$179,043
Aggregated Statistics For Year 2001 (Based on 12 full tracts)
A) FHA, FSA/RHS & VA Home Purchase Loans
B) Conventional Home Purchase Loans
C) Refinancings
D) Home Improvement Loans
E) Loans on Dwellings For 5+ Families
F) Non-occupant Loans on < 5 Family Dwellings (A B C & D)
Number
Average Value
Number
Average Value
Number
Average Value
Number
Average Value
Number
Average Value
Number
Average Value
LOANS ORIGINATED
30
$178,294
1,090
$180,659
1,802
$193,461
110
$242,215
30
$643,800
134
$169,392
APPLICATIONS APPROVED, NOT ACCEPTED
2
$255,465
68
$201,901
198
$157,636
25
$30,790
6
$533,490
2
$70,410
APPLICATIONS DENIED
12
$161,305
116
$149,831
405
$144,244
79
$43,301
0
$0
28
$147,760
APPLICATIONS WITHDRAWN
6
$200,453
42
$250,888
213
$147,973
20
$92,718
1
$150,000
8
$154,034
FILES CLOSED FOR INCOMPLETENESS
1
$126,000
32
$266,561
100
$168,810
6
$32,405
0
$0
13
$181,873
Aggregated Statistics For Year 2000 (Based on 12 full tracts)
A) FHA, FSA/RHS & VA Home Purchase Loans
B) Conventional Home Purchase Loans
C) Refinancings
D) Home Improvement Loans
E) Loans on Dwellings For 5+ Families
F) Non-occupant Loans on < 5 Family Dwellings (A B C & D)
Number
Average Value
Number
Average Value
Number
Average Value
Number
Average Value
Number
Average Value
Number
Average Value
LOANS ORIGINATED
41
$164,507
927
$176,268
505
$161,958
100
$59,626
28
$704,414
54
$143,642
APPLICATIONS APPROVED, NOT ACCEPTED
0
$0
74
$164,731
135
$121,795
27
$28,563
0
$0
14
$60,238
APPLICATIONS DENIED
7
$133,630
118
$167,237
277
$119,108
84
$34,850
2
$468,080
28
$117,618
APPLICATIONS WITHDRAWN
1
$86,000
79
$191,927
145
$111,612
26
$47,400
0
$0
9
$192,724
FILES CLOSED FOR INCOMPLETENESS
0
$0
35
$141,276
79
$131,054
1
$22,000
0
$0
3
$113,613
Aggregated Statistics For Year 1999 (Based on 7 full and 1 partial tracts)
A) FHA, FSA/RHS & VA Home Purchase Loans
B) Conventional Home Purchase Loans
C) Refinancings
D) Home Improvement Loans
E) Loans on Dwellings For 5+ Families
F) Non-occupant Loans on < 5 Family Dwellings (A B C & D)
2002 - 2018 National Fire Incident Reporting System (NFIRS) incidents
According to the data from the years 2002 - 2018 the average number of fires per year is 64. The highest number of fires - 95 took place in 2006, and the least - 23 in 2004. The data has a decreasing trend.
When looking into fire subcategories, the most reports belonged to: Structure Fires (45.1%), and Outside Fires (33.4%).
Fire incident types reported to NFIRS in Zip Code 60202


 Nearest zip codes: 60645, 60201, 60626, 60203, 60659, 60076.


 According to the data from the years 2002 - 2018 the average number of fires per year is 64. The highest number of fires - 95 took place in 2006, and the least - 23 in 2004. The data has a decreasing trend.
 When looking into fire subcategories, the most reports belonged to: Structure Fires (45.1%), and Outside Fires (33.4%).