Alpine: Fire Incidents, California (CA)
Where are fire incidents reported in Alpine, CA
Something went wrong! Please refresh the page.
|
| |||||||||||||||||||||||||||||||||||||||||||||||||||||||||||||||||||||||||||||||||||||||||||||||||||||||||||||
2005 - 2018 National Fire Incident Reporting System (NFIRS) incidents
- Incident types reported to NFIRS in Alpine, CA
- 3,51655.0%Rescue & EMS
- 1,12717.6%Good Intent Call
- 69510.9%Fire
- 6319.9%Service Call
- 2483.9%Hazardous Condition
- 1532.4%False Alarm
- 110.2%Special Incident
- Fire incident types reported to NFIRS in Alpine, CA
- 27139.0%Outside Fires
- 26738.4%Structure Fires
- 12918.6%Mobile Property/Vehicle Fires
- 284.0%Other
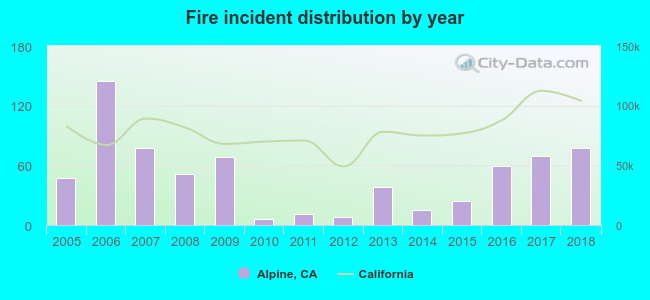 According to the data from the years 2005 - 2018 the average number of fires per year is 50. The highest number of reported fire incidents - 145 took place in 2006, and the least - 6 in 2010. The data has a growing trend.
The average number of yearly fire incidents per 10k residents in Alpine, CA compared to nearest cities:
(Note: Based on data for the last 3 years, including only cities with population 5,000 and above)
| Alpine: | 48.0 |
| Lakeside: | 55.2 |
| Jamul: | 33.0 |
| El Cajon: | 14.4 |
| Santee: | 16.9 |
| Spring Valley: | 11.8 |
| Ramona: | 24.5 |
| La Mesa: | 6.2 |
| Lemon Grove: | 8.2 |
 The median response time based on all reported fire incidents is 9 minutes. This is higher compared to the California median value.
The median response time in Alpine, CA compared to nearest cities:
(Note: Based on data for all years, including only cities with at least 500 fire incidents)
| Alpine: | 9 minutes |
| Lakeside: | 8 minutes |
| El Cajon: | 6 minutes |
| Santee: | 7 minutes |
| Ramona: | 5 minutes |
| La Mesa: | 6 minutes |
| Chula Vista: | 6 minutes |
| National City: | 6 minutes |
| San Diego: | 6 minutes |
 39.3% incidents where reported in the morning and 60.7% in the evening. The most fires (19.9%) took place on Friday, and the least (12.4%) on Wednesday.
 Based on the 695 fires from years 2005 - 2018 most fires (13.2%) took place during July, and the least (3.3%) in March.
 Out of all 6,387 cases reported during the years 2005 - 2018, the most belonged to the categories: Rescue & EMS (55.0%), Good Intent Call (17.6%), and Fire (10.9%).
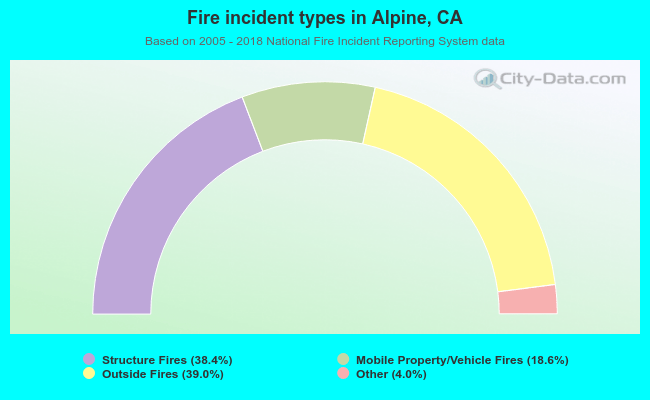 When looking into fire subcategories, the most incidents belonged to: Outside Fires (39.0%), and Structure Fires (38.4%).