Bellwood: Fire Incidents, Illinois (IL)
Where are fire incidents reported in Bellwood, IL
Something went wrong! Please refresh the page.
| Fire incidents reported | |
|---|---|
| Sreet name | Count |
| 25TH | 184 |
| BELLWOOD | 118 |
| 22ND | 108 |
| 23RD | 108 |
| ST CHARLES RD | 102 |
| ST. CHARLES RD | 102 |
| 24TH | 98 |
| RICE | 86 |
| LINDEN | 84 |
| WARREN | 84 |
| MANNHEIM | 82 |
| 25TH AVE | 70 |
| BOHLAND | 68 |
| 47TH | 60 |
| EASTERN | 60 |
| ENGLEWOOD | 58 |
| 50TH | 50 |
| ADAMS | 50 |
| ST CHARLES | 50 |
| 22ND AVE | 48 |
| BUTTERFIELD | 48 |
| 23RD AVE | 46 |
| WILCOX | 46 |
| GENEVA | 44 |
| MADISON | 42 |
| HYDE PARK | 40 |
| JACKSON | 40 |
| WASHINGTON BLVD | 40 |
| MONROE | 36 |
| 48TH | 34 |
2002 - 2018 National Fire Incident Reporting System (NFIRS) incidents
- Incident types reported to NFIRS in Bellwood, IL
- 14,39663.0%Rescue & EMS
- 2,0649.0%Hazardous Condition
- 1,9478.5%False Alarm
- 1,7687.7%Fire
- 1,3455.9%Service Call
- 1,2795.6%Good Intent Call
- 270.1%Special Incident
- Fire incident types reported to NFIRS in Bellwood, IL
- 1,09061.7%Structure Fires
- 27815.7%Outside Fires
- 22112.5%Mobile Property/Vehicle Fires
- 17910.1%Other
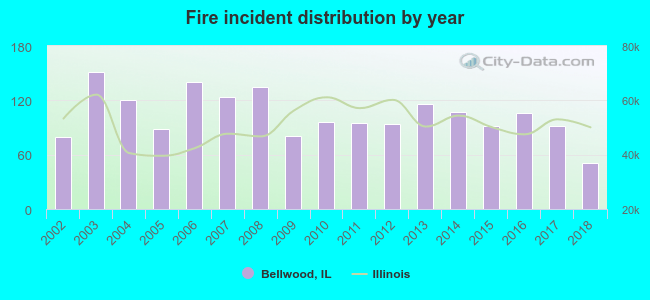 Based on the data from the years 2002 - 2018 the average number of fires per year is 104. The highest number of fire incidents - 151 took place in 2003, and the least - 51 in 2018. The data has a dropping trend.
The average number of yearly fire incidents per 10k residents in Bellwood, IL compared to nearest cities:
(Note: Based on data for the last 3 years, including only cities with population 5,000 and above)
| Bellwood: | 43.3 |
| Hillside: | 67.1 |
| Melrose Park: | 35.1 |
| Maywood: | 58.8 |
| Berkeley: | 82.2 |
| Broadview: | 57.0 |
| Westchester: | 37.1 |
| Northlake: | 33.7 |
| River Forest: | 50.6 |
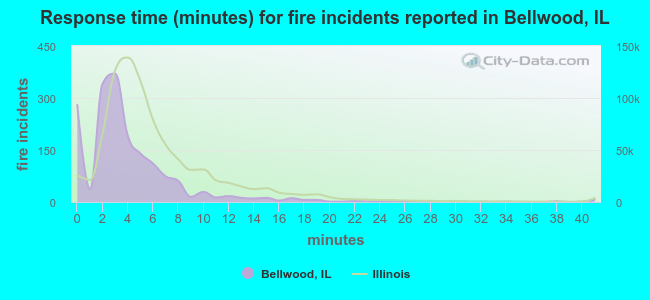 The median response time based on all reported fire incidents is 3 minutes. This is lower compared to the Illinois median value.
The median response time in Bellwood, IL compared to nearest cities:
(Note: Based on data for all years, including only cities with at least 500 fire incidents)
| Bellwood: | 3 minutes |
| Hillside: | 4 minutes |
| Melrose Park: | 4 minutes |
| Maywood: | 3 minutes |
| Berkeley: | 4 minutes |
| Broadview: | 3 minutes |
| Westchester: | 4 minutes |
| Northlake: | 5 minutes |
| River Forest: | 6 minutes |
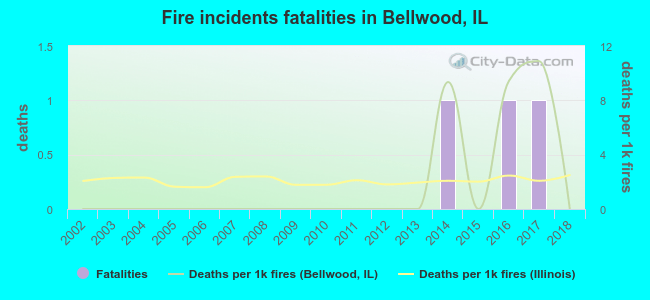 According to the reports from the years 2002 - 2018 the average number of fire-related yearly deaths is 0. The highest number of reported deaths - 1 took place in 2014, and the lowest - 0 in 2002. The data has a constant trend.
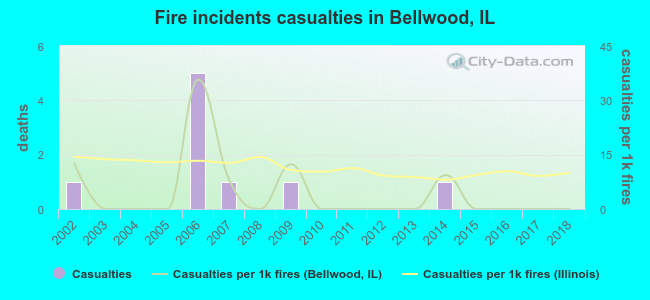 Based on the reports from the years 2002 - 2018 the average number of fire-related yearly casualties is 1. The highest number of reported injuries - 5 took place in 2006, and the lowest - 0 in 2003. The data has a declining trend.
The average number of injuries per 1,000 fire incidents is 5. This indicator was the highest - 36 in 2006, and the lowest 0 in 2003. The trend for casualties per 1,000 fires is decreasing. Compared to the state value the number of casualties per 1,000 incidents is much lower.
Based on the reports from the years 2002 - 2018 the average number of fire-related yearly casualties is 1. The highest number of reported injuries - 5 took place in 2006, and the lowest - 0 in 2003. The data has a declining trend.
The average number of injuries per 1,000 fire incidents is 5. This indicator was the highest - 36 in 2006, and the lowest 0 in 2003. The trend for casualties per 1,000 fires is decreasing. Compared to the state value the number of casualties per 1,000 incidents is much lower.Casualties per 1,000 incidents in Bellwood, IL compared to nearest cities:
(Note: Based on data for all years, including only cities with at least 500 fire incidents)
| Bellwood: | 5.1 |
| Hillside: | 17.0 |
| Melrose Park: | 12.3 |
| Maywood: | 6.1 |
| Berkeley: | 7.5 |
| Broadview: | 17.9 |
| Westchester: | 15.6 |
| Northlake: | 4.7 |
| River Forest: | 5.5 |
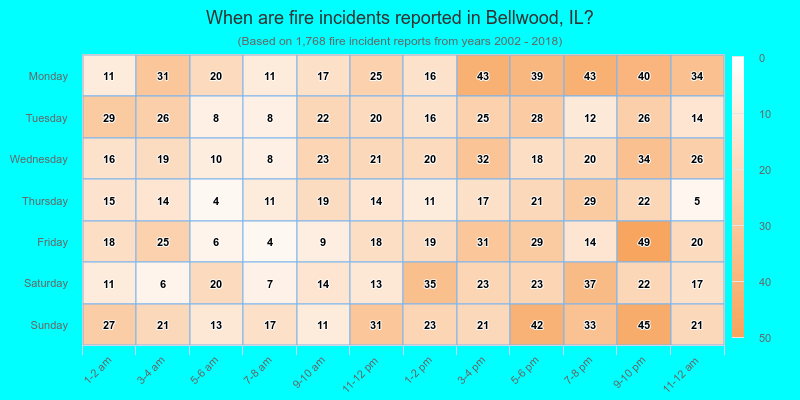
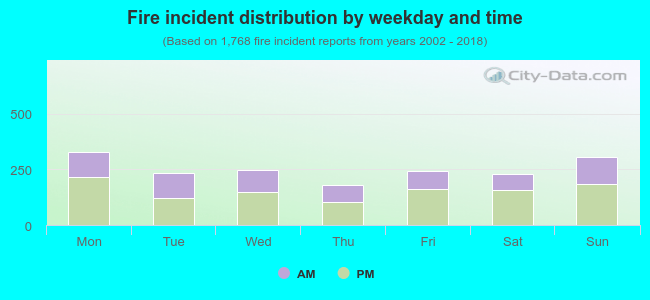 38.1% incidents where reported in the morning and 61.9% in the evening. The most fires (18.7%) took place on Monday, and the least (10.3%) on Thursday.
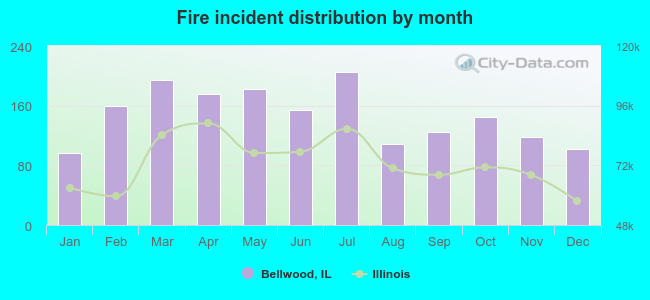 Based on the 1,768 incident reports from years 2002 - 2018 most fires (11.6%) took place during July, and the least (5.5%) in January.
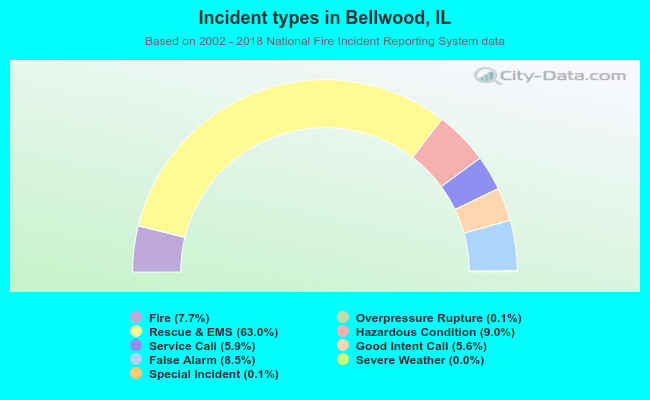 Out of all 22,850 cases reported during the years 2002 - 2018, the most belonged to the categories: Rescue & EMS (63.0%), Hazardous Condition (9.0%), and False Alarm (8.5%).
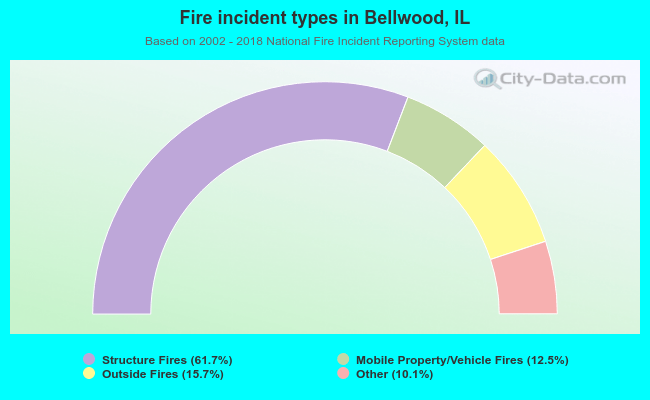 When looking into fire subcategories, the most reports belonged to: Structure Fires (61.7%), and Outside Fires (15.7%).