Westchester: Fire Incidents, Illinois (IL)
Where are fire incidents reported in Westchester, IL
Something went wrong! Please refresh the page.
| Fire incidents reported | |
|---|---|
| Sreet name | Count |
| MANNHEIM RD | 74 |
| ROOSEVELT RD | 72 |
| CERMAK RD | 56 |
| WESTCHESTER BLVD | 38 |
| MANCHESTER | 36 |
| WOLF RD | 36 |
| MANCHESTER AVE | 34 |
| GARDNER RD | 32 |
| MAYFAIR AVE | 32 |
| DOWNING AVE | 30 |
| SUFFOLK AVE | 30 |
| SUNNYSIDE AVE | 30 |
| BALMORAL AVE | 28 |
| HULL AVE | 28 |
| KENSINGTON AVE | 28 |
| PORTSMOUTH AVE | 28 |
| DOWNING | 26 |
| I-290 EAST BOUND | 24 |
| BOEGER AVE | 22 |
| BRISTOL AVE | 22 |
| CANTERBURY ST | 22 |
| HEIDORN AVE | 22 |
| WORCESTER AVE | 22 |
| 31ST ST | 20 |
| KENSINGTON | 20 |
| STRATFORD AVE | 18 |
| HAWTHORNE | 16 |
| NEWCASTLE AVE | 16 |
| NORFOLK AVE | 16 |
| HAWTHORNE AVE | 14 |
2002 - 2018 National Fire Incident Reporting System (NFIRS) incidents
- Incident types reported to NFIRS in Westchester, IL
- 11,00263.5%Rescue & EMS
- 2,36913.7%False Alarm
- 1,3517.8%Hazardous Condition
- 1,1676.7%Good Intent Call
- 8354.8%Fire
- 5693.3%Service Call
- Fire incident types reported to NFIRS in Westchester, IL
- 49859.6%Structure Fires
- 16119.3%Outside Fires
- 9811.7%Mobile Property/Vehicle Fires
- 789.3%Other
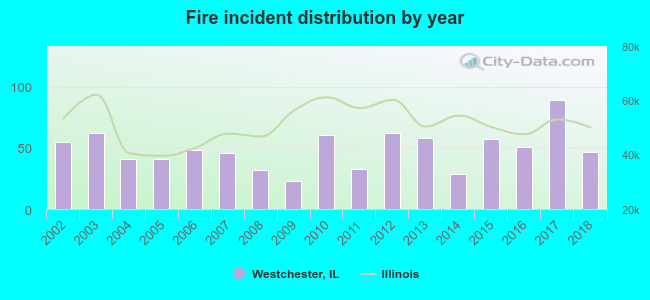 Based on the data from the years 2002 - 2018 the average number of fire incidents per year is 49. The highest number of fire incidents - 89 took place in 2017, and the least - 23 in 2009. The data has a dropping trend.
The average number of yearly fire incidents per 10k residents in Westchester, IL compared to nearest cities:
(Note: Based on data for the last 3 years, including only cities with population 5,000 and above)
| Westchester: | 37.1 |
| Broadview: | 57.0 |
| Hillside: | 67.1 |
| La Grange Park: | 15.4 |
| Bellwood: | 43.3 |
| Berkeley: | 82.2 |
| Maywood: | 58.8 |
| North Riverside: | 31.4 |
| Brookfield: | 36.6 |
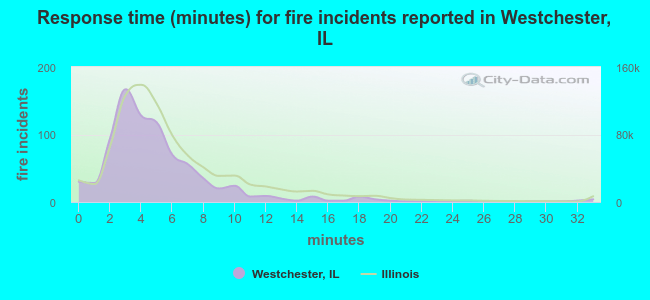 The median response time based on all reported fire incidents is 4 minutes. This is lower compared to the state median value.
The median response time in Westchester, IL compared to nearest cities:
(Note: Based on data for all years, including only cities with at least 500 fire incidents)
| Westchester: | 4 minutes |
| Broadview: | 3 minutes |
| Hillside: | 4 minutes |
| Bellwood: | 3 minutes |
| Berkeley: | 4 minutes |
| Maywood: | 3 minutes |
| Brookfield: | 5 minutes |
| Melrose Park: | 4 minutes |
| Oak Brook: | 5 minutes |
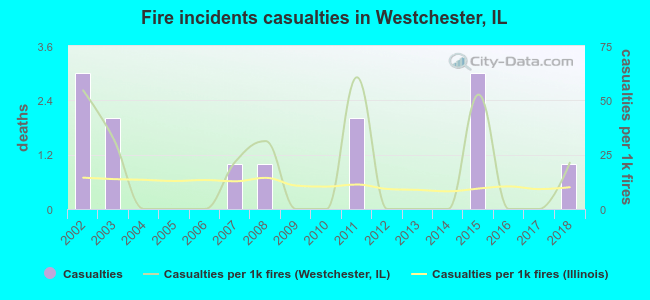 Based on the data from the years 2002 - 2018 the average number of fire-related yearly casualties is 1. The highest number of injuries - 3 took place in 2002, and the lowest - 0 in 2004. The data has a dropping trend.
The average number of injuries per 1,000 fires is 16. This indicator was the highest - 61 in 2011, and the lowest 0 in 2004. The trend for casualties per 1,000 incidents is decreasing. Compared to the state value the number of casualties per 1,000 incidents is higher.
Based on the data from the years 2002 - 2018 the average number of fire-related yearly casualties is 1. The highest number of injuries - 3 took place in 2002, and the lowest - 0 in 2004. The data has a dropping trend.
The average number of injuries per 1,000 fires is 16. This indicator was the highest - 61 in 2011, and the lowest 0 in 2004. The trend for casualties per 1,000 incidents is decreasing. Compared to the state value the number of casualties per 1,000 incidents is higher.Casualties per 1,000 incidents in Westchester, IL compared to nearest cities:
(Note: Based on data for all years, including only cities with at least 500 fire incidents)
| Westchester: | 15.6 |
| Broadview: | 17.9 |
| Hillside: | 17.0 |
| Bellwood: | 5.1 |
| Berkeley: | 7.5 |
| Maywood: | 6.1 |
| Brookfield: | 19.1 |
| Melrose Park: | 12.3 |
| Oak Brook: | 10.9 |
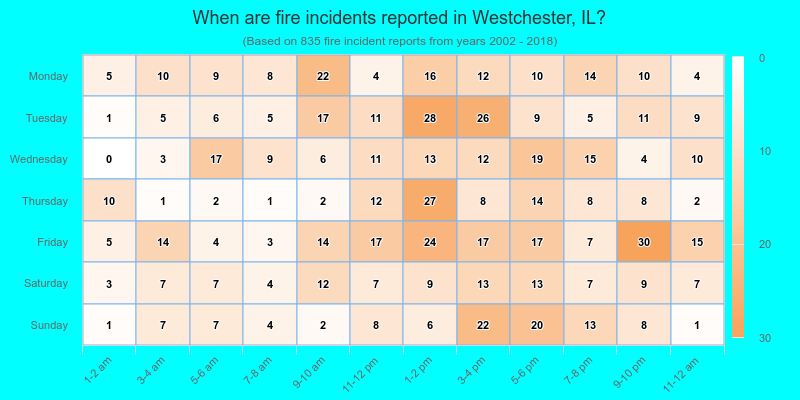
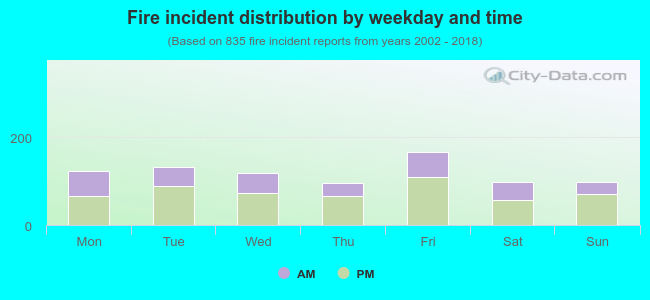 36.3% incidents where reported in the morning and 63.7% in the evening. The most fires (20.0%) took place on Friday, and the least (11.4%) on Thursday.
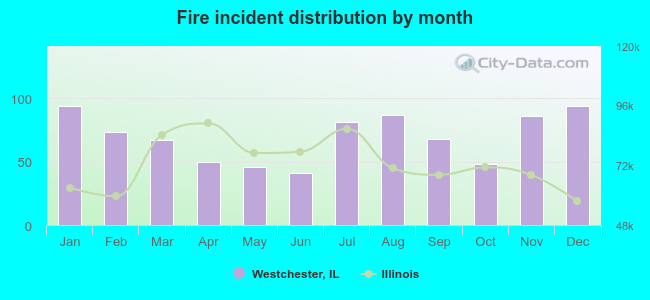 Based on the 835 fire incident reports from years 2002 - 2018 most fires (11.3%) took place during January, and the least (4.9%) in June.
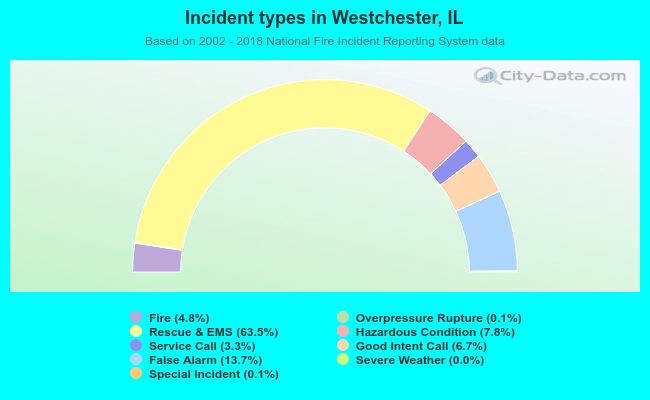 Out of all 17,330 cases reported during the years 2002 - 2018, the most belonged to the categories: Rescue & EMS (63.5%), False Alarm (13.7%), and Hazardous Condition (7.8%).
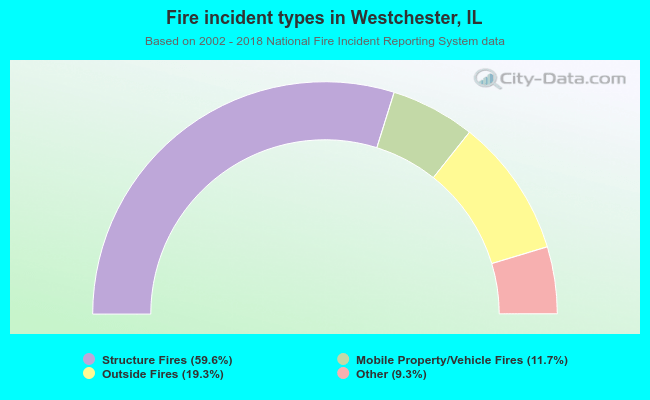 When looking into fire subcategories, the most reports belonged to: Structure Fires (59.6%), and Outside Fires (19.3%).